

Viorika/E+ via Getty Images
Get ready for charts, images, and tables because they are better than words. The ratings and outlooks we highlight here come after Scott Kennedy’s weekly updates in the REIT Forum. Your continued feedback is greatly appreciated, so please leave a comment with suggestions.
Interested in the huge yields of the mortgage REITs, but wary of the risk? It’s wise to be wary, though there are quite a few bargains in the sector. The area that is hitting the sweet spot for me on risk/reward is frequently the preferred shares. There are some great opportunities in this space, especially today. However, the great opportunities can shift from week to week. They rarely swing from good to bad, but relative valuations are a big deal. An investor who can swap back and forth between two similar shares once a year may end up with an extra 2% to 4% in their share count. Sometimes even more, but let’s not get greedy. That’s a nice addition to the already substantial dividend yields.
Today I want to focus on NLY-F (NLY.PF), NLY-G (NLY.PG), and NLY-I (NLY.PI). These shares have been mispriced relative to each other quite a few times so far this year. We can demonstrate that by using the $100k chart, which shows how much is needed to be invested on any day (with dividend reinvestment) to reach $100k today. If markets were efficient, these lines would move in an extremely strong correlation. They wouldn’t move exactly the same amount, since higher rates occurring sooner will favor some shares over others, but the correlation would be extremely strong.
This is the chart for 2022:
The REIT Forum
You can see that the correlation is strong, but there are some significant gaps that show up. Often those gaps last between two days and a couple of months. When we see a disconnect here, it signals that the risk/reward picture may have twisted between shares. Now some investors will argue that all the shares are down so they must be bad. Given what has happened to the market as a whole, I think that is a stupid argument. That simply is not how investing works. Therefore, I won’t go into answering it further.
Looking at the right side of the chart, you may notice that the blue and orange lines fell further than the red line. That means NLY-I and NLY-F recently fell much harder than NLY-G. The gap from the top of that last spike is about a $6,000 difference, which comes out to about 6%. That’s a very material swing in relative values for shares that are so similar. How would you confirm that this is a market failure as opposed to a correction of a prior failure? There are two techniques. The first is to glance at the rest of the chart. The market is far from perfectly efficient. However, it will rarely allow a huge error in pricing for similar securities to exist for many months.
To make that simple, it means a bar that was higher earlier in the chart (as shown in the box) is more like to be on sale. Remember, we’re only comparing similar securities. In this case, it is telling us that NLY-I (the orange line) may be on sale. Likewise, the outperformance for NLY-G (the red line) since June 2022 raises some questions.
The next technique is simply to use our price targets. We evaluate the shares on several metrics and projecting future cash flows is an important part of that process. Using our price targets, we are able to confirm that NLY-I is the share that went on sale:
The REIT Forum
NLY-I has the largest discount to our targets by about 4%. This confirms our thought process about which share is offering the best deal.
However, we also see that NLY-F has a slightly larger discount (to our targets) than NLY-G. That’s pretty rare. We believe NLY-F and NLY-G are trading at about the right ratio today. 1.07 shares of NLY-G = 1 share of NLY-F is about right for today. You can use the $100k chart to look for which line was higher in the past. Based on most starting dates since June, it would cost at least 107 shares of NLY-G to get 100 shares of NLY-F.
The Biggest Disconnect Here
The biggest issue here is the relative value between NLY-G and NLY-I. A share of NLY-G costs $.10 more than a share of NLY-I. Is that reasonable? Not a fundamental level. NLY-G will float earlier than NLY-I. NLY-G gets the floating date on 3/31/2023. For NLY-I, it won’t happen until 6/30/2024. That’s a difference of 15 months (5 dividends).
Here are the time periods:
- Until 3/31/2023, NLY-I gets a tiny bit bigger dividend. It’s only worth about $.03. Advantage, NLY-I by $.03.
- From 3/31/2023 to 6/30/2024, NLY-G gets a bigger dividend. Assuming short-term rates increase by another 140 basis points, NLY-G would earn $3.00 and NLY-I would earn $2.11. Advantage NLY-G by $.89. Net of step 1, the advantage is $.86.
- From 6/30/2024 onwards, NLY-I pays an extra $.20 per share per year. NLY-I simply has a higher spread over floating rates. Investors get the floating rate plus the spread for each share. The investor in NLY-I is getting another $.20 per share per year indefinitely. Therefore, NLY-I catches up on cumulative cash flows around 9/30/2028.
Since NLY-I will always have a better dividend than NLY-G after 6/30/2024, anyone who buys NLY-G for more than NLY-I after 6/30/2024 would not be smart. Therefore, we can all agree NLY-I should trade above NLY-G by late summer 2024.
Now is it worth waiting an extra 4 years to catch up on total cash flows? Some investors will say no, though I would say yes. Given the risk of NLY-G simply not being called, I like the prospect of an extra $.20 per share per year. Investors in NLY-I are essentially paying up $.86 between 3/31/2023 and 6/30/2024 to get an extra $.20 per share per year. The yield on that additional investment would be 23%. However, if short-term rates drop before 6/30/2024, then some of the NLY-G dividends are smaller. In that case, NLY-G’s advantage for the period shrinks. Instead of $.86, it could be $.66. The yield on the additional investment in NLY-I would be even higher.
But that math all assumes that investors are picking between NLY-I and NLY-G at the same share prices. Today, NLY-I is actually $.10 cheaper than NLY-G. So, NLY-G’s hypothetical advantage of $.86 is already down to $.76 since NLY-I is cheaper.
What happens if NLY-G gets called before then? Okay, then NLY-G wins. Congratulations. In that scenario, NLY-G is the winner. However, since NLY-G’s floating spread is only 4.172%, I don’t think a call is likely. It might happen, but there’s a good chance it doesn’t. If it doesn’t happen, then I think giving up a little cash flow between 3/31/2023 and 6/30/2024 is a low price to pay for the higher dividend rate.
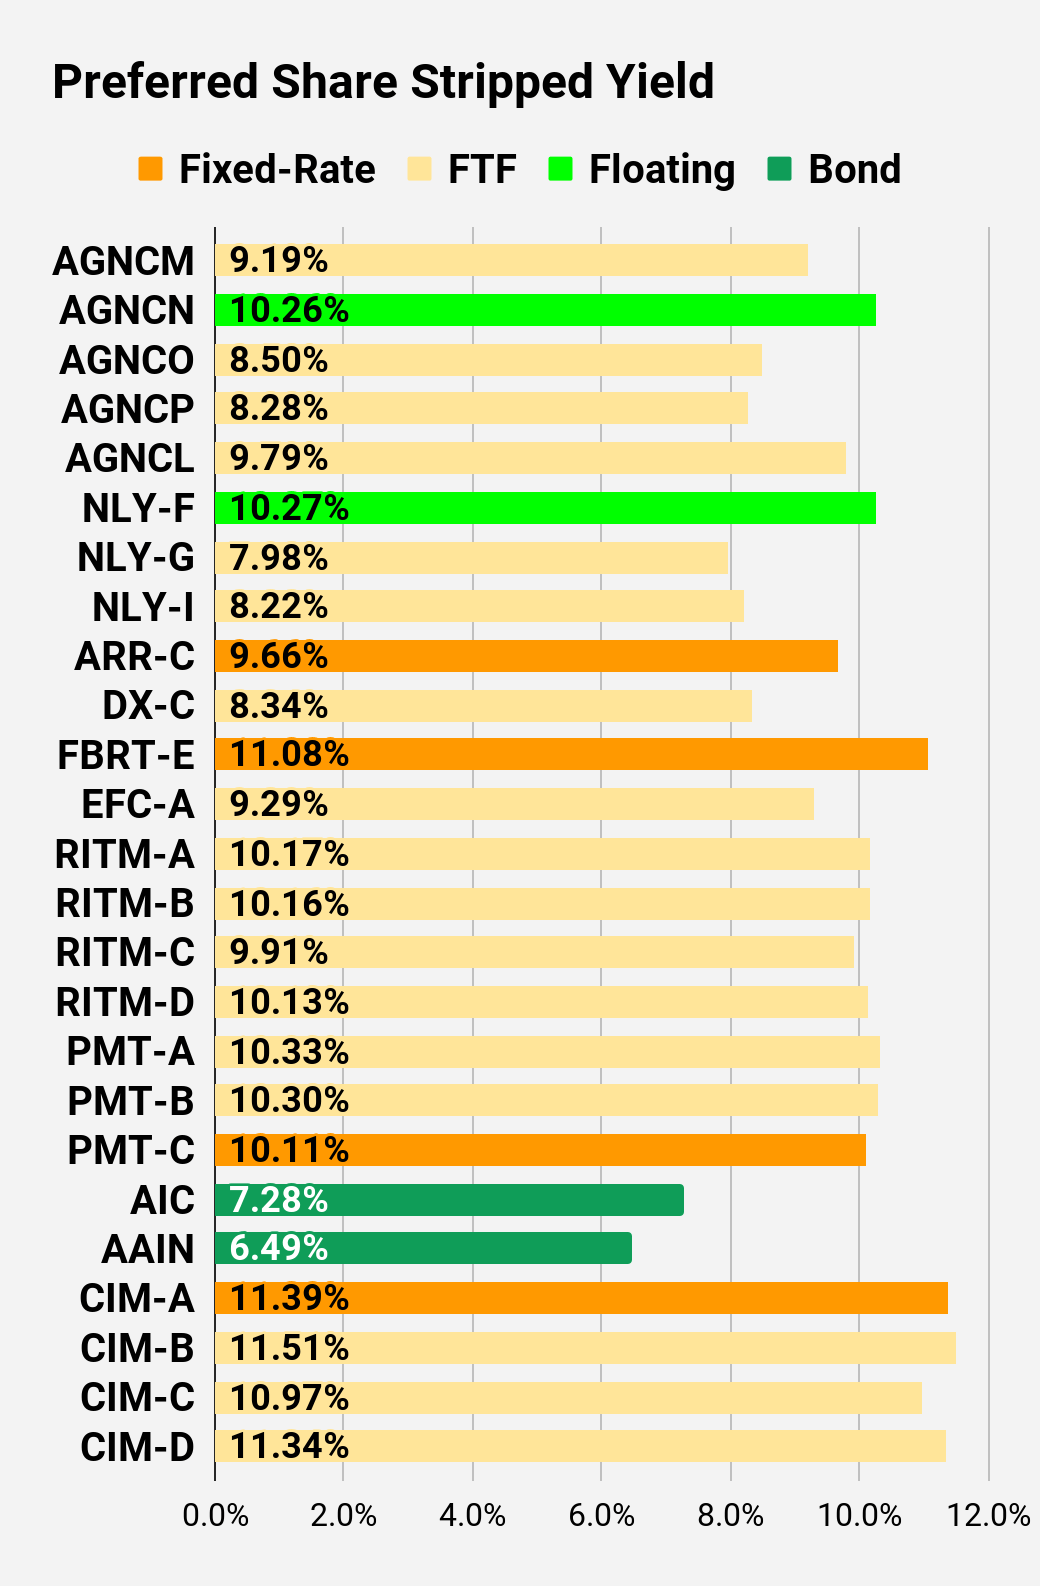
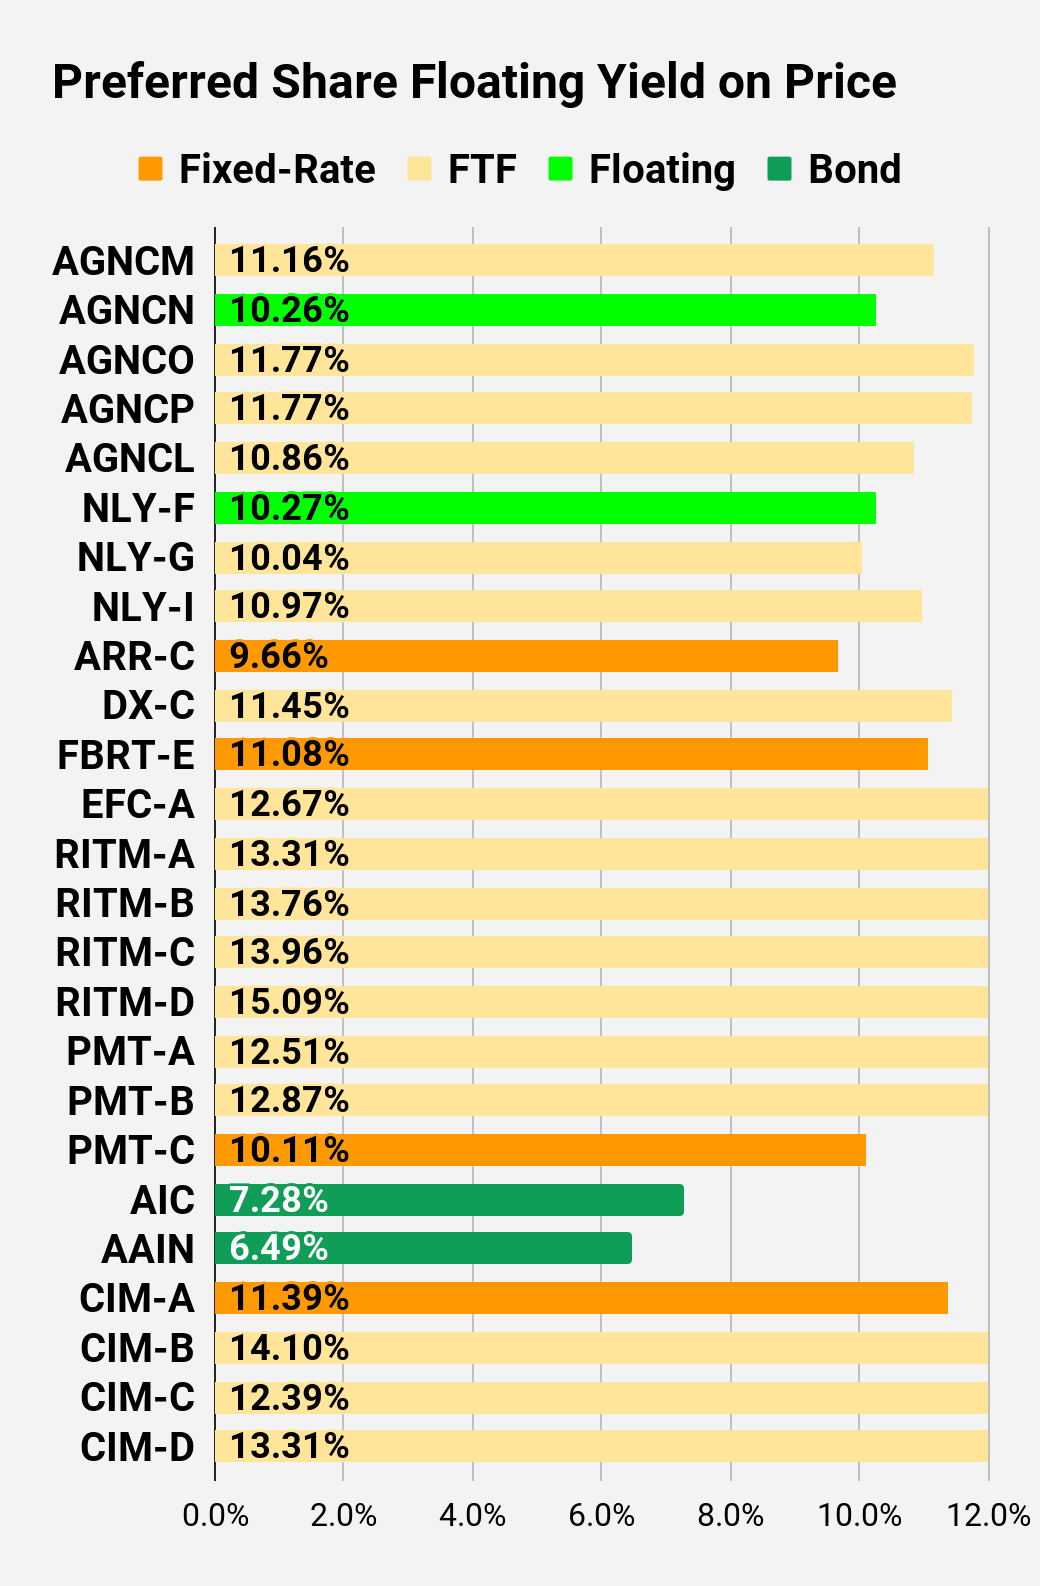
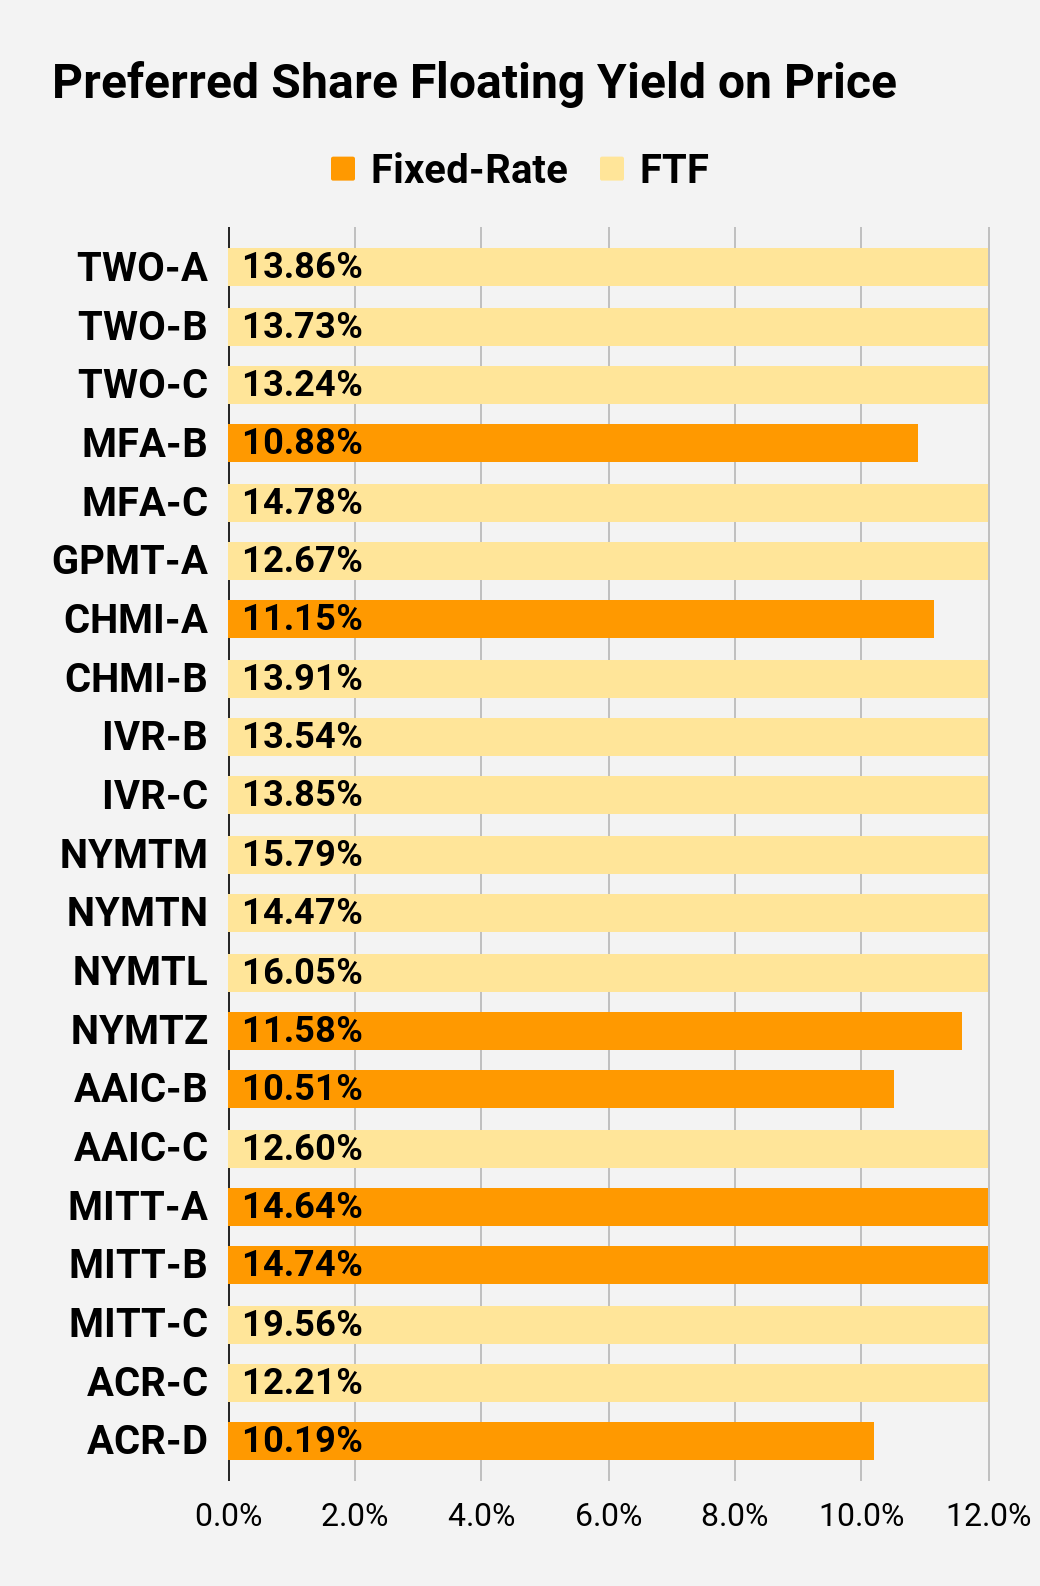
Yields If Floating Today
If the floating rates were being set today, each of these shares would yield over 10%. However, short-term rates are projected to rise a few times in the next several months. That could easily push yields past 11%. The precise figures are in the preferred share charts near the bottom of the article.
What If I’m Going To Sell In May 2024?
Some investors plan to sell just before the floating rate kicks in. The next investor can deal with it. When I see those strategies, I wonder what kind of clown they expect to show up at the last minute to bail them out. In an efficient market, the investor buying NLY-G off them in late 2023 needs to be comparing it to NLY-I. It seems so obvious. Yet, I have to admit that the market has demonstrated absolute stupidity in this area before.
Such clowns may very well show up. They have in other shares. The pricing disparity between the AGNC preferred shares was insanity. Over a hundred million shares of AGNCL were issued at $24.2125. The market even opened the first day with them at $24.50 despite the other AGNC preferred shares offering a vastly superior deal. Prices plunged over the next several days until AGNCL traded at a very reasonable spread to most of the other AGNC preferred shares. They were all cheap, but on a relative basis, most (all except AGNCN) were similarly cheap. AGNCL bounced back a bit and is now a bit more expensive relative to AGNCM / AGNCO / AGNCP.
It was a mystery to me that any buyers would actually show up. Yet, the market demonstrated it was entirely capable of this. With AGNCL trading around $20.00 today, some took a big hit.
So Many Opportunities
Whether we’re looking at mortgage REIT and BDC common shares, preferred shares, or equity REITs, we have far more bullish ratings today than in prior periods. We’re not here trying to call the bottom. We’re just looking to buy great investments as they become available. For this sector, that also means constantly evaluating similar shares to see when one share is offering a superior return for a very similar amount of risk.
The rest of the charts in this article may be self-explanatory to some investors. However, if you’d like to know more about them, you’re encouraged to see our notes for the series. The part below is reproduced in each article to provide investors with easy access to the updated charts. It is my gift to readers.
Stock Table
We will close out the rest of the article with the tables and charts we provide for readers to help them track the sector for both common shares and preferred shares.
We’re including a quick table for the common shares that will be shown in our tables:
Let the images begin!
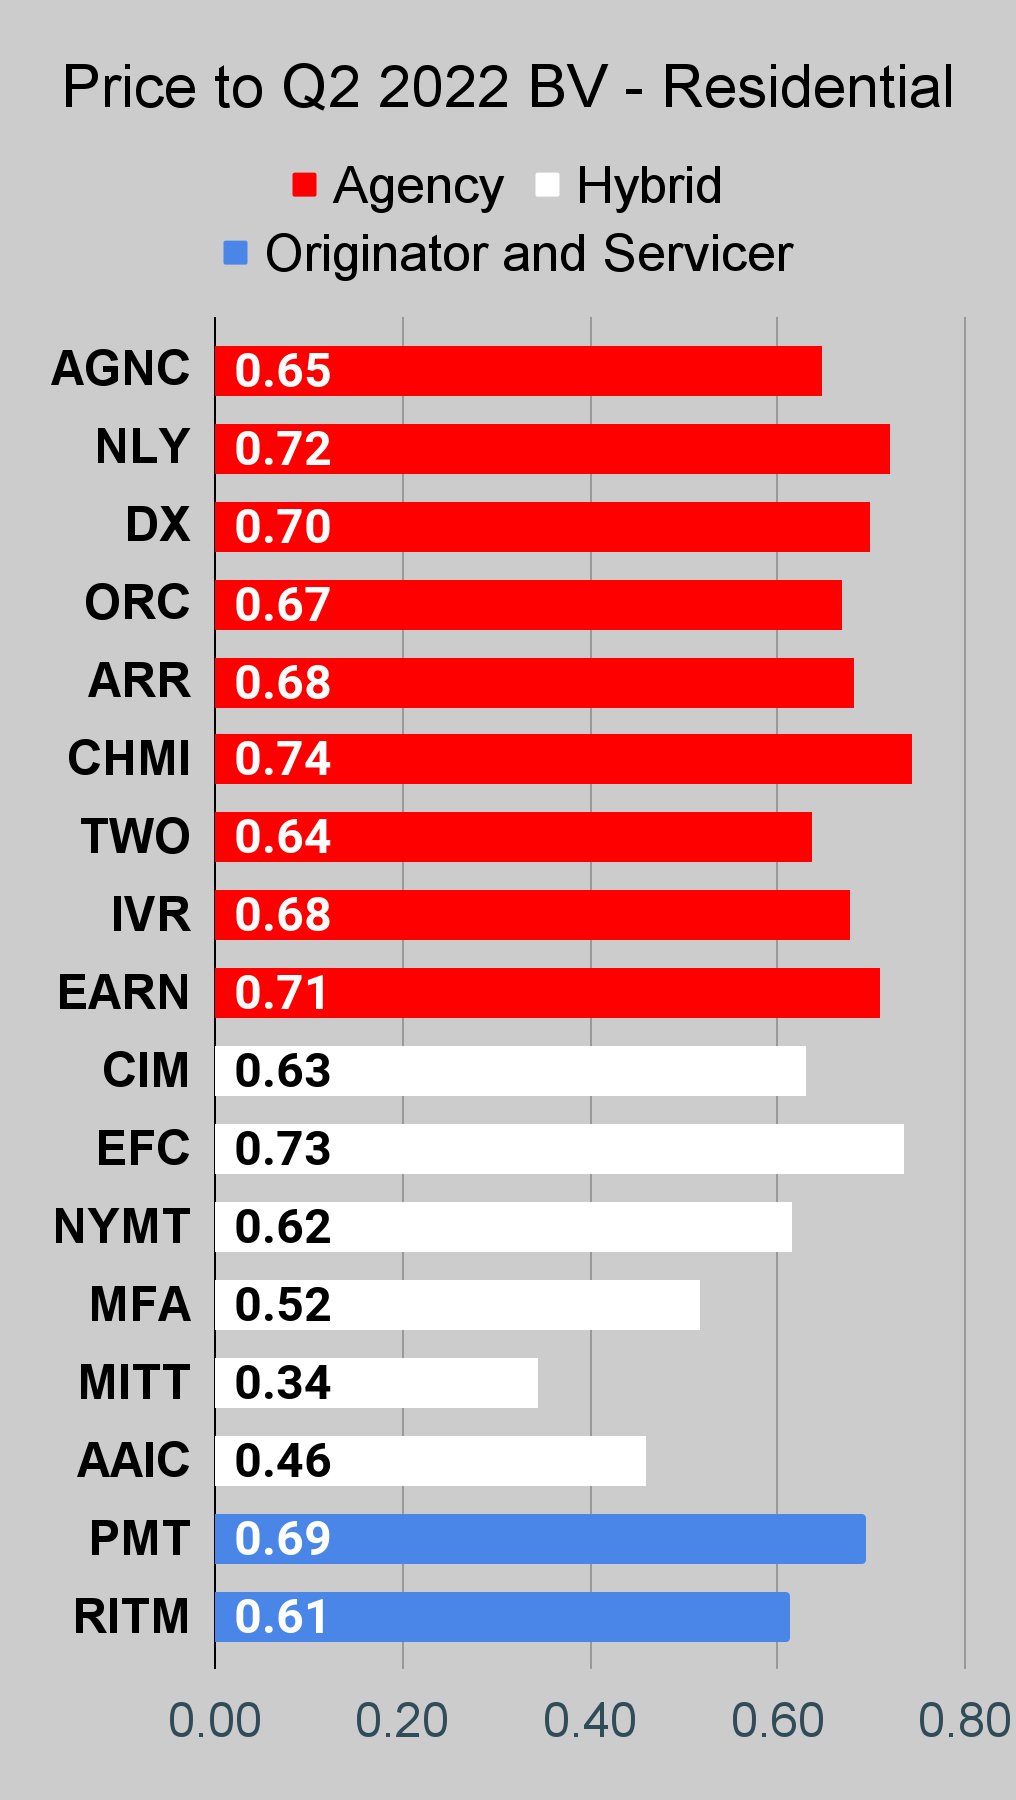
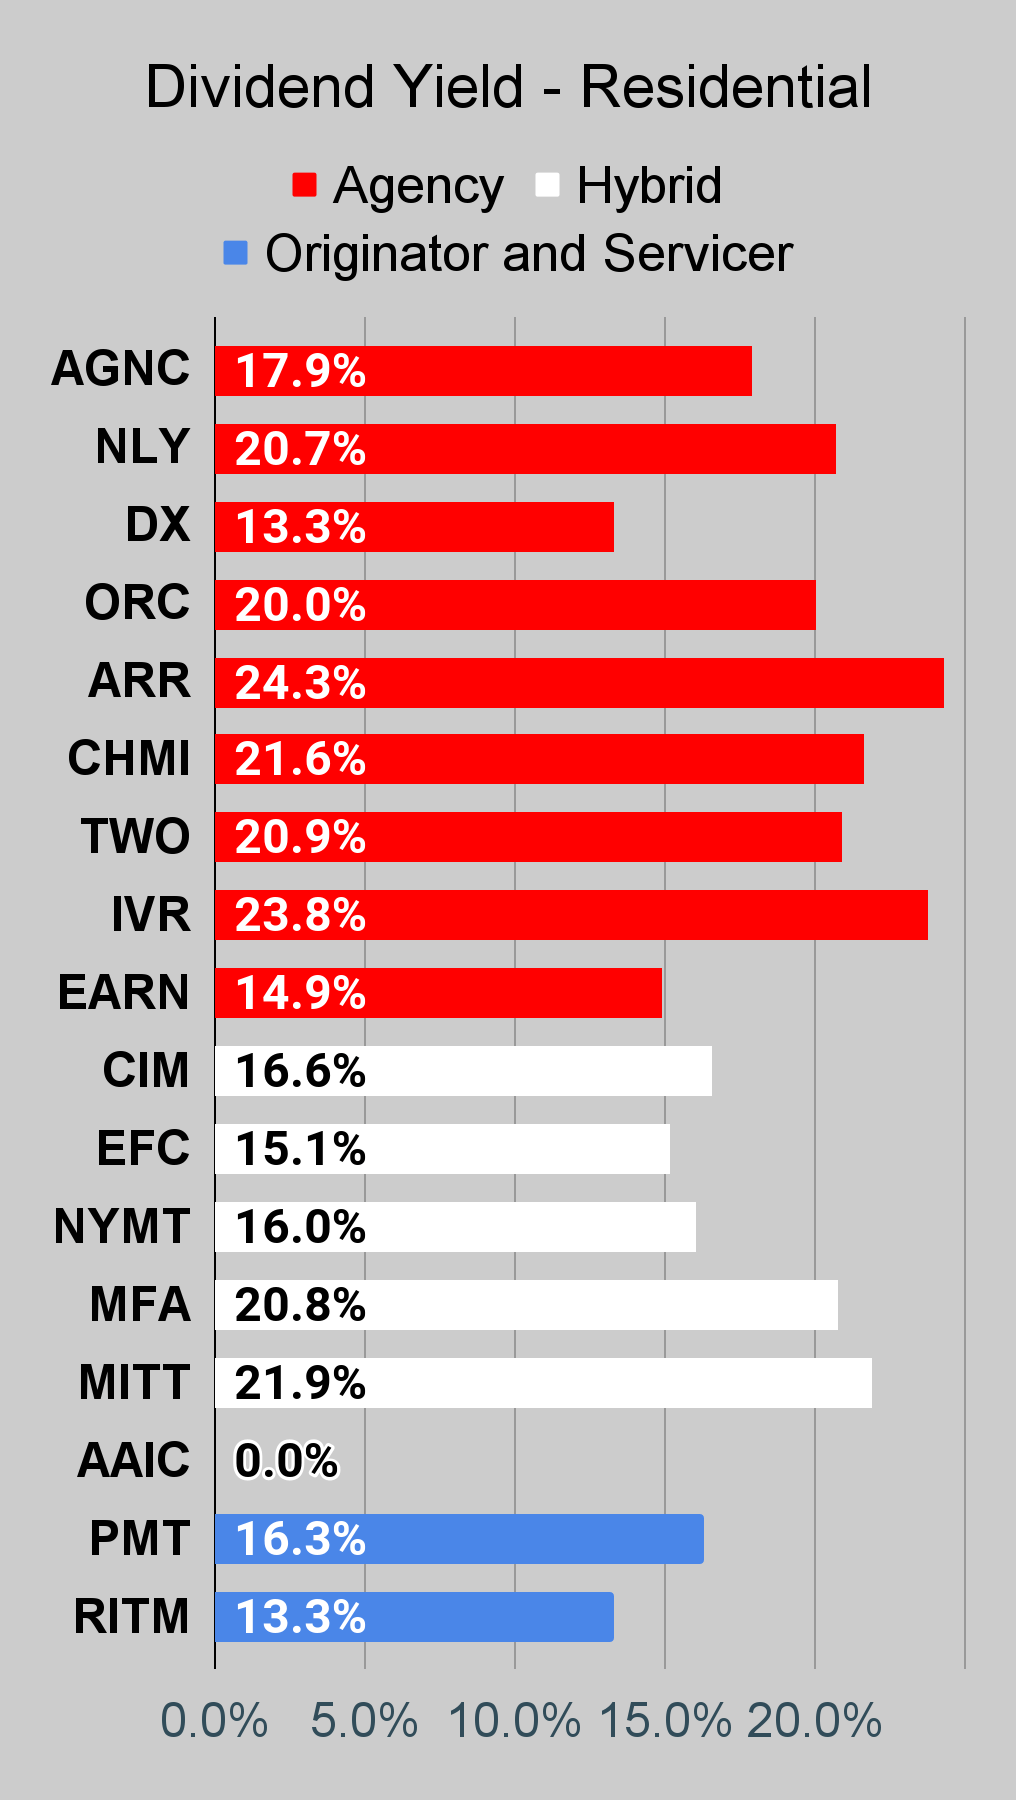
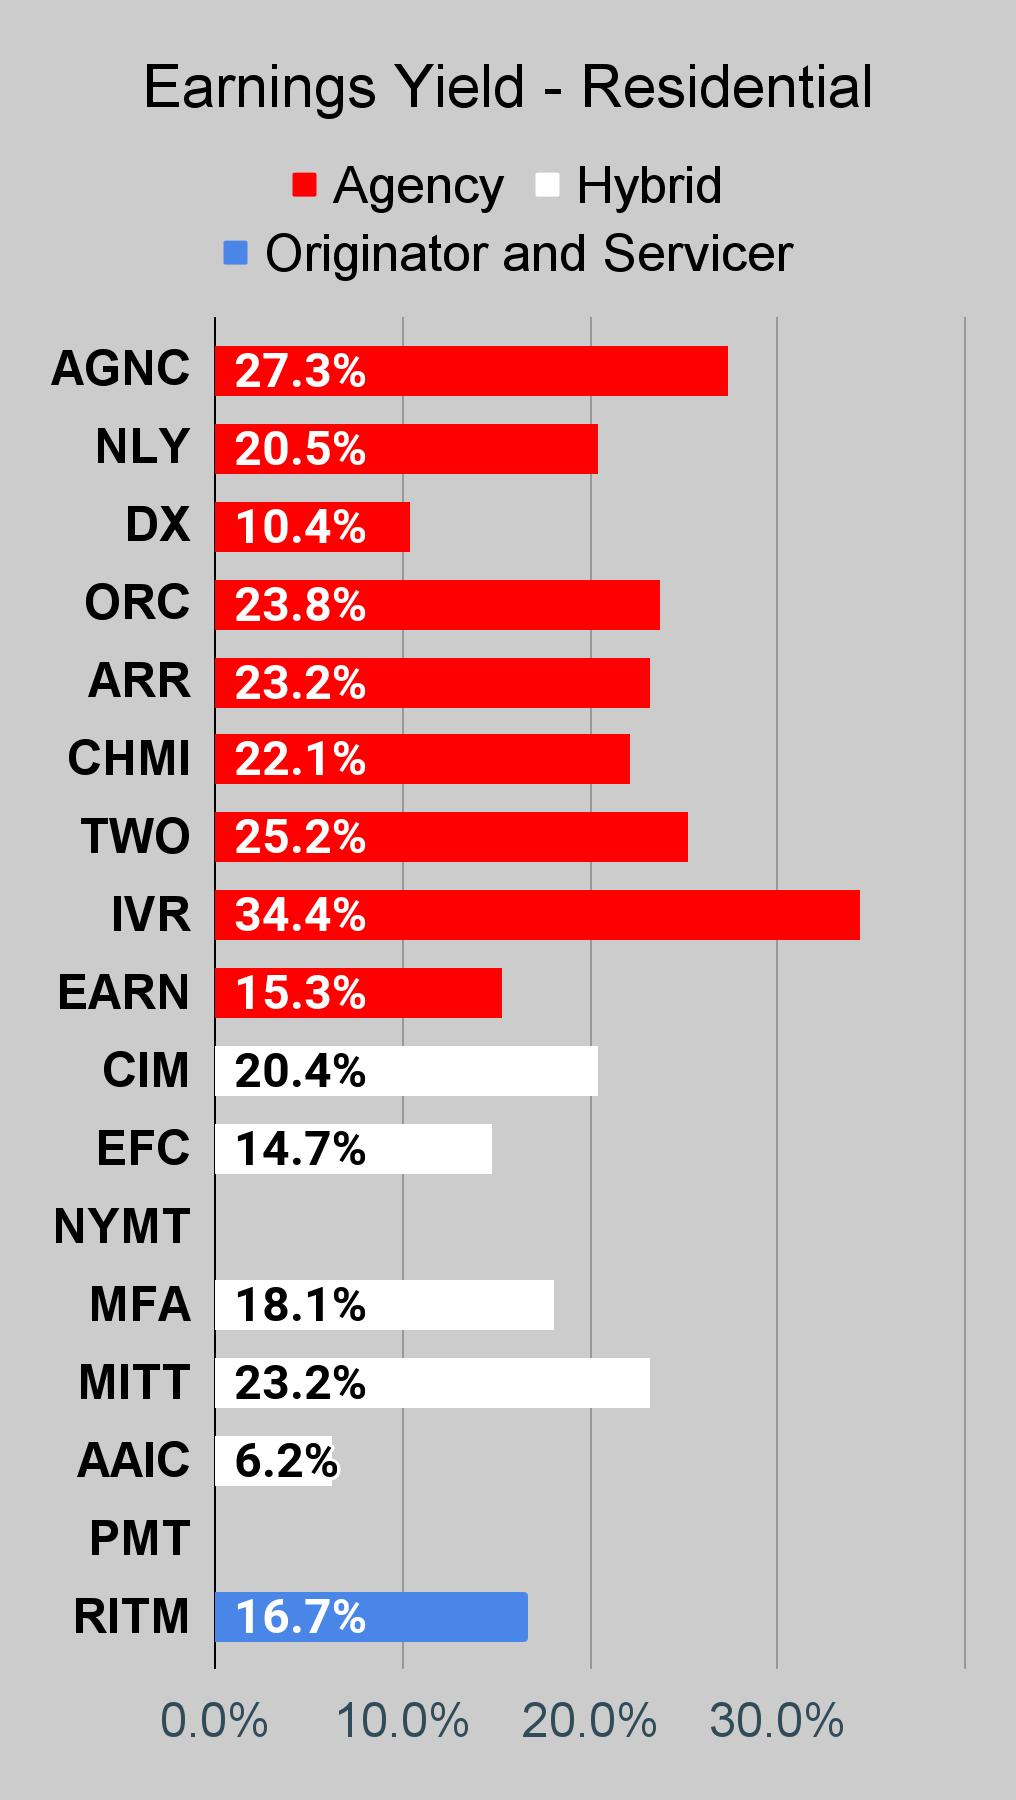
Residential Mortgage REIT Charts
Note: The chart for our public articles uses the book value per share from the latest earnings release. The current estimated book value per share is used in reaching our targets and trading decisions. It is available in our service, but those estimates are not included in the charts below. PMT and NYMT are not showing an earnings yield metric as neither REIT provides a quarterly “Core EPS” metric.
 The REIT Forum |
 The REIT Forum |
 The REIT Forum |
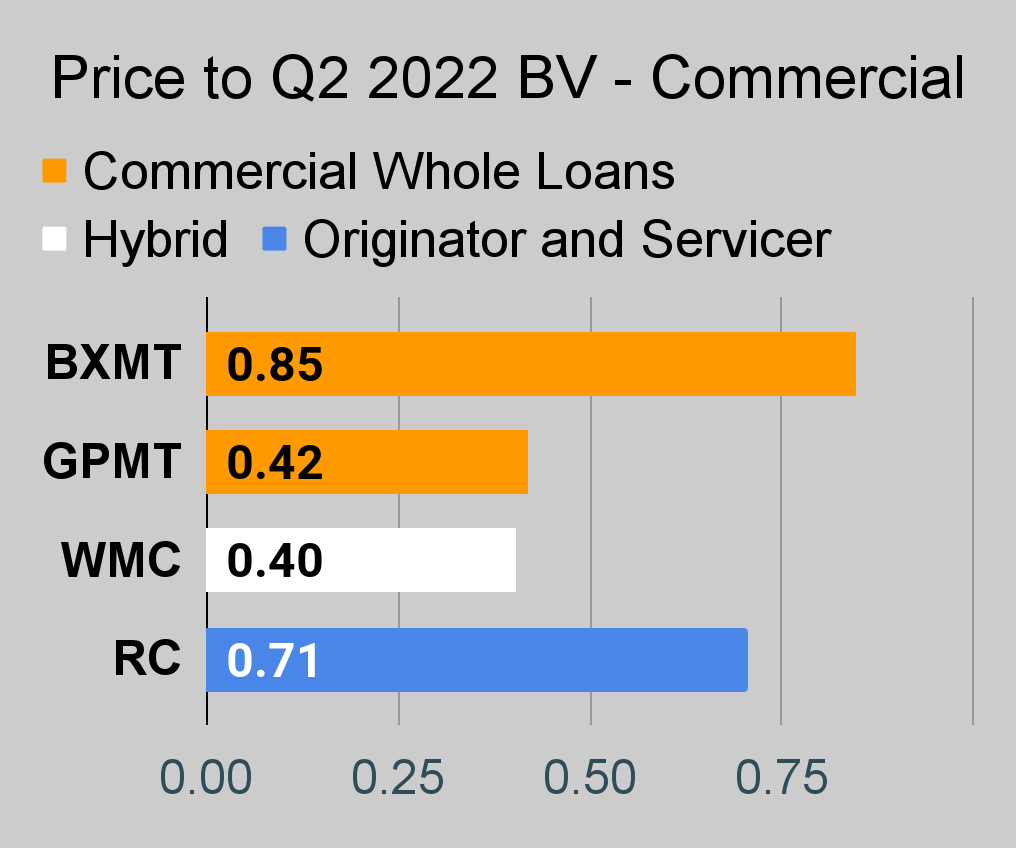
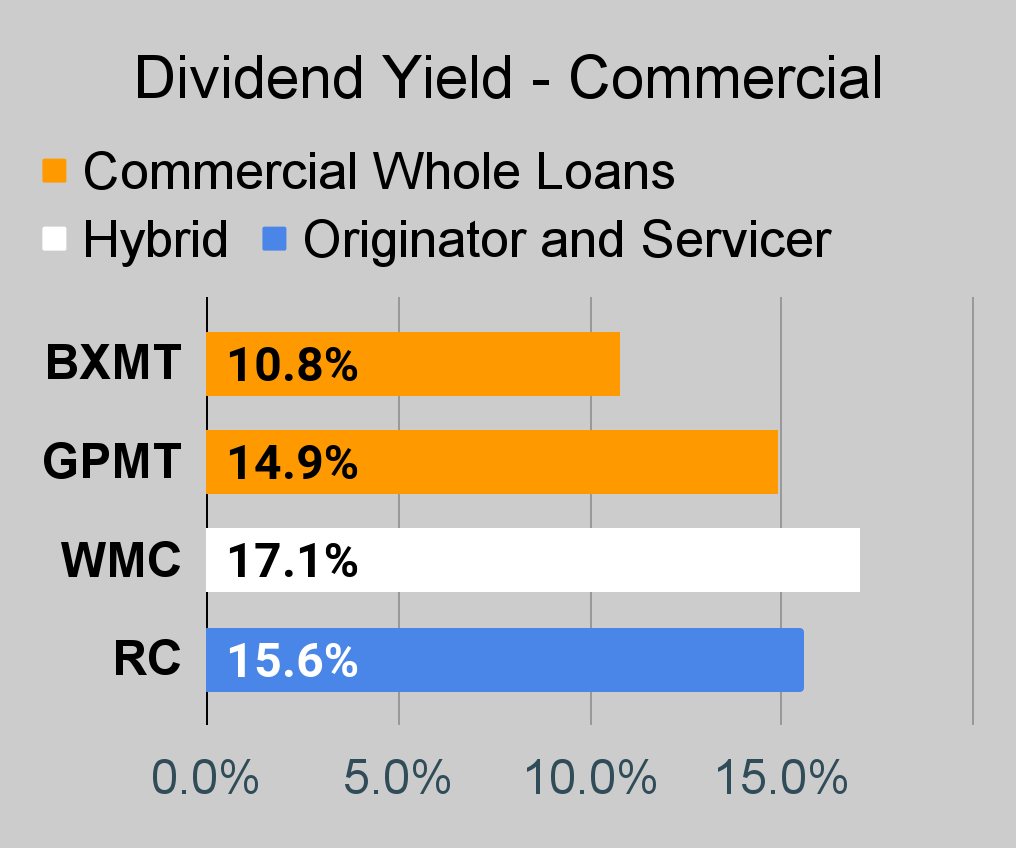
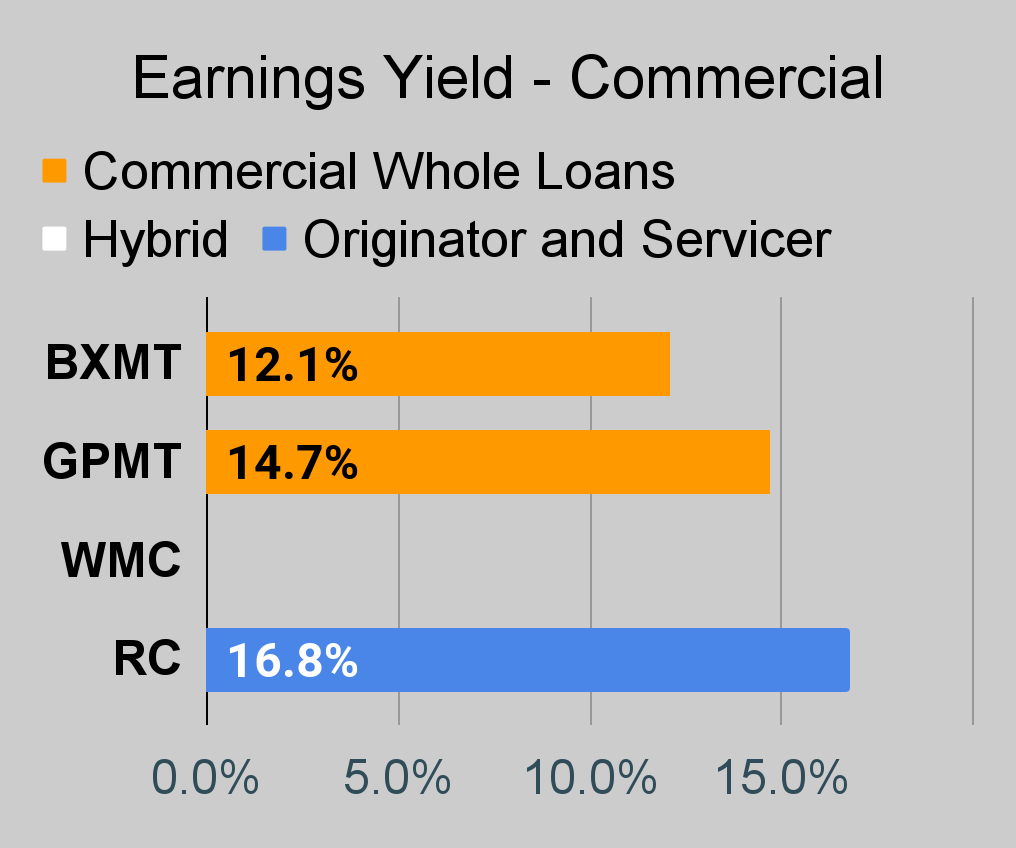
Commercial Mortgage REIT Charts
 The REIT Forum |
 The REIT Forum |
 The REIT Forum |
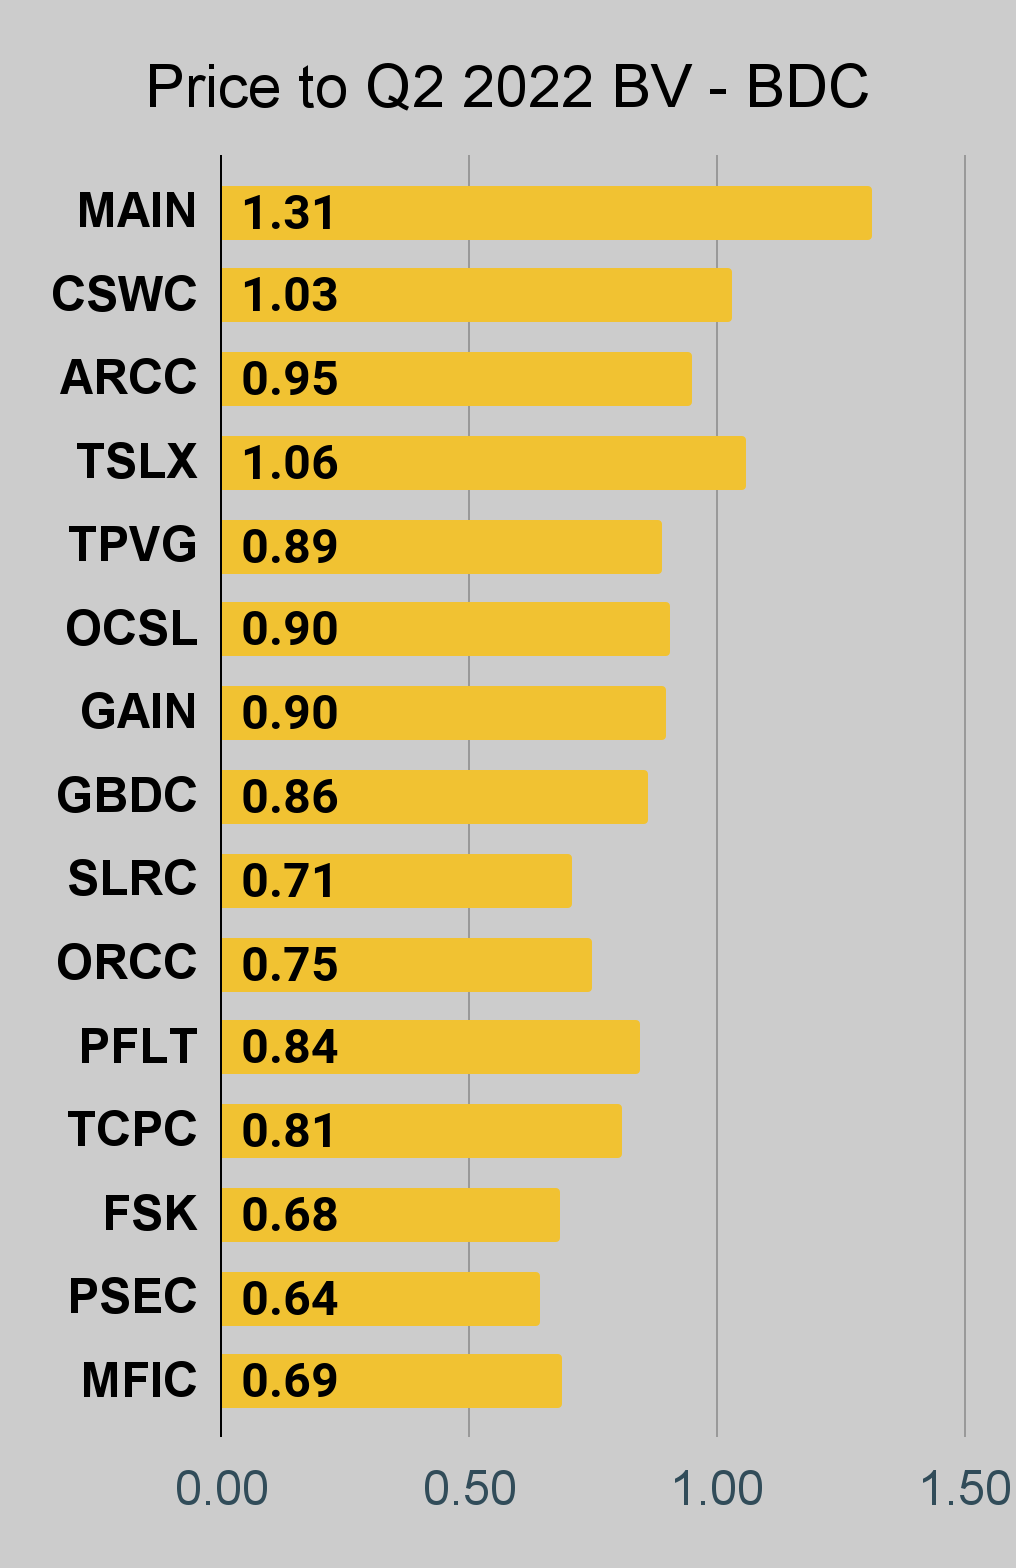
BDC Charts
 The REIT Forum |
 The REIT Forum |
 The REIT Forum |
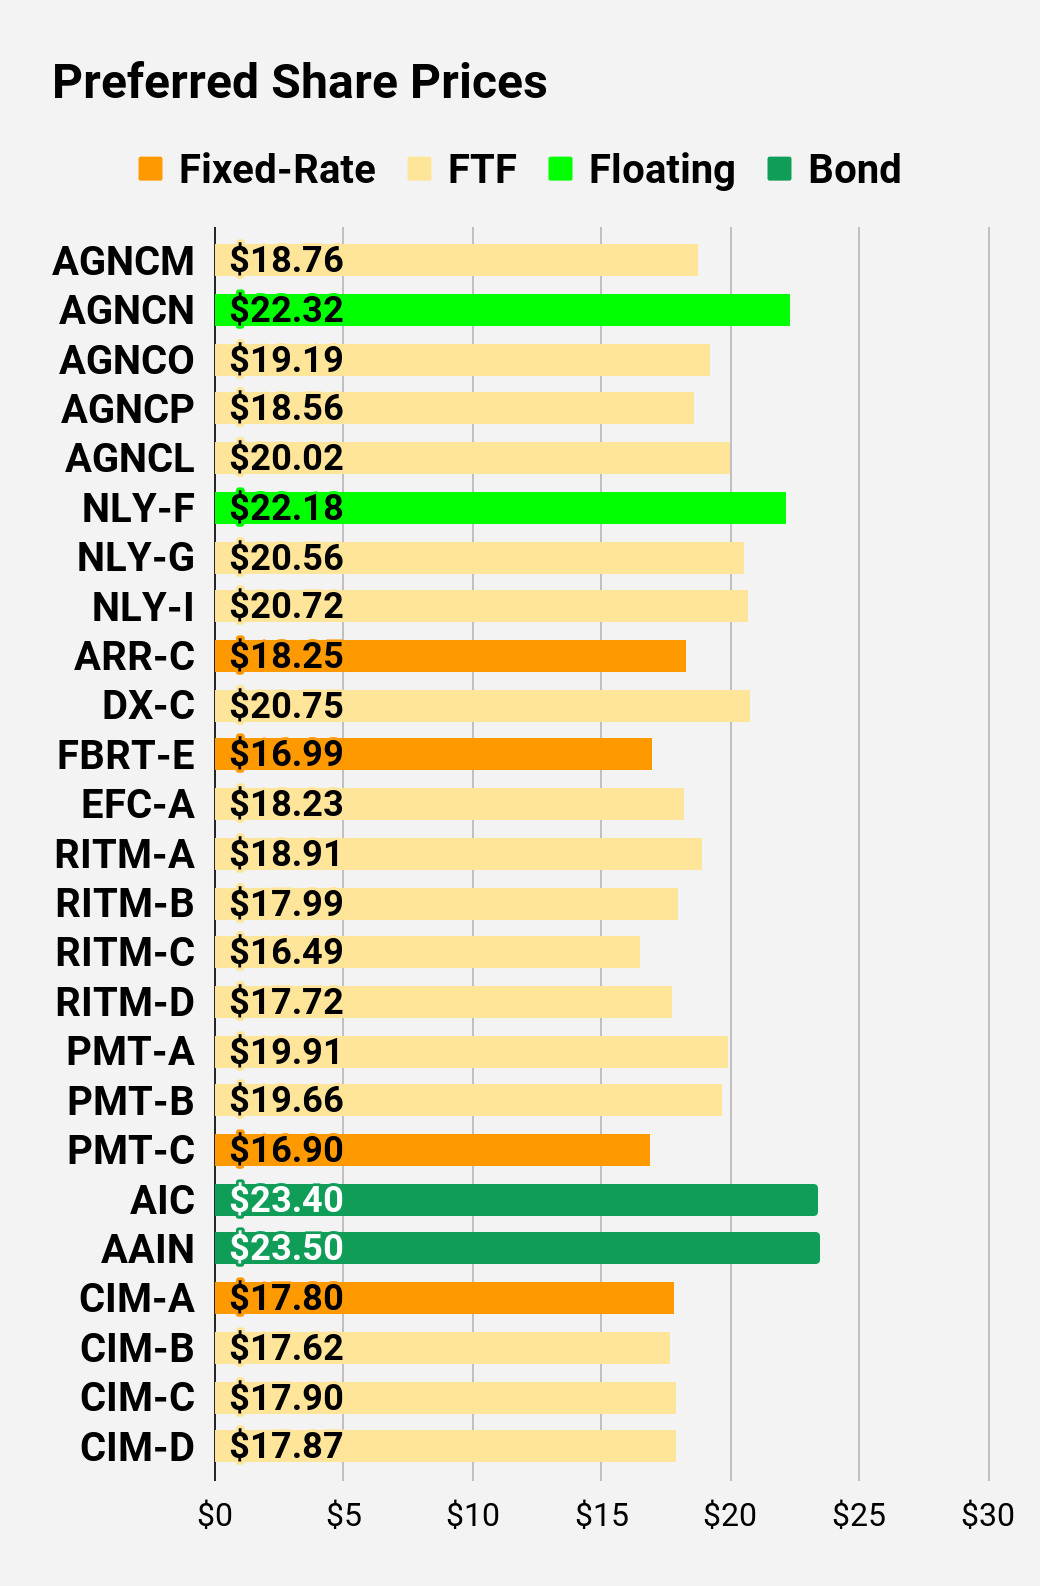
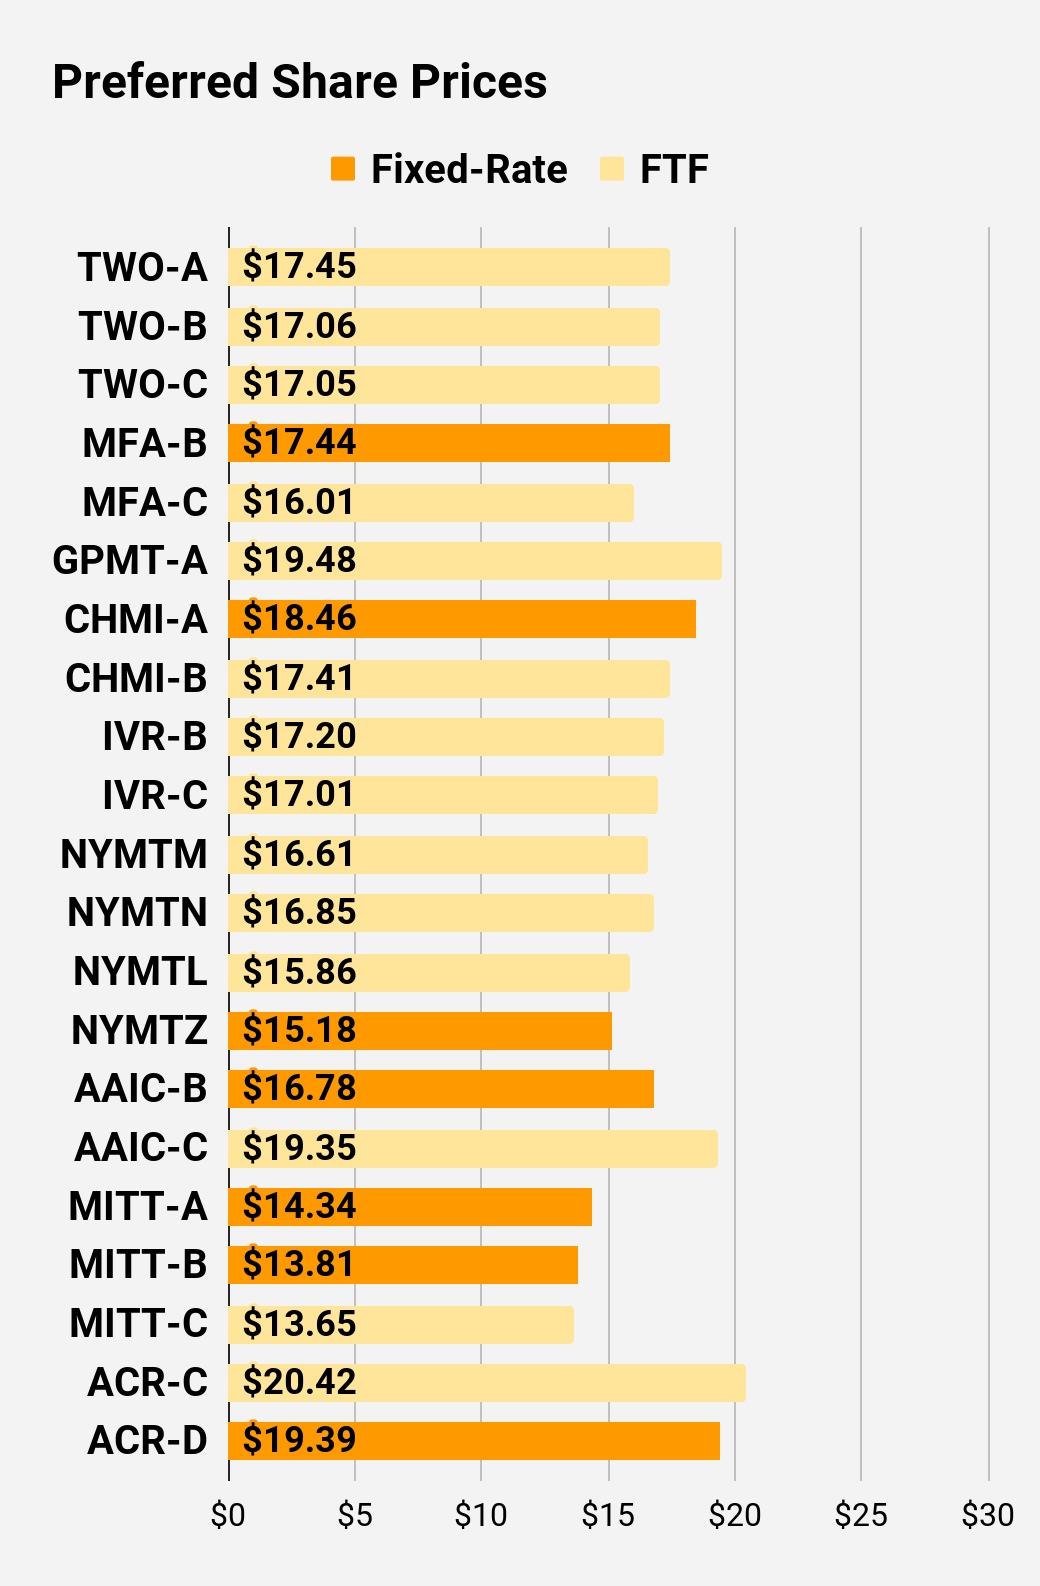
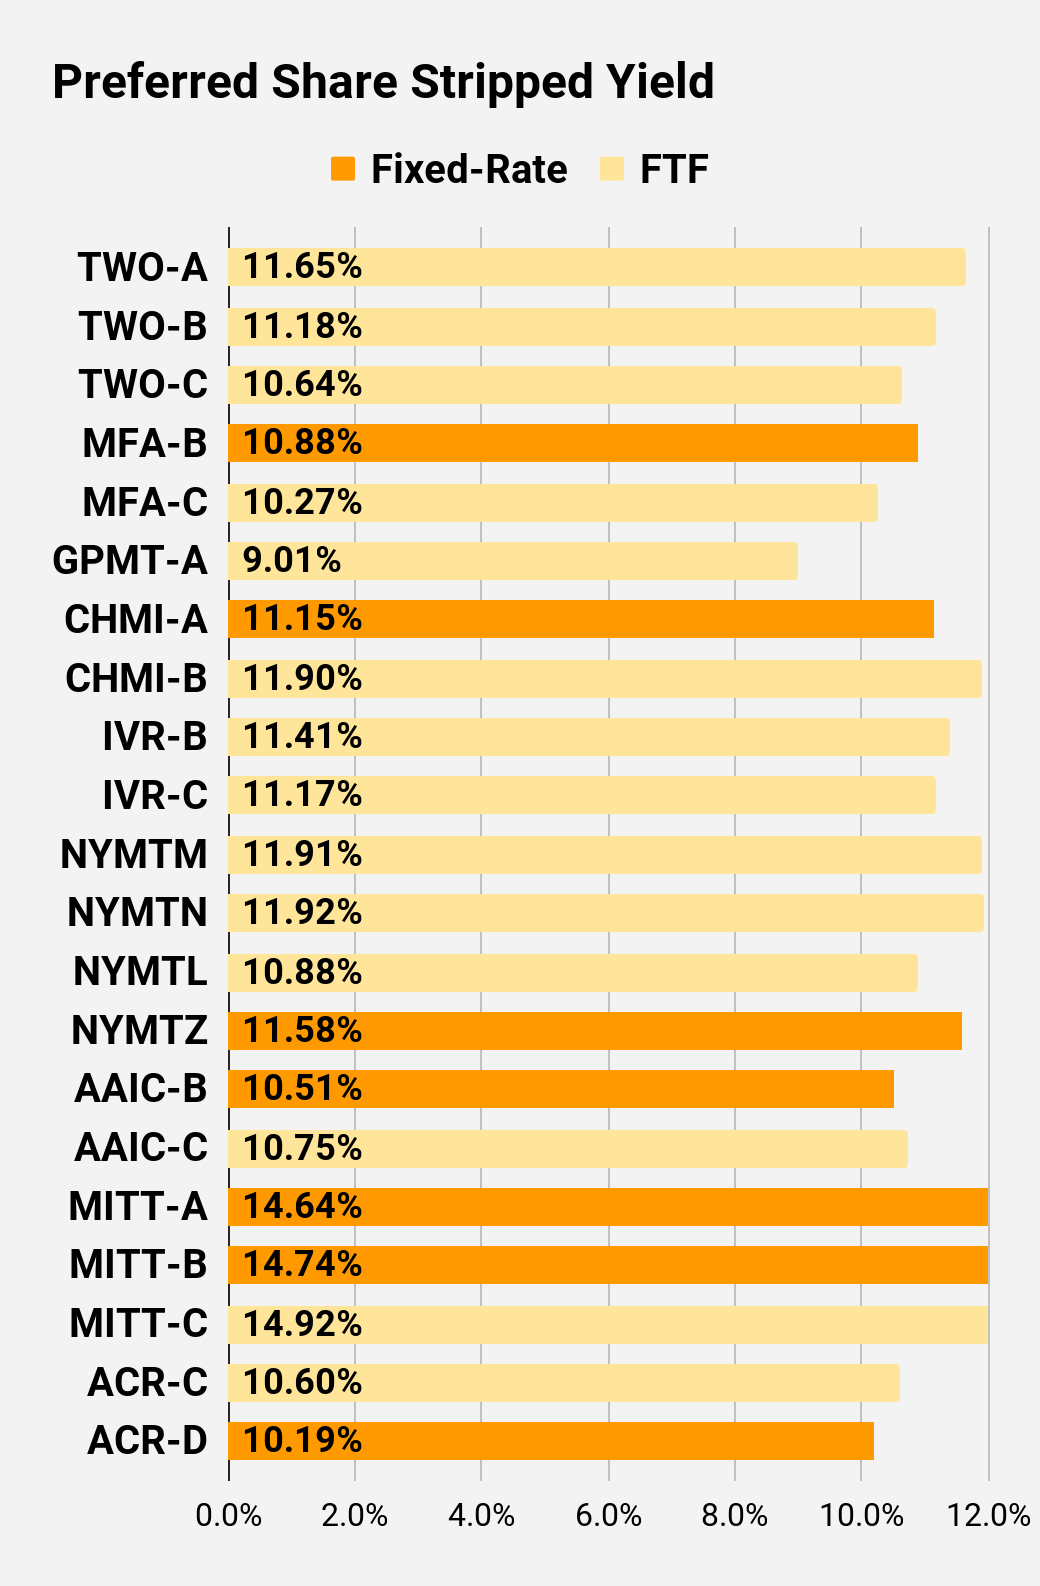
Preferred Share Charts
I changed the coloring a bit. We needed to adjust to include that the first fixed-to-floating shares have transitioned over to floating rates.
 The REIT Forum |
 The REIT Forum |
 The REIT Forum |
 The REIT Forum |
 The REIT Forum |
 The REIT Forum |
Preferred Share Data
Beyond the charts, we’re also providing our readers with access to several other metrics for the preferred shares.
After testing out a series on preferred shares, we decided to try merging it into the series on common shares. After all, we are still talking about positions in mortgage REITs. We don’t have any desire to cover preferred shares without cumulative dividends, so any preferred shares you see in our column will have cumulative dividends. You can verify that by using Quantum Online. We’ve included the links in the table below.
To better organize the table, we needed to abbreviate column names as follows:
- Price = Recent Share Price – Shown in Charts
- BoF = Bond or FTF (Fixed-to-Floating)
- S-Yield = Stripped Yield – Shown in Charts
- Coupon = Initial Fixed-Rate Coupon
- FYoP = Floating Yield on Price – Shown in Charts
- NCD = Next Call Date (the soonest shares could be called)
- Note: For all FTF issues, the floating rate would start on NCD.
- WCC = Worst Cash to Call (lowest net cash return possible from a call)
- QO Link = Link to Quantum Online Page
Second Batch:
Strategy
Our goal is to maximize total returns. We achieve those most effectively by including “trading” strategies. We regularly trade positions in the mortgage REIT common shares and BDCs because:
- Prices are inefficient.
- Long-term, share prices generally revolve around book value.
- Short-term, price-to-book ratios can deviate materially.
- Book value isn’t the only step in analysis, but it is the cornerstone.
We also allocate to preferred shares and equity REITs. We encourage buy-and-hold investors to consider using more preferred shares and equity REITs.
Performance
We compare our performance against 4 ETFs that investors might use for exposure to our sectors:
The REIT Forum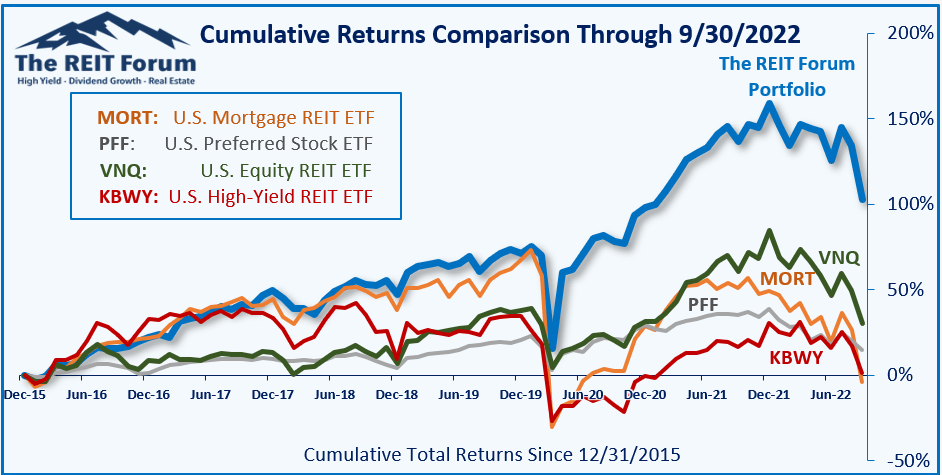
The 4 ETFs we use for comparison are:
|
Ticker |
Exposure |
|
One of the largest mortgage REIT ETFs |
|
|
One of the largest preferred share ETFs |
|
|
Largest equity REIT ETF |
|
|
The high-yield equity REIT ETF. Yes, it has been dreadful. |
When investors think it isn’t possible to earn solid returns in preferred shares or mortgage REITs, we politely disagree. The sector has plenty of opportunities, but investors still need to be wary of the risks. We can’t simply reach for yield and hope for the best. When it comes to common shares, we need to be even more vigilant to protect our principal by regularly watching prices and updating estimates for book value and price targets.
Ratings:
- NLY-I or NLY-F makes more sense than NLY-G. I would expect either to moderately outperform NLY-G. Investors in NLY-G may wish to trade 107 shares of NLY-G for 100 shares of NLY-F or trade 100 shares of NLY-G for 100 shares of NLY-I while taking a few pennies off the table. This isn’t the same as being bearish on NLY-G. That big dividend increase coming in 2023 is a big deal, but it isn’t enough to make NLY-G the better investment.
Be the first to comment