

georgeclerk/iStock Unreleased via Getty Images
Thesis
The Vanguard Total Stock Market ETF (NYSEARCA:VTI) and SPDR S&P 500 Trust ETF (NYSEARCA:SPY) are two of the most commonly used funds for investors to obtain wide exposure to the U.S. stock market. And they are interchangeable for most purposes. They both offer excellent liquidity, tradability, low fee, and also broad market representation. And their past performance and risks are nearly identical most of the time as you can see from the following chart.
Their performances closely tracked each as seen and so did their volatilities. To wit, the annual return difference is only 0.39% per annum. And bear in mind that a good part of the difference is caused by the fee, not the indexing strategy. VTI charges a lower fee of 0.03% compared to SPY’s 0.09% fee, accounting for a 0.06% difference, about 15% of the total difference already. In terms of risks, VTI has exhibited an average standard deviation of 14.33% in the past, compared to SPY’s 13.83%. The difference is only 0.5%.
Source: Portfolio Visualizer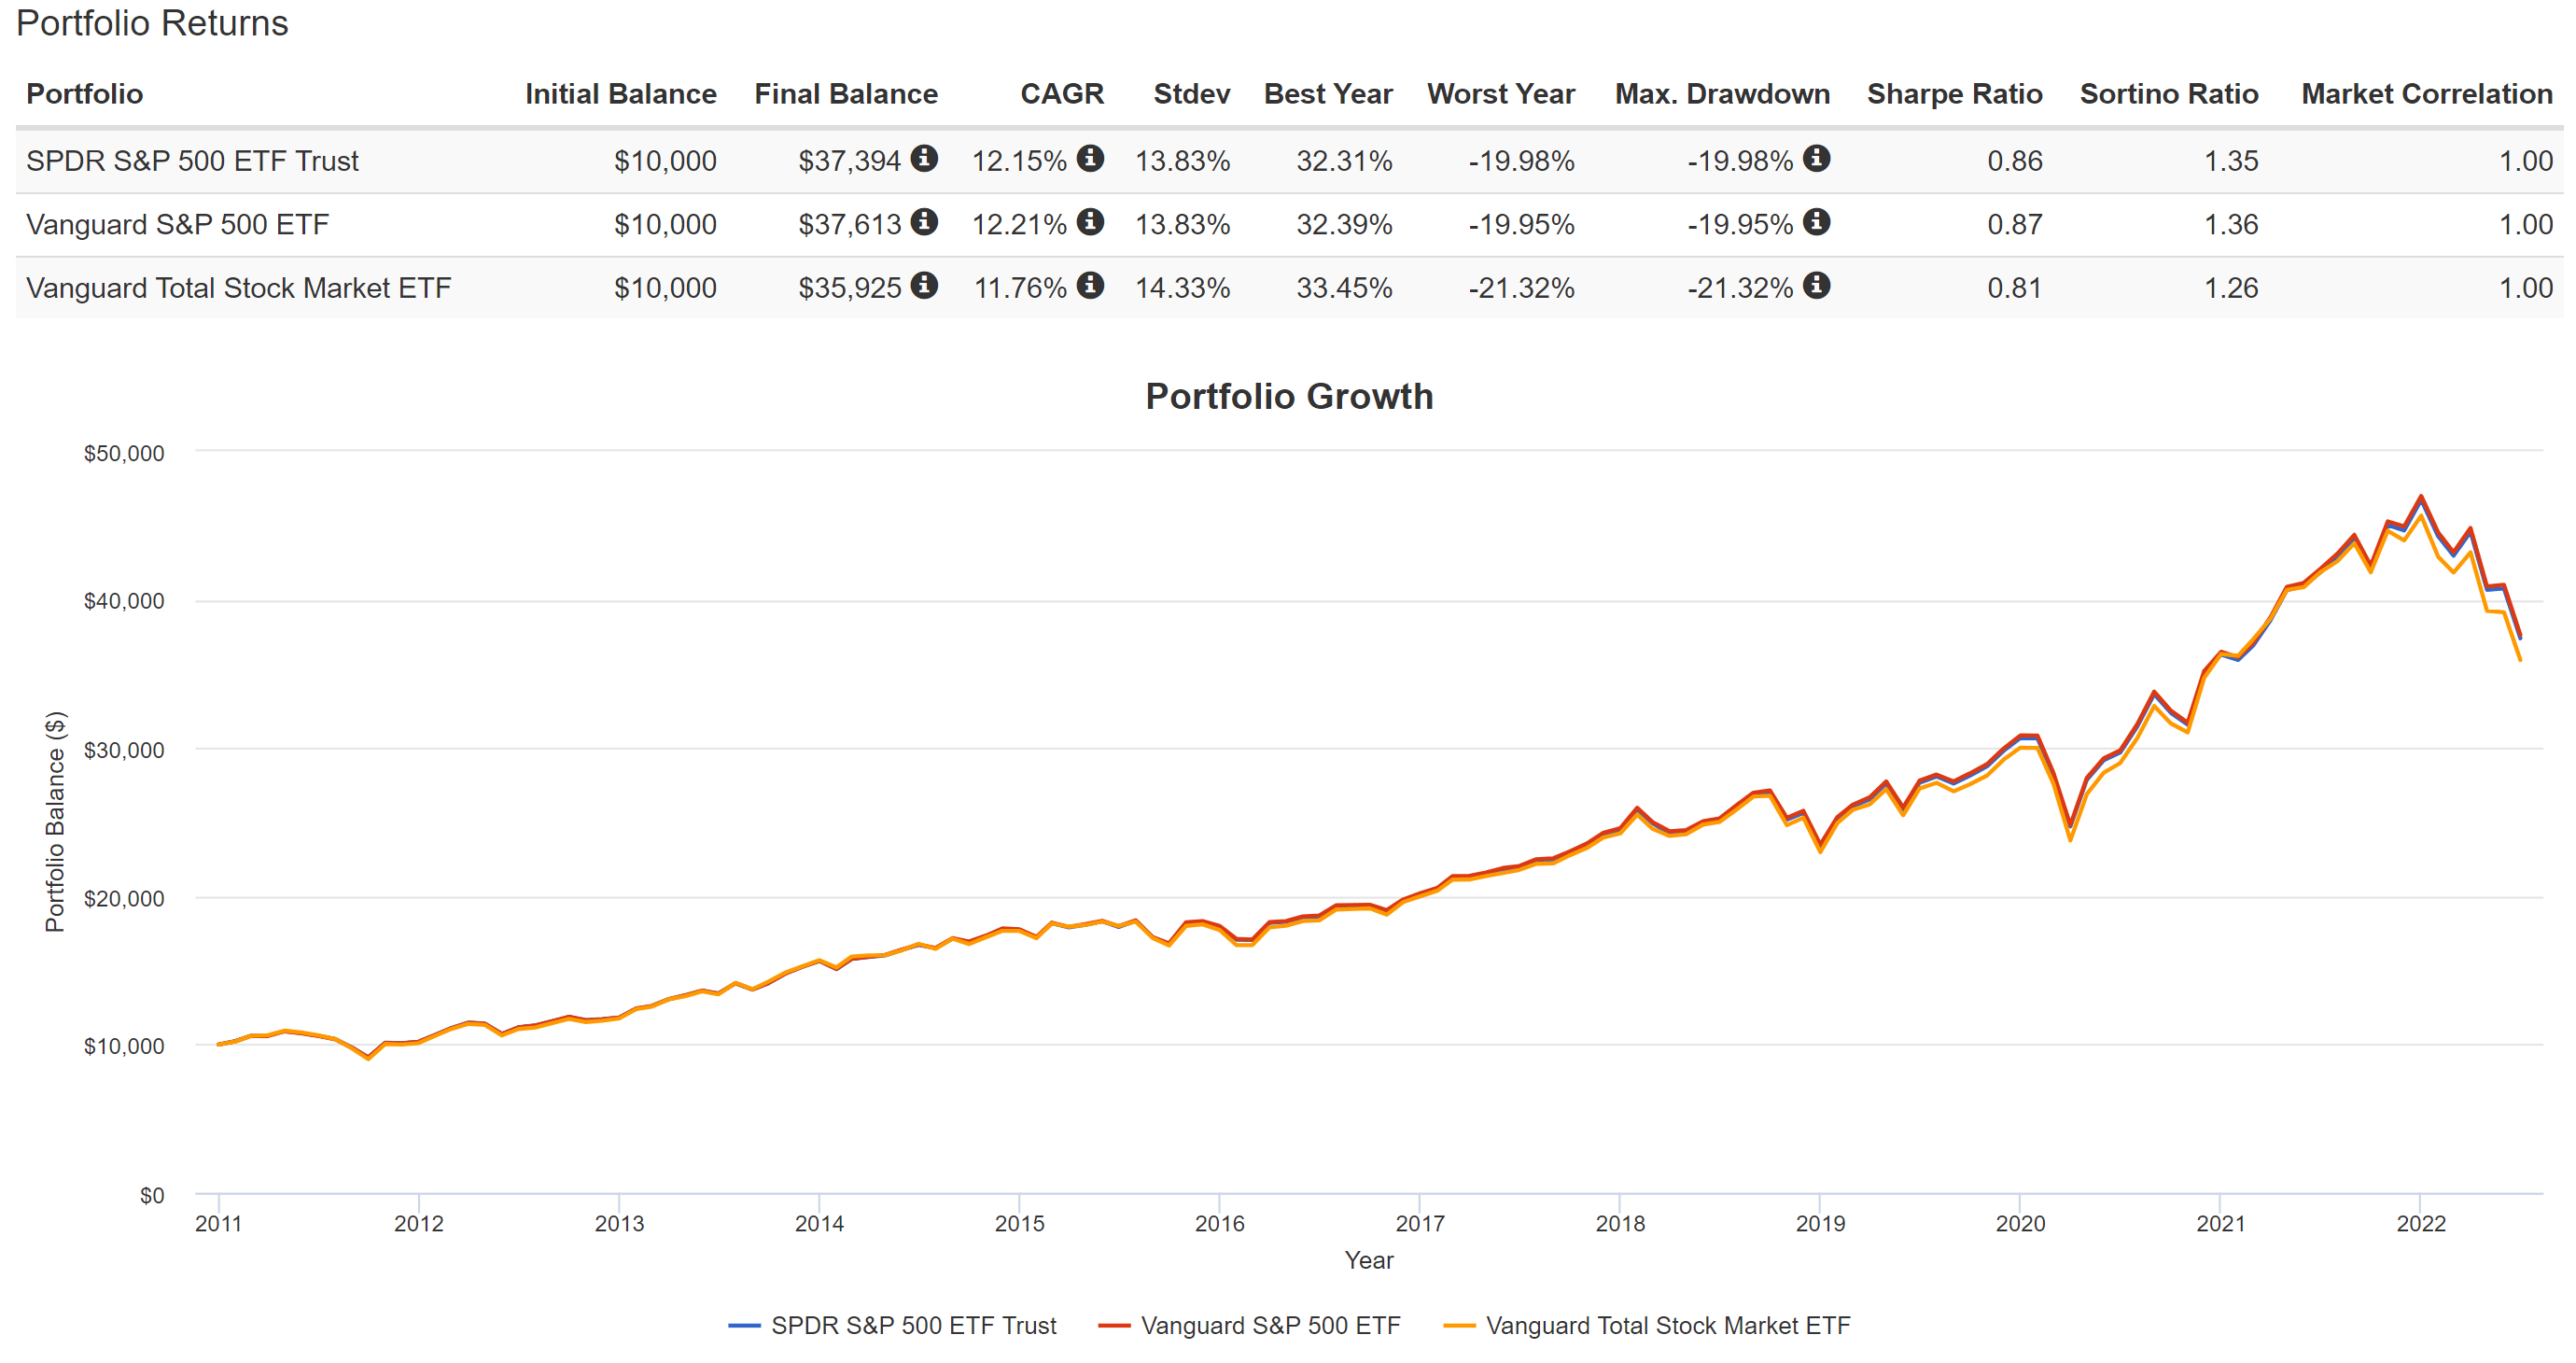
However, from time to time, a relatively large divergence occurs. And now is such a time. As you can see from the following chart, both funds have suffered a large correction this year. More specifically, SPY has lost 24.06% off its peak price this year and VTI has lost 25.12%. As a result, their performance has diverged by more than one percent (1.06% to be precise) off their peak level so far.
Admittedly, a 1.06% divergence doesn’t seem to be a large divergence in absolute terms. However, next, we will see that such a divergence is quite large in relative terms when compared to the historical track record. Then we will discuss the implications of the divergence and offer some actionable ideas.
Source: Seeking Alpha data
VTI vs. SPY: contextualizing the 1% divergence
Both the VTI and SPY funds have delivered healthy – and again nearly identical – returns in the past as you can see from the chart below. As an example, on a 3-year basis, SPY outperformed VTI by 0.43% (7.91% total return vs. 7.48% based on market price). On a 5-year basis, SPY outperformed VTI by 0.71% (11.23% total return vs. 10.52% based on market price). And on a 10-year basis, the gap shrank to 0.34% (12.86% total return vs. 12.52% based on market price).
Based on this context, you can see that the 1.06% divergence this year is quite large. And we will elaborate on its implications immediately below.
Source: Vanguard.com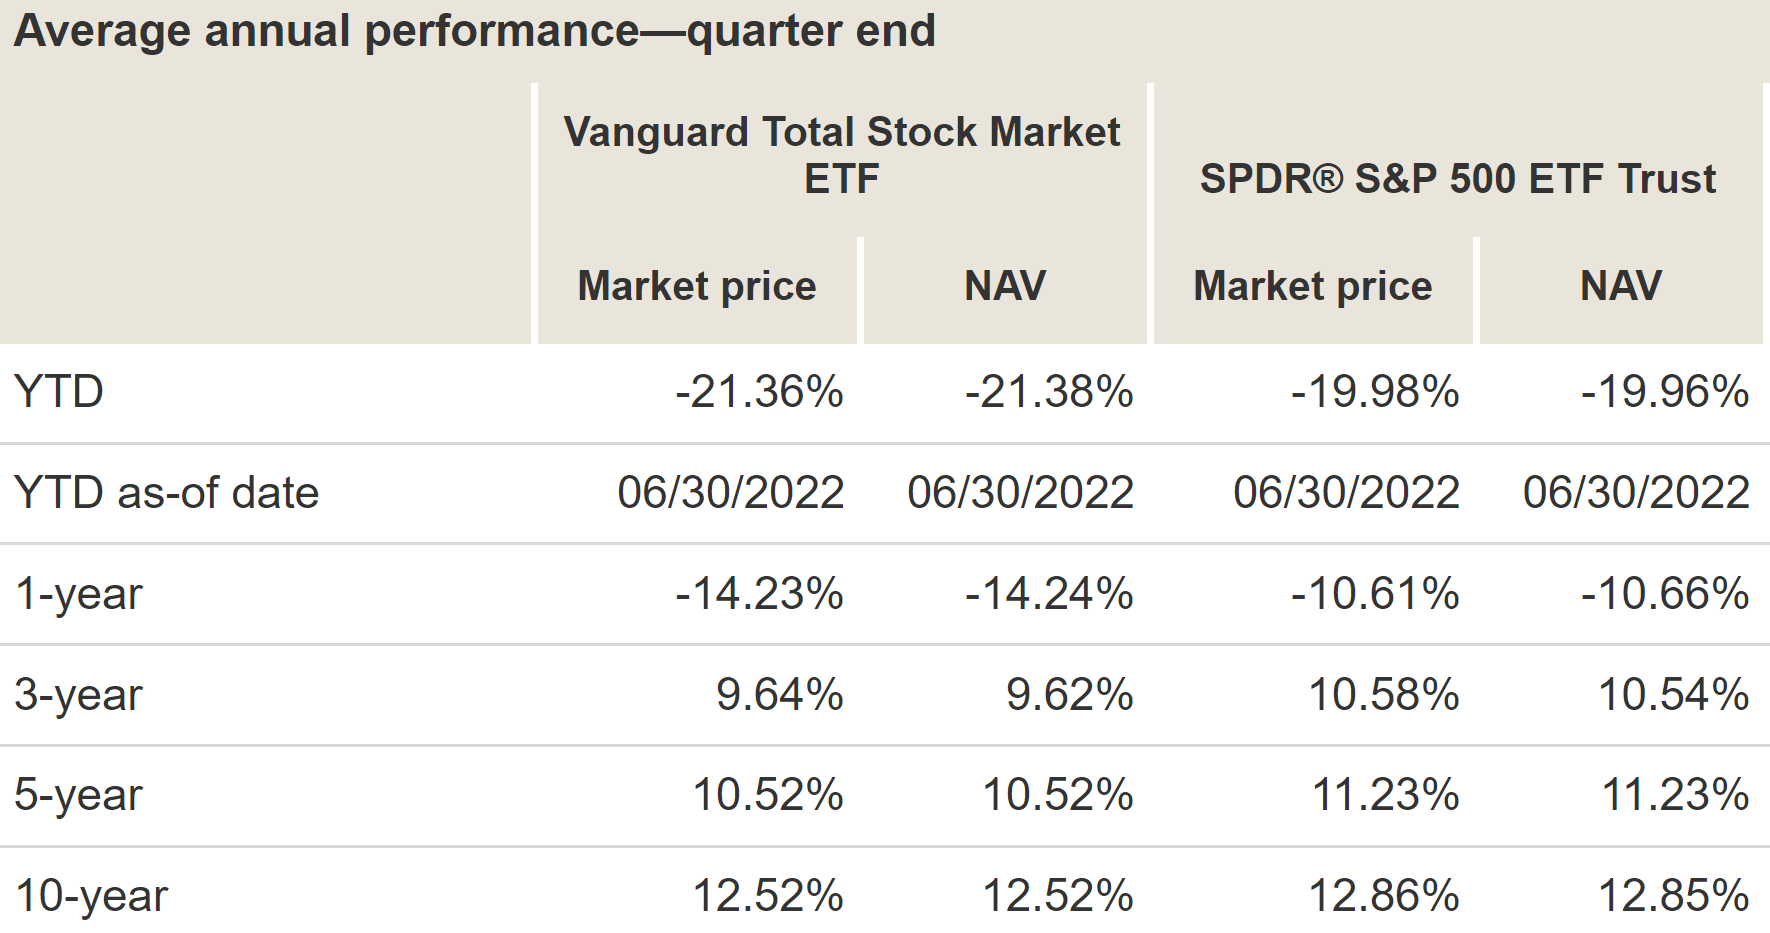
VTI vs. SPY: valuation comparison
The first implication involves the valuation contraction. Simply put, VTI’s valuation is more compressed than SPY because of the divergence. As you can see from the comparison below, the price-to-earnings ratio of VTI is 18.8x, below SPY’s 19.6x by about 4.1%. In terms of price-to-book ratios, VTI’s discount is even larger. VTI P/BV ratio is 3.4x, 8.1% below SPY’s 3.7.
Although, let me clarify that their valuations are inherently different because of the differences in their indexing methods. As a simple example, the median market cap of SPY is larger than VTI ($182.0 billion versus $116.9 billion) as seen. And the valuation contraction that I am referring to here is the contraction beyond their normal differences, as elaborated on next.
Source: Vanguard.com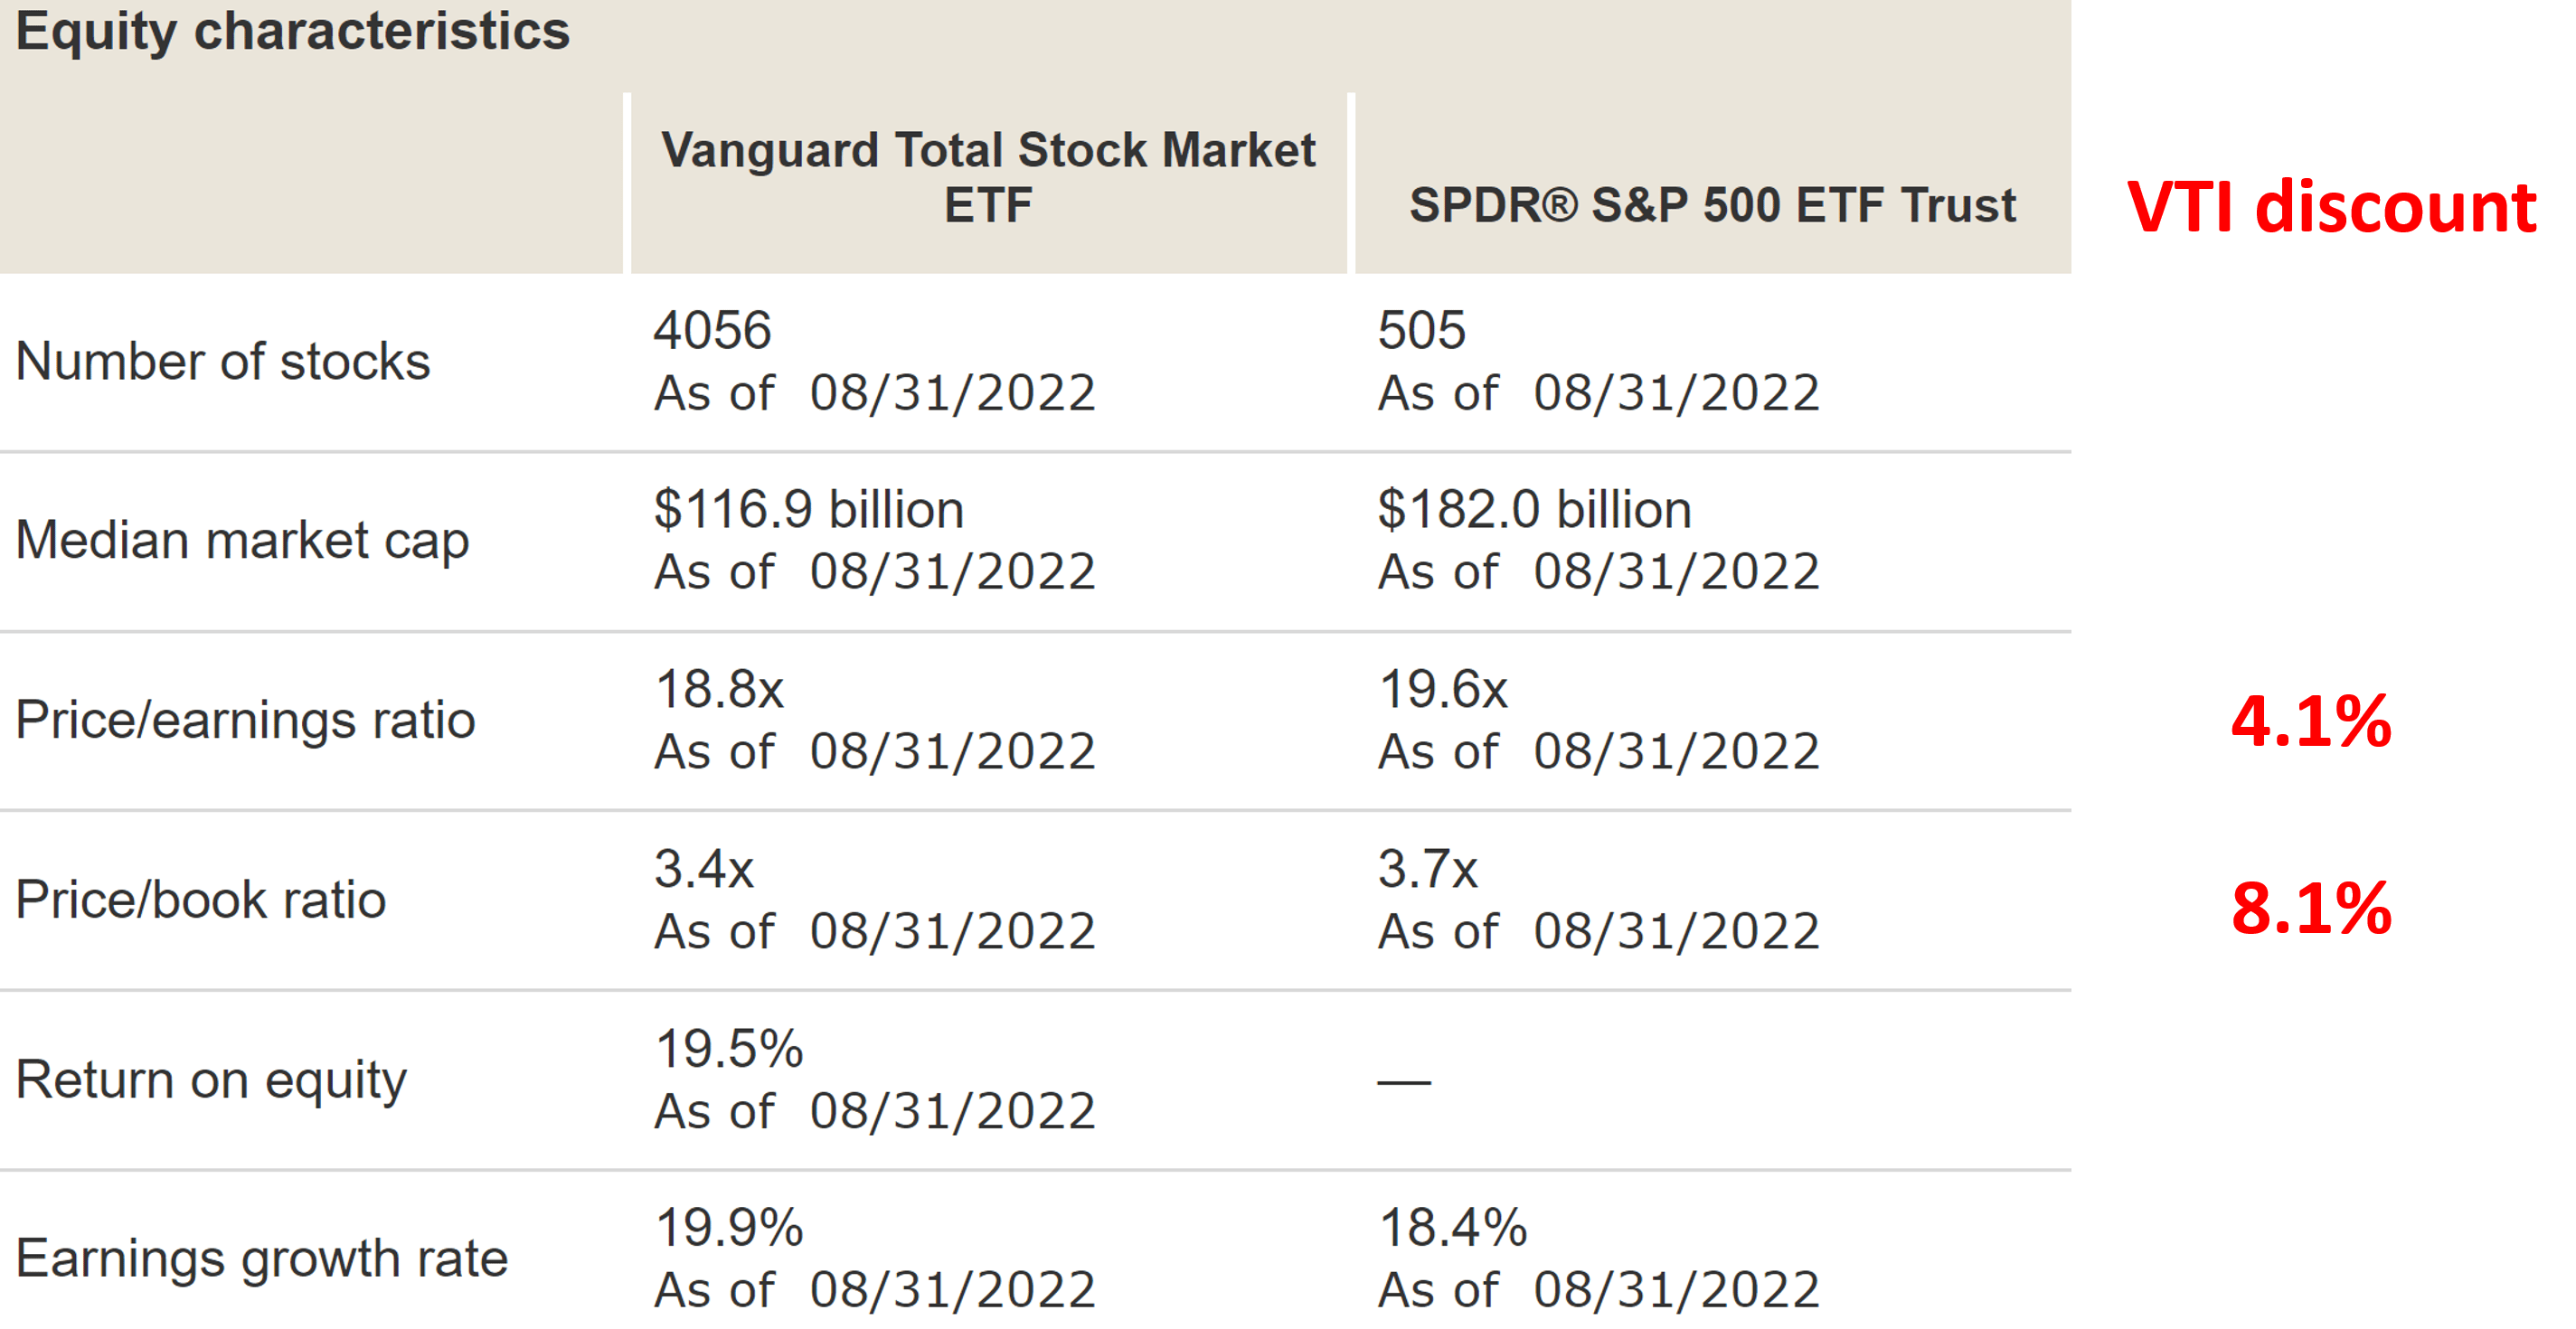
VTI vs. SPY: Yield spread comparison
The best way in my mind to contextualize the valuation contraction is to track the yield spread. Details of these concepts and approaches have been provided in our earlier article. Dividend yields and yield spread are what we first check before making any investment decisions. We’ve fortunately had very good success with this approach because of:
- The common P/E, Price/Book Value ratio, or Price/cash flow multiples provide partial and even misleading information due to the differences between accounting earnings and owners’ earnings.
- Dividends provide a backdoor to quickly estimate the owners’ earnings. Dividends are the most reliable financial information and least open to interpretation.
- The dividend yield spread (“YS”) is based on a timeless intuition. No matter how times change, the risk-free rate serves as the gravity on all asset valuations and consequently, the spread ALWAYS provides a measurement of the risk premium investors are paying relative to risk-free rates.
As can be seen from the next two charts, currently both SPY and VTI’s valuations are being pressured by the surging treasury rates. These charts show the yield spread between SPY and VTI against the 10-year Treasury rates. As seen, the spreads are bounded and tractable. They both started around 0.5%~0.75% right after the 2008 financial crisis, signaling the attractiveness of the equity market. And the spreads oscillated between about positive 1% and negative 2% in the decade that followed. Such tractable YS suggests that when the spread is near or above 1%, the equity market is obviously more attractive relative to the bond market, and vice versa.
And as of this writing, the yield spread for both SPY and VTI is negative 2% as seen, near the lowest level in a decade. The last time this occurred was around 2010 in the aftermath of the 2008 crisis.
Source: Author based on Seeking Alpha data Source: Author based on Seeking Alpha data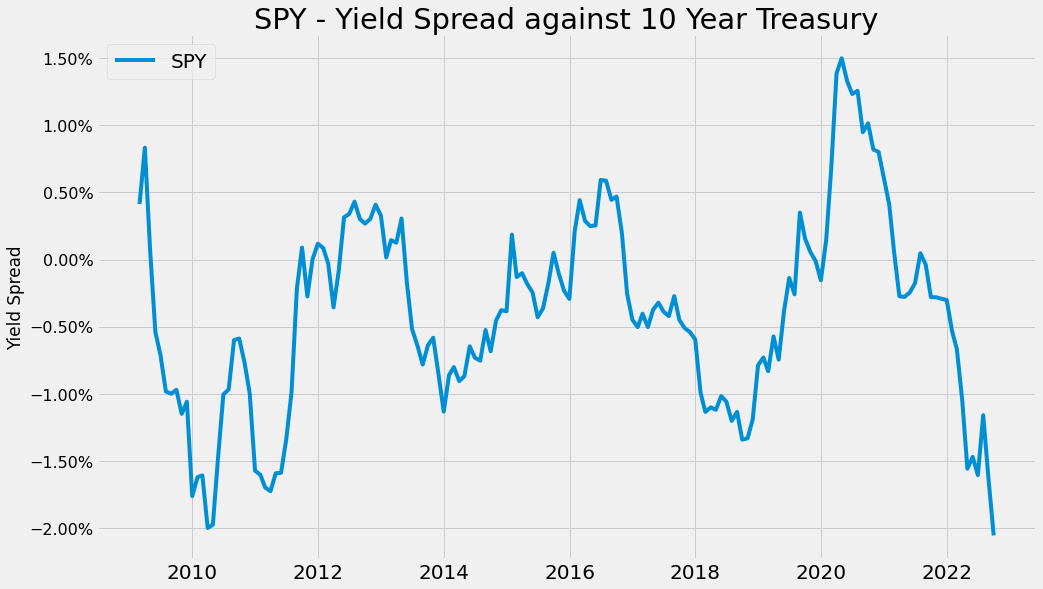

Against this background, the next chart shows the yield spread between VTI and SPY. The above YS against 10-year treasury bonds show their similarities but cannot resolve their differences (as their differences are dwarfed by the changes in the 10-year Treasury rates). So the next chart directly takes the YS between themselves.
As can be seen, the spread is bounded and tractable. Their YS has been in the range between about 0.1% and -0.2% the majority of the time since the 2008 crisis. And the average YS has been about -0.05% since then. Such a tractable YS again suggests that when the YS is above -0.05%, VTI is comparatively undervalued relative to SPY, and vice versa.
As of this writing, the spread is about 0% with VTI yielding 1.71% on a TTM basis and SPY yielding 1.70%. Such a YS is close to the thicker end of the historical range. Actually, it is near the 75% percentile of the historical range.
So to conclude, the recent divergence in VTI and SPY has resulted in a large valuation contraction in VTI relative to SPY. And the contraction is quite large – it is near the 75% percentile of the historical range judging by YS.
Source: Author based on Seeking Alpha data
Risks and final thoughts
Given their market-fund nature, the risks associated either with VTI or SPY are essentially the same macroeconomic risks associated with the economy. And plenty of other SA authors have discussed these risks already. Here, I just wanted to point out the limitations in the use of dividend yield spread itself. As detailed in our earlier article,
Dividend yields do not always reflect business fundamentals due to several factors such as tax law, political climate, the composition of the market index, et al. As a result, we do not directly use the yield spread in our investment or asset allocation decisions. In practice, we first adjust for the above corrections and then use the adjusted yield spread in our investment decision. But the data and approach illustrated here is the first place we check.
To conclude, VTI and SPY offer nearly identical performance and risks most of the time. However, a relatively large divergence occurs sometimes, and now is such a time. Their recent divergence has resulted in a large valuation contraction in VTI relative to SPY. And the contraction is near the 75% percentile of the historical range judging by YS. Although investors need to be aware that the equity market as a whole is under pressure from the risk-free interest rates.
Finally, a few actionable ideas before closing. Under current conditions, we prefer VTI and actually hold VTI ourselves for the reasons mentioned above. To hedge the pressure from risk-free interest rates, we use a barbell strategy. As detailed in our recent article, the strategy involves A) setting aside enough cash and intermediate bonds in the conservative end of the barbell, and B) pursuing growth in the aggressive end of the barbell via a combination of equity funds like VTI and growth stocks. For even more aggressive investors, now is also a good time to consider the mid-cap and small-cap sectors. The valuation divergence between VTI and SPY is of course caused by VTI’s exposure to the mid- and small-cap sectors, although VTI is dominated by large caps (about 80% of its assets are in the S&P 500 stocks). More risk-prone investors with a long time horizon may consider a more concentrated bet on mid- and small-caps. As seen in the charts below, mid-cap is currently valued at 11.2x FW P/E. It is a whopping 28% discount compared to the large caps. Furthermore, it is only 10% above its bottom valuation around 10.5x amid the COVID crash. Now moving on to the third chart for small caps. Mid-caps are currently valued at 11.4x FW P/E and small-caps only 10.7x. These valuation levels are among the lowest in more than 2 decades. They are essentially at the bottom level during the COVID crash and are approaching the bottom level in the 2008 crisis.
Source: https://www.yardeni.com/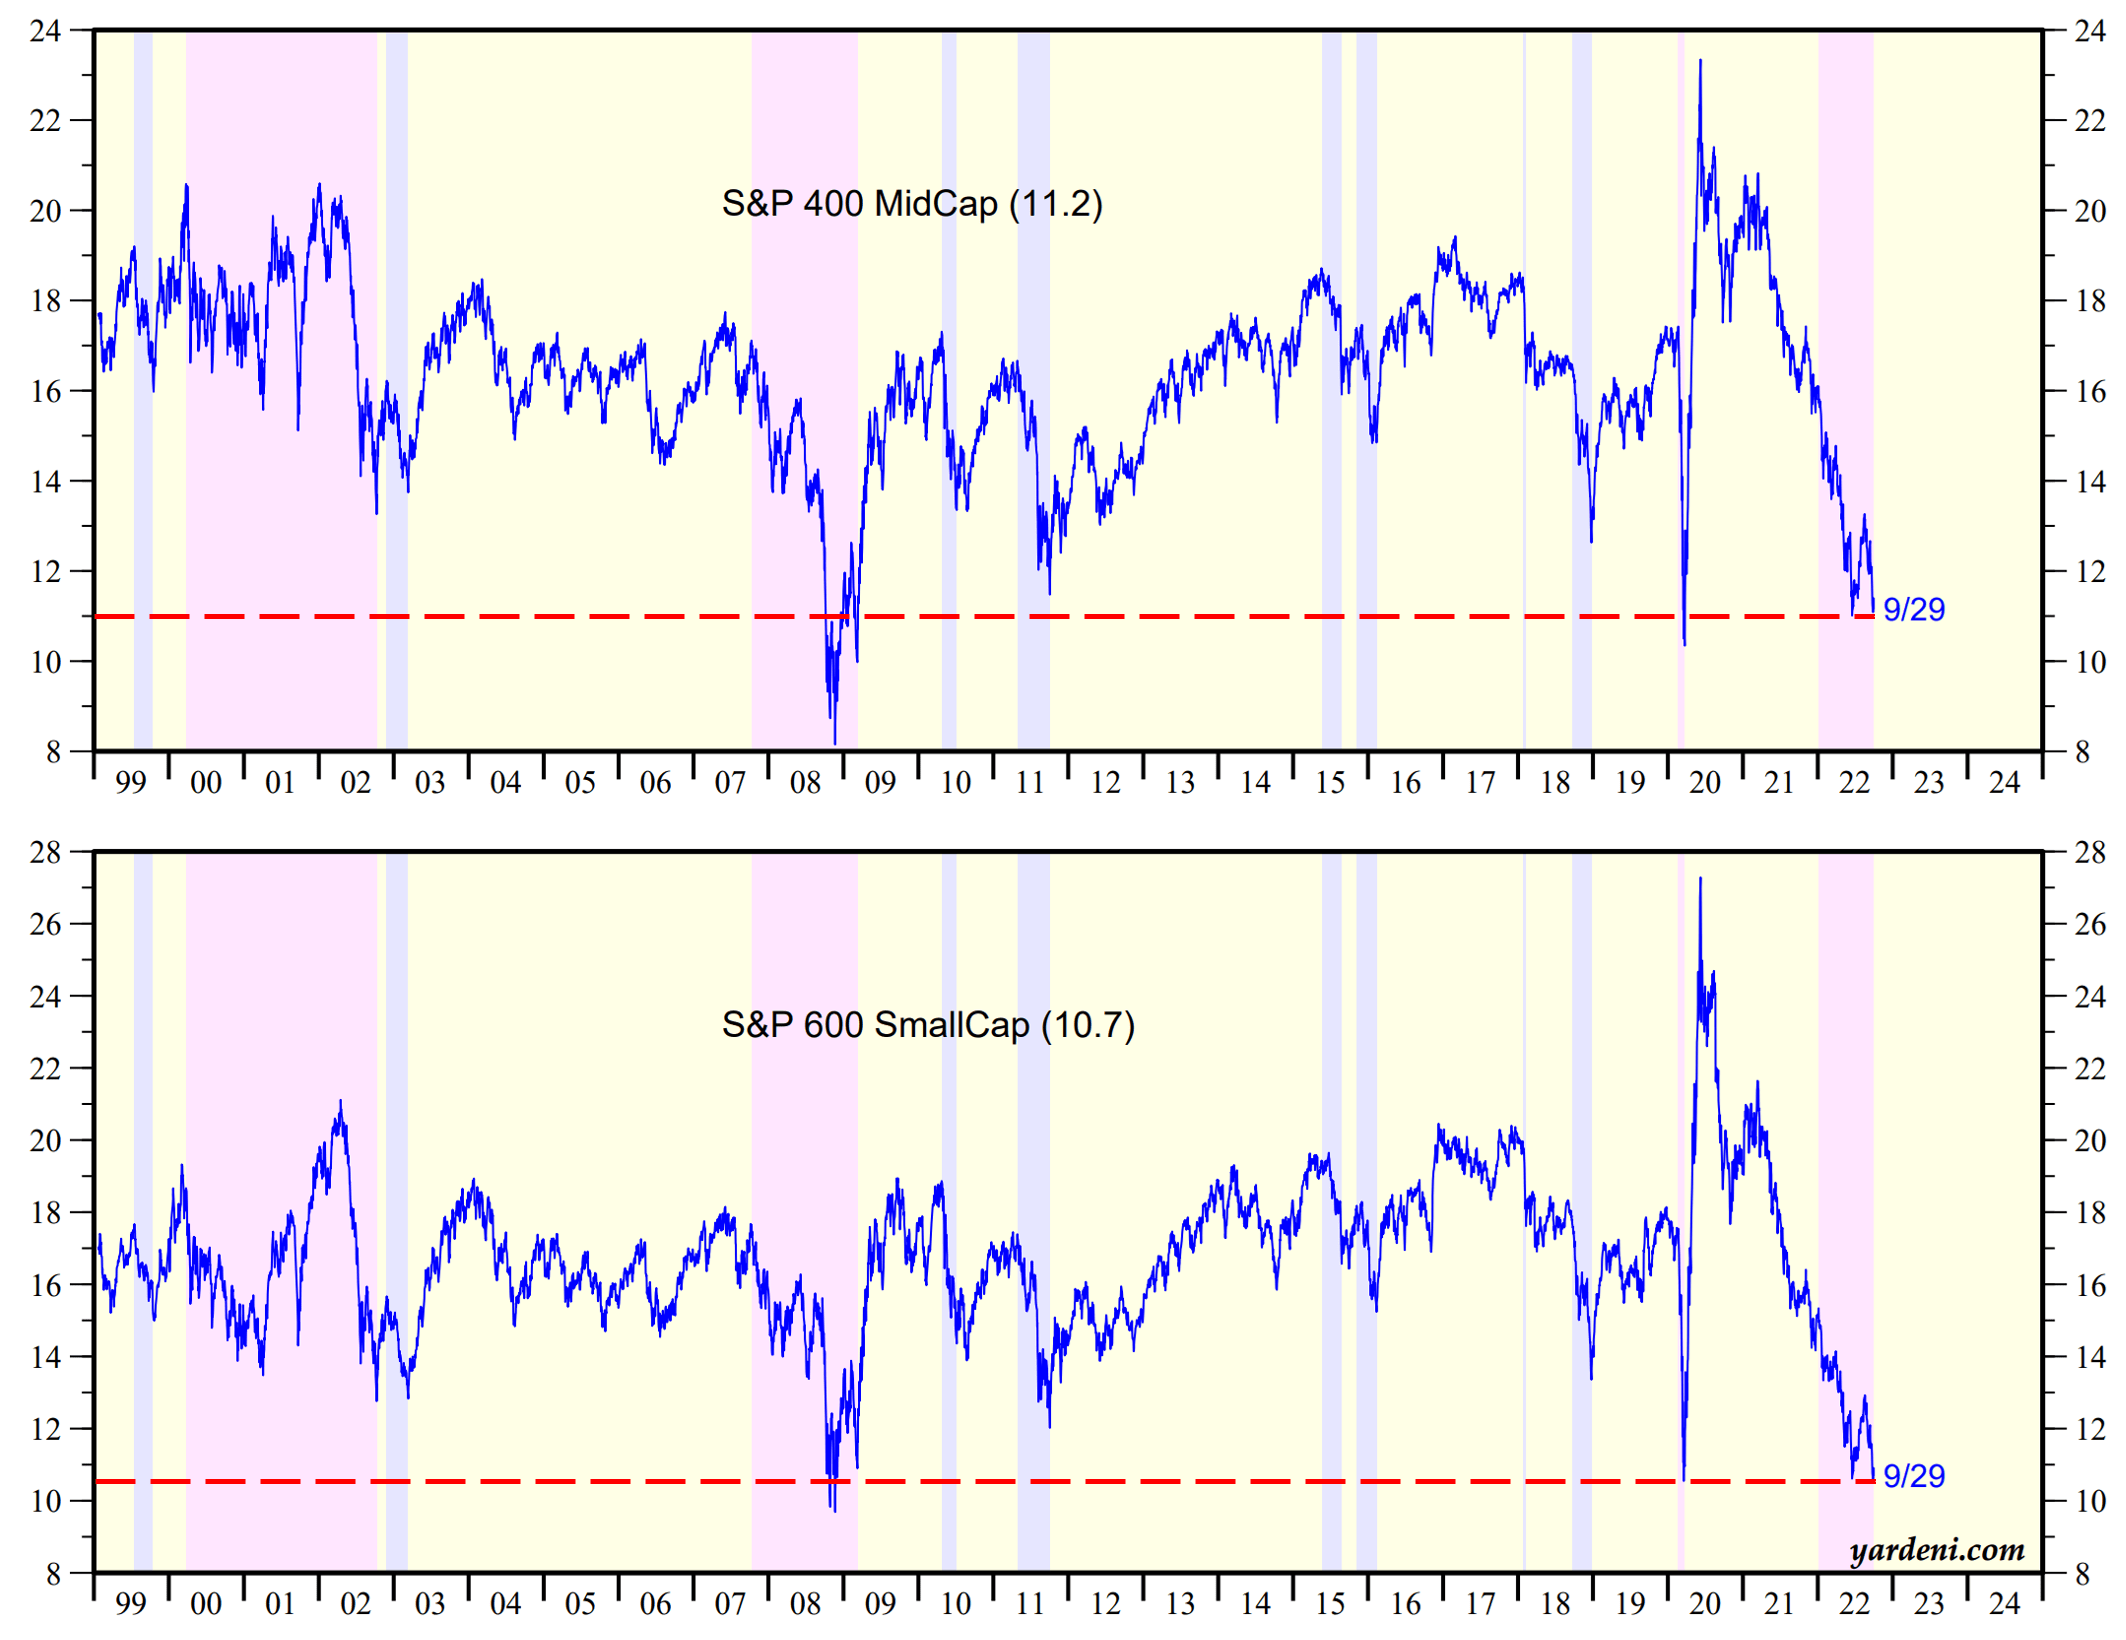
Be the first to comment