

bymuratdeniz
A guest post by D Coyne
The US EIA Short Term Energy Outlook (STEO) was published on January 10, 2023. This report generally provides forecasts for Total Liquids production for non-OPEC nations, crude only output for OPEC nations, and both C+C and Total Liquids forecasts for the US. At Peak Oil Barrel, we focus on crude plus condensate (C+C) output as this is the critical input that provides most of the World’s liquid fuels used for land, air and water transportation. The STEO also provides forecasts for natural gas and electricity output as well as price forecasts for oil, natural gas, and electricity. This post will focus on oil (both total liquids and C+C).
We find the OLS trend in the ratio of C+C divided by total liquids for non-OPEC minus the US over the period from October 2014 to September 2022 (it has been decreasing at an annual rate of 0.267% over that period) and we assume the trend continues from October 2022 to December 2024 (the end of the STEO forecast). This allows us to estimate non-OPEC minus US C+C. Likewise, we find the ratio of OPEC crude to C+C which was relatively flat at about 93.7% from Jan 2010 to December 2019 and seems to be returning to this level since the depths of the pandemic. By assuming the ratio is 93.7% crude to C+C for OPEC, we can estimate OPEC C+C from October 2022 to December 2022 using the STEO crude only estimate. The non-OPEC minus US C+C estimate is added to the STEO US C+C estimate and this is combined with the OPEC C+C estimate to find the World C+C STEO forecast.
Figure 1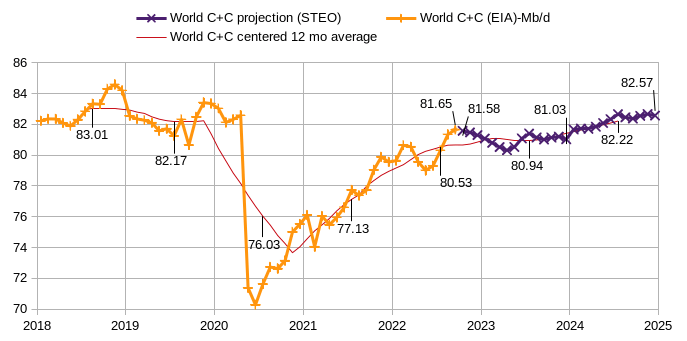
The numbers below the red line are mid-year 12-month averages for World C+C (the exception is in 2018 where the centered 12-month average peak of August 2018 is shown). The numbers above the line are for individual monthly average output in Sept 2022, October 2022, December 2023, and December 2024. Output is in millions of barrels per day (Mb/d).
Figure 2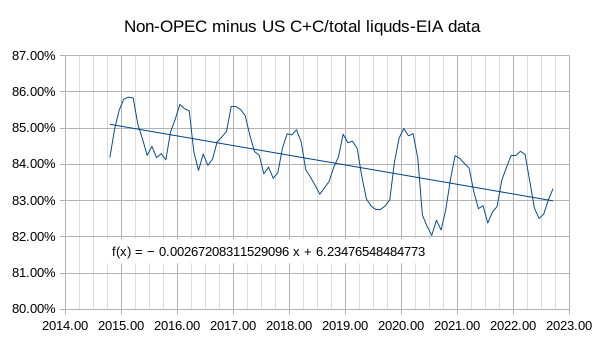
Figure 2 shows the ratio of non-OPEC minus US C+C to total liquids as a percentage. The roughly sinusoidal up and down is due to changing ethanol output in Brazil from winter to summer. I have not attempted to fit the sinusoid, so 12-month averages might be fairly close but summers might be overestimated and winters may be underestimated due to missing this seasonal effect. In the future, I may estimate Brazil separately, to get a better estimate for non-OPEC minus US and Brazil, but have not done that this month. I use the equation on figure 2 above to project the future non-OPEC minus US C+C to total liquids ratio from October 2022 to December 2024 and then multiply this ratio by the total liquids forecast to find a C+C STEO forecast for non-OPEC minus US.
Figure 3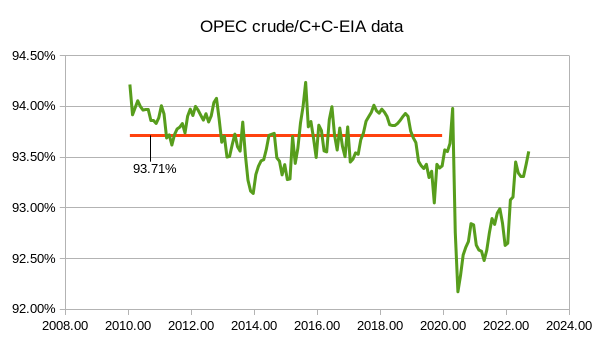
The chart above shows the trend of the OPEC crude to C+C ratio as a percentage. Note that the trend of the Jan 2022 to Sept 2022 data suggests that this ratio will return to 93.7% by November 2022. To simplify, I used a ratio of 93.7% for all months from October 2022 to December 2024. The crude estimate for OPEC was divided by 0.937 to find an OPEC C+C STEO forecast. The non-OPEC minus US C+C forecast was combined with the STEO US C+C forecast and the OPEC C+C STEO forecast to find the World C+C forecast shown in figure 1. The data is in a spreadsheet at this link , the filesize is 5.8 MB.
Figure 4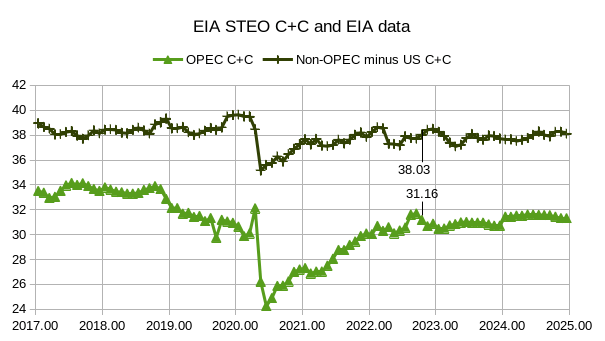
The chart above shows the Non-OPEC minus C+C STEO forecast and the OPEC C+C STEO forecast, the first data point of each forecast is shown on the chart, data to the left of that is from the EIA’s international petroleum data and data to the right is the STEO forecast.
There are 23 non-OPEC nations (aside from the US) that the US EIA provides individual forecasts for total liquids output in the STEO. Two of the 23 nations have a combined forecast (Sudan and South Sudan), so there are 22 separate forecasts which cover about 94% of non-OPEC C+C output as of September 2022. A trend analysis for each of the 22 forecasts was too much work. Instead, I did a shortcut method by taking total C+C output from October 2018 to September 2022 and dividing by total liquids output over the same period to find a weighted C+C to total liquids ratio for the past 4 years. I assumed this would correspond to the ratio from October 2022 to December 2024 (no doubt this will not be accurate as the future is not known; likewise, any past trend is not likely to continue). The methodology outlined above is used for the STEO forecasts of C+C output that follow. As was done earlier, the first point of the forecast is shown on the chart (October 2022 in every case), data prior to October 2022 is from the International data section of the EIA.
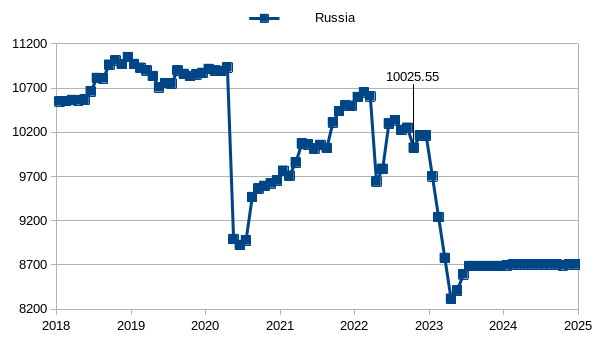
I doubt Russian C+C output will fall as much as the EIA has forecast. I expect it will settle at around 9400 kb/d, about 700 kb/d higher than the EIA STEO forecast.
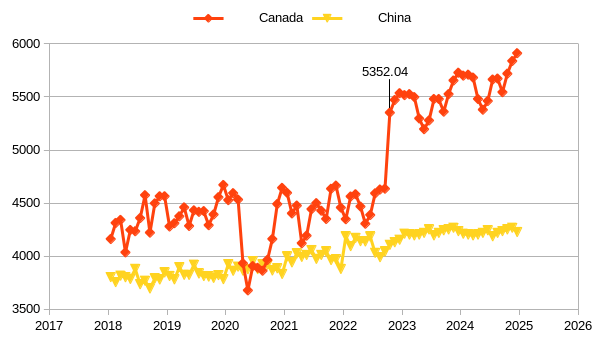
The Canadian forecast looks much too high; I expect actual output will be shifted down by about 700 kb/d from October 2022 to December 2024. The mistake on the low Russian forecast and high Canadian forecast may roughly balance out from June 2023 to December 2024, but from October 2022 to March 2023, the EIA forecast may be too high due to the unreasonable jump up in Canadian output in October 2022.
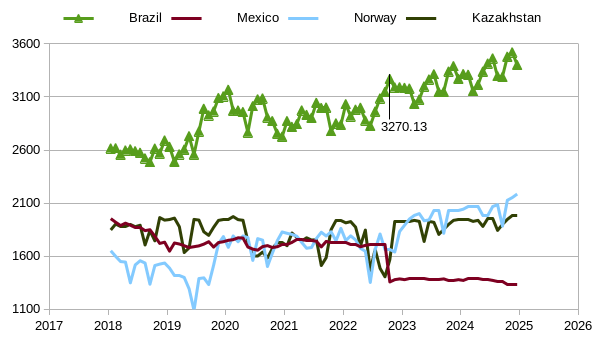
The Brazilian forecast was done a bit differently than the rest of the 22 forecasts. I looked at Brazil non-C+C liquids from 2015 to 2022 and saw a pretty flat sinusoidal up and down pattern (by “flat” I mean no trend in the 12-month average, slope of trend is nearly zero), so I took the most recent Jan to December non-C+C liquids data and simply subtracted that from the total liquids forecast for Brazil to get the Brazil C+C STEO forecast.
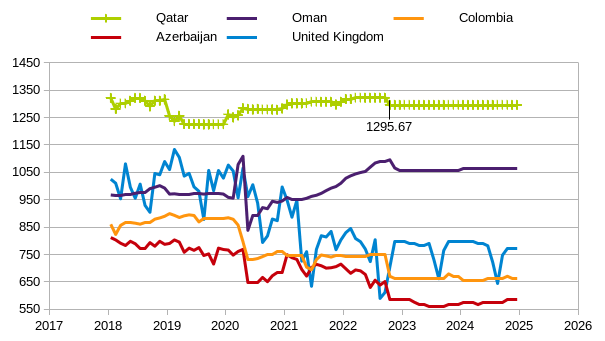
Most of these 5 nations have relatively flat output for the forecast period, with a slight downward trend for the UK.
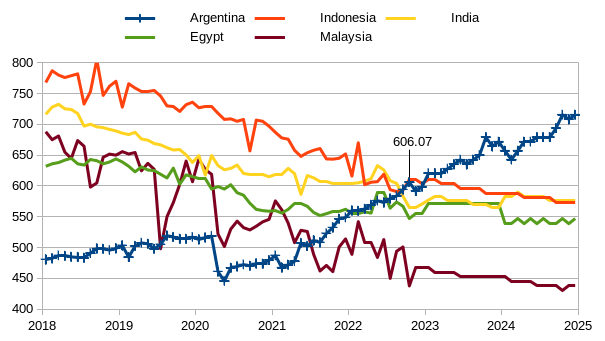
Egypt and India fairly flat over the forecast period with Indonesia and Malaysia trending down and possibly offset by the upward trend in Argentina’s output.
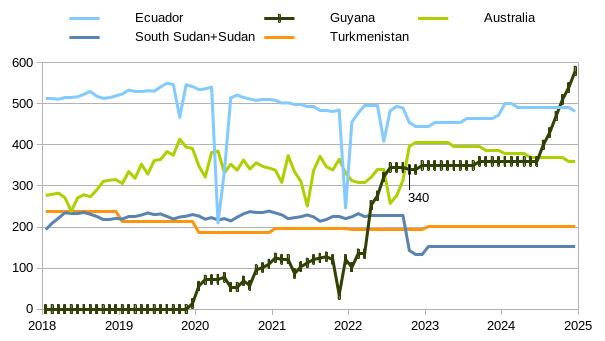
These 5 nations taken together are mostly flat over the October 2022 to June 2024 period, but output is sharply up in Guyana in the second half of 2024.
Figure 5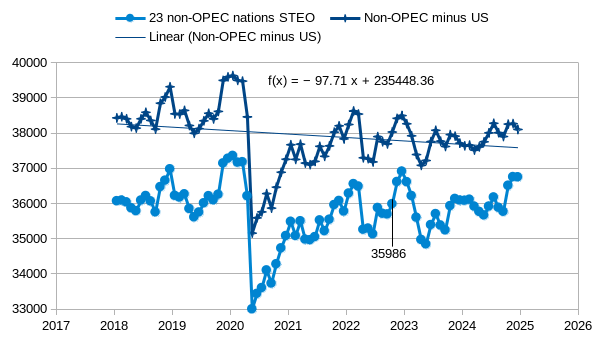
The chart above compares the Non-OPEC minus US C+C STEO forecast with the sum of the forecasts of the 23 non-OPEC nations covered in the previous 6 charts. I also show the OLS trend for the non-OPEC minus US C+C for Jan 2018 to December 2024 (a combination of data and forecast); annual decline rate is 98 kb/d.
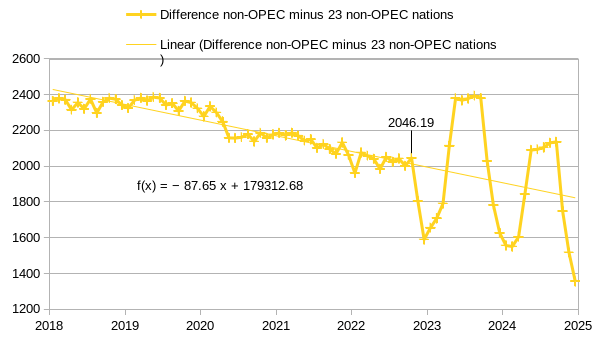
Figure 6
The chart above takes the difference between the two lines in figure 5. We get a strange quasi-sinusoidal pattern over the forecast period when there is no such pattern in the actual data. So for an alternative method (I call this Method 2) for the non-OPEC minus US C+C forecast, I assume all the 22 forecasts for C+C which I produced in the charts above are correct and use the OLS trendline shown in Figure 6 to estimate the rest of non-OPEC minus US C+C output and then combine this forecast with the 23 nation forecast.
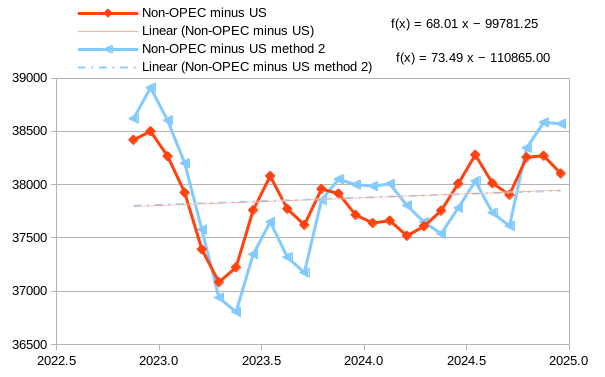
Figure 7
The “method 2” forecast is compared with the original non-OPEC minus US C+C STEO forecast in the chart above, the OLS trendlines are shown for each of the forecasts (one is a dash dot pattern in light blue, the other is a continuous line in light red). Look closely because there are two lines, but they are so similar that it appears to be a single line. Neither will be correct; the future cannot be predicted with this level of detail (or at all).
Be the first to comment