


Feverpitched/iStock via Getty Images
Housing is one of the primary drivers of the economy, feeding through into areas like labor, raw materials and durable goods expenditure. There is also strong evidence that the business cycle is predominantly a housing market cycle. The housing market is one of the sectors of the economy that is most prone to bubbles because rising home prices can increase demand rather than temper it. The US housing market has been red-hot over the past 12 months, although it appears to be losing momentum as monetary policy tightens. How the housing market and consumer spending on durable goods evolve going forward will be an important determinant of whether there is a recession in the near future.
Aside from the recent rapid increase in house prices, one of the clearest signs that there is a housing bubble is the number of housing starts. Relative to population growth, changes in average household size and depreciation of the existing housing stock, housing starts are near record levels. This is concerning, as when starts have reached this level in the past there has been a subsequent collapse in activity, with a large negative impact on GDP.
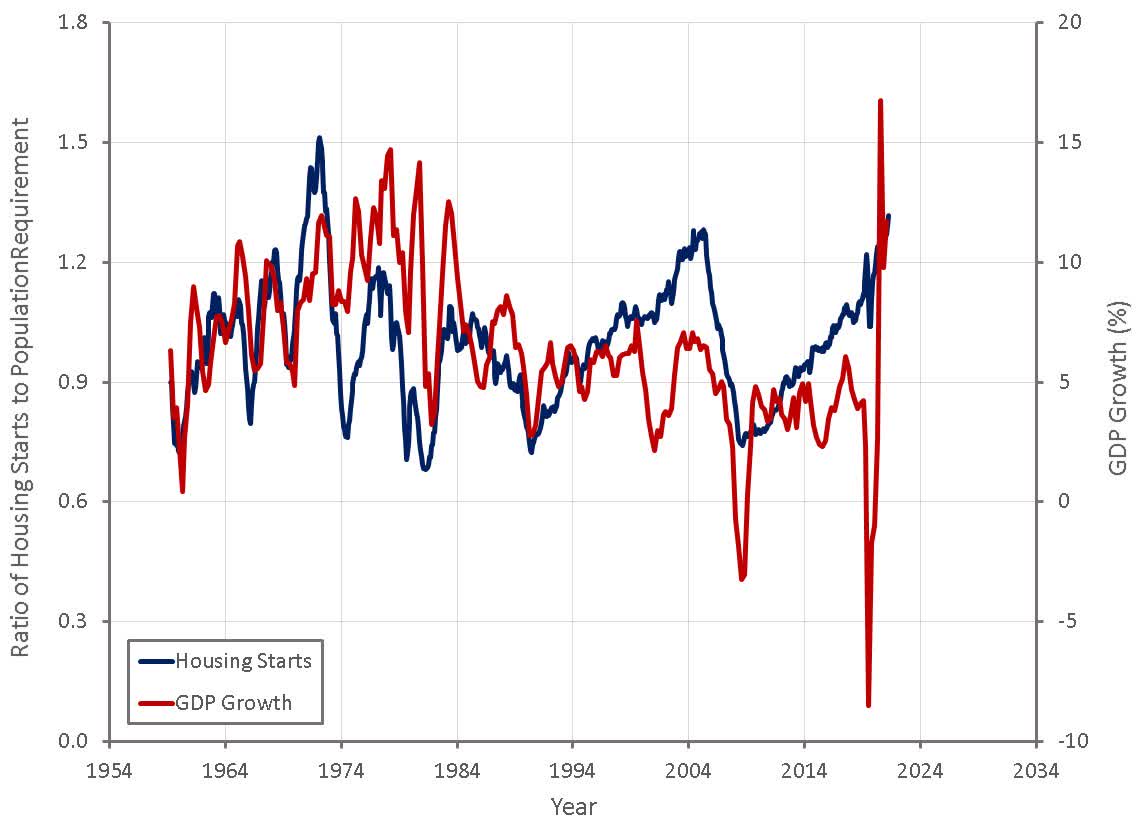
Figure 1: US Housing Starts Relative to Population Requirement (source: Created by author using data from The Federal Reserve)
While there is a clear oversupply occurring, the impact of this on prices is difficult to ascertain in the short-term. Real estate buying and selling is driven by investors as well as people buying homes for their own use. As a result, prices can exhibit momentum and become detached from fundamentals.
Price discovery on the downside also tends to be poor, as people are reluctant to sell a house for a loss. Due to this, volume tends to decrease rather than prices and the decrease in volume tends to be exaggerated. It may be more reasonable to expect housing market activity to dry up for an extended period as supply is absorbed, rather than expecting prices to collapse.
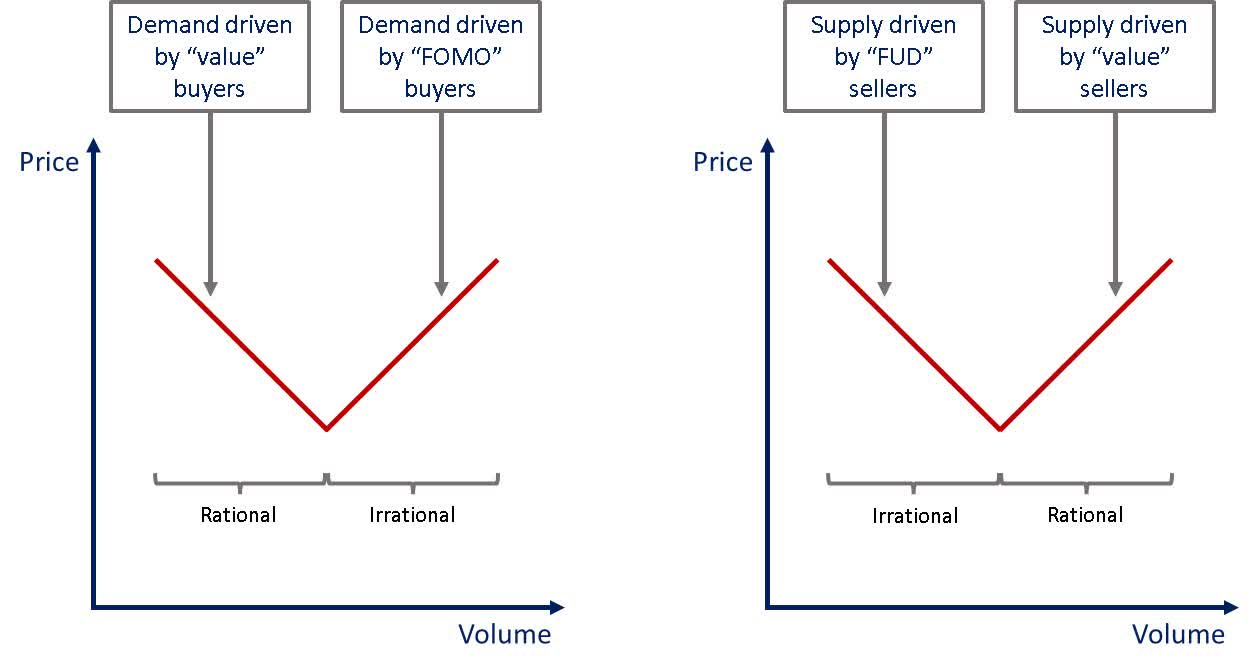
Figure 2: Supply and Demand for Housing (source: Created by author)
Demand for second homes was up 87% from pre-pandemic levels in January 2022 and has been another factor behind recent price increases. Demand for second homes appears to be normalizing as the pandemic ends, which will reduce pressure on prices.
While real estate markets generally look quite tight, due to low inventory levels and a lack of price cuts to encourage sales, there is mounting evidence that the market has already peaked. House prices are beginning to stagnate and the volume of sales is beginning to collapse.
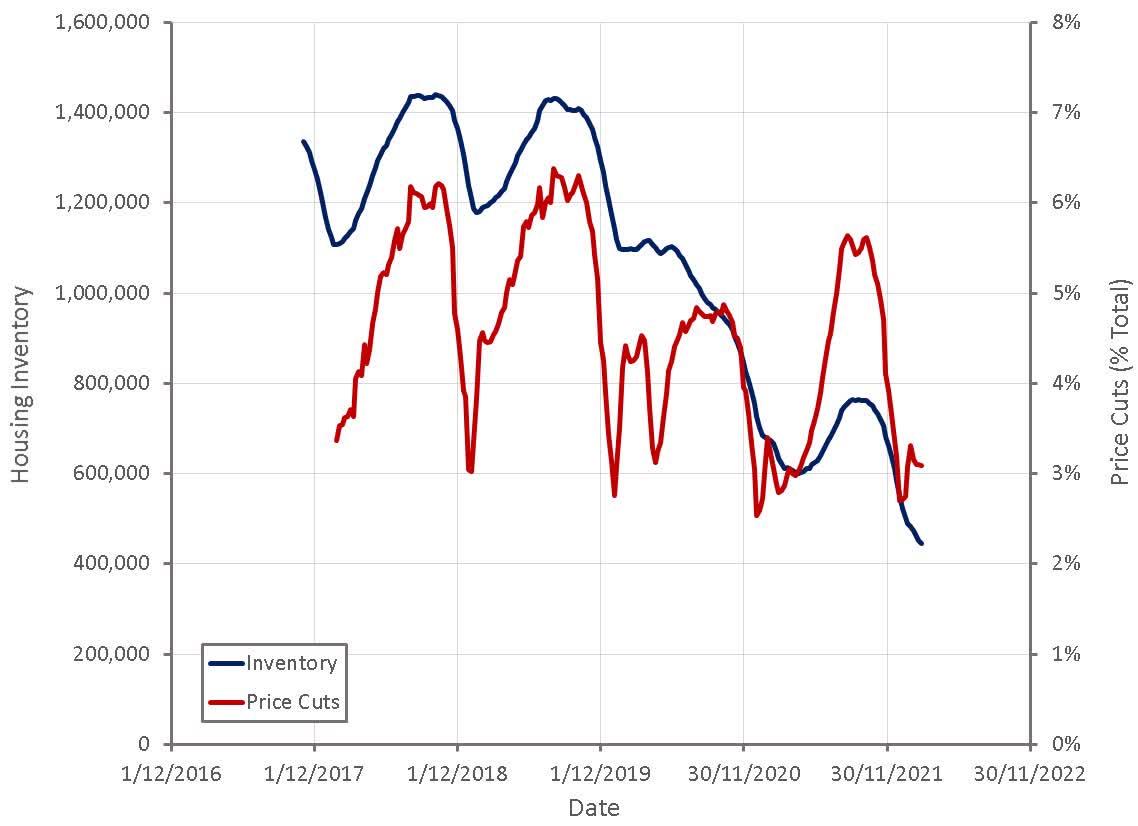
Figure 3: Zillow Housing Inventory and Price Cut Data (source: Created by author using data from Zillow)
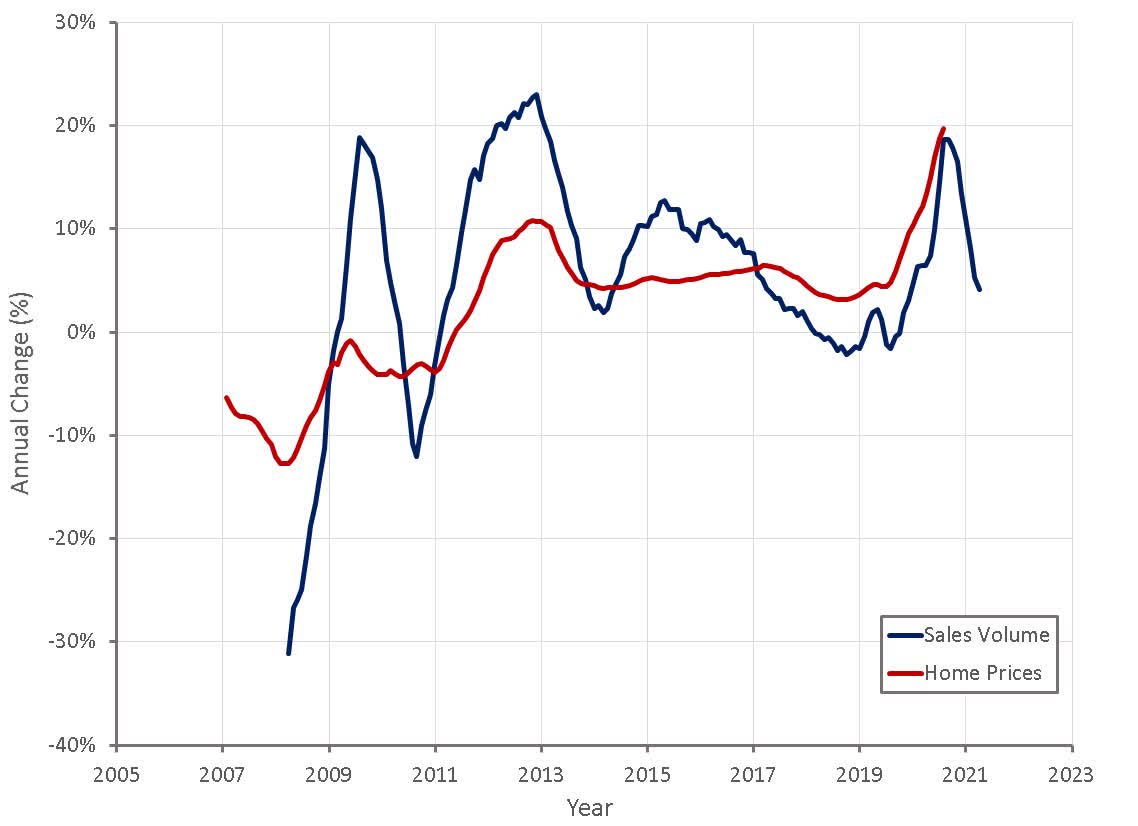
Figure 4: Zillow Sales Volume Data (source: Created by author using data from Zillow)
From a fundamental perspective, US home prices are high relative to disposable incomes. This could point towards either an extended period of price stagnation or a decrease in prices. It should be noted that this is relative though and countries like Australia, Canada and Hong Kong have maintained higher relative prices for extended periods.
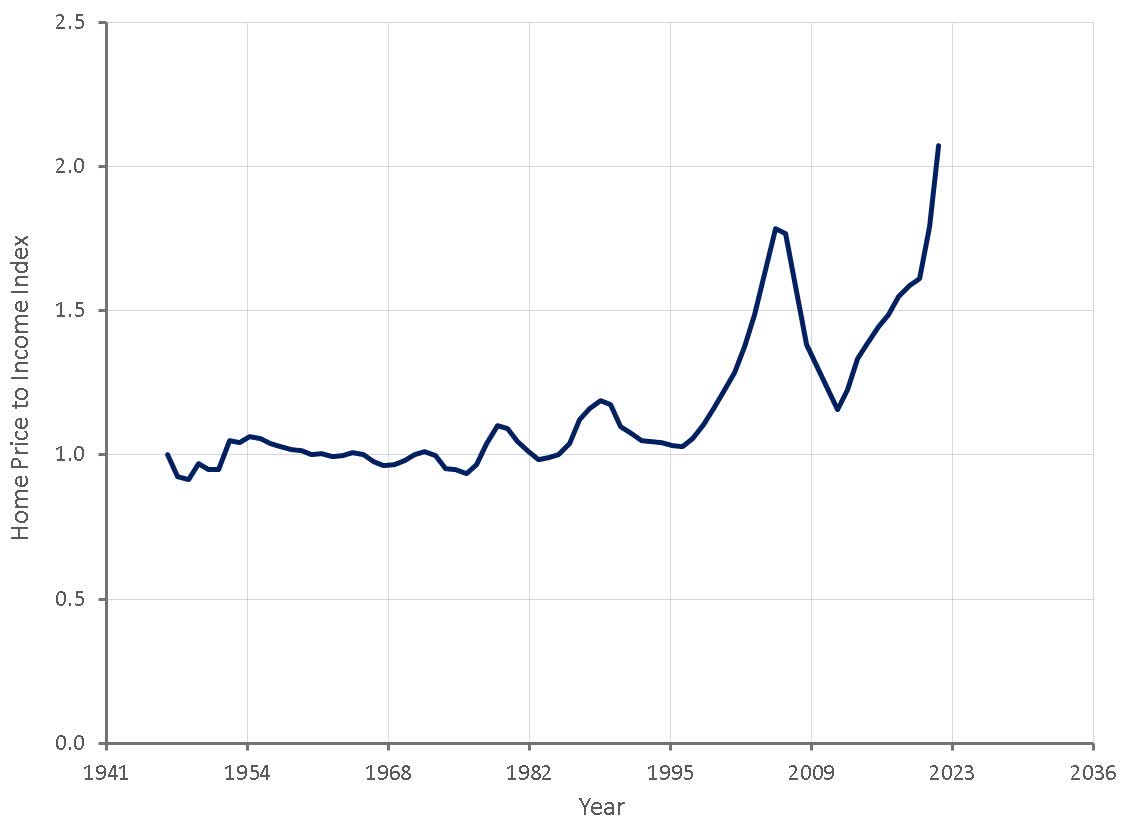
Figure 5: Index of Home Prices to Disposable Income (source: Created by author using data from The Federal Reserve)
Housing purchases are generally highly levered, making consumer debt levels and interest rates important drivers of real estate prices. Household debt to GDP levels in the US are approximately 40% lower than in Australia. Household debt to disposable income in the US is also approximately 25% lower than it was at the peak of the 2007 housing bubble. This indicates that US households could maintain higher debt levels.
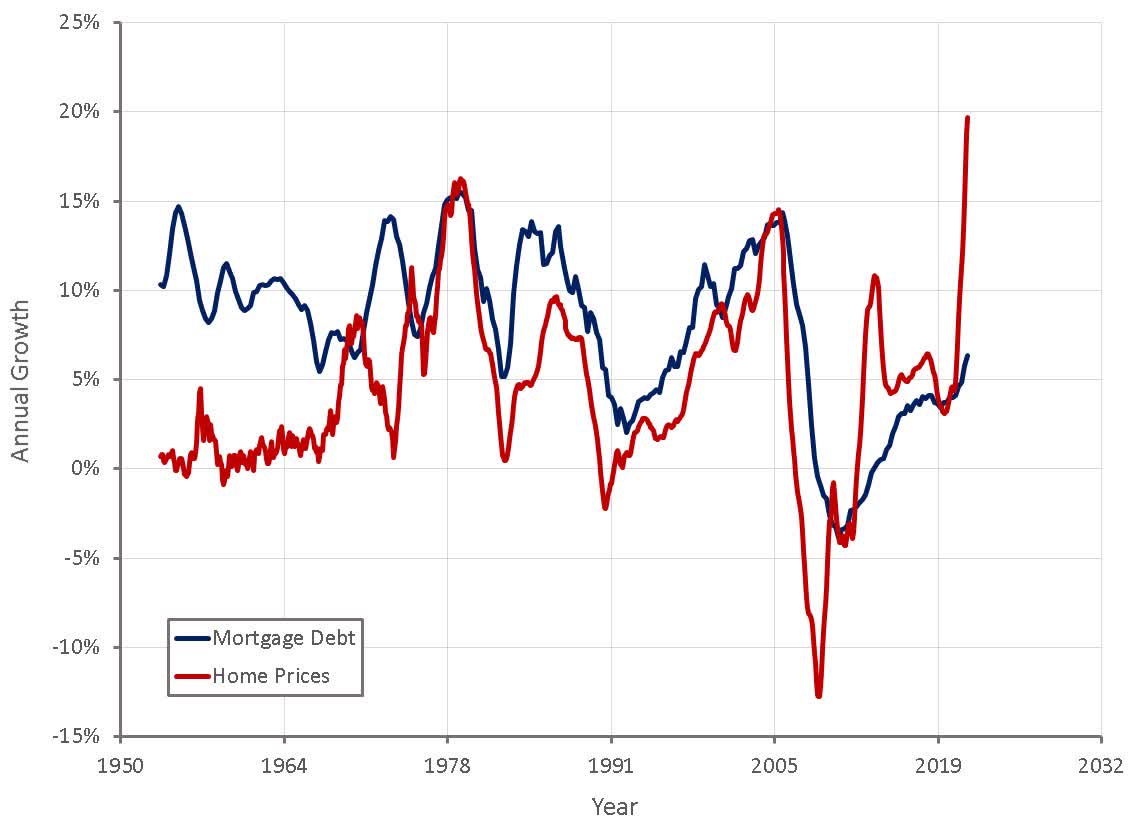
Figure 6: US Mortgage Debt Growth (source: Created by author using data from The Federal Reserve)
Household debt service payments as a percent of disposable income are also currently relatively low. If interest rates continue to rise, this situation will change somewhat, but there is no indication of stress at the moment. The vast majority of Americans have fixed rate mortgages, meaning that a rise in rates is unlikely to induce a substantial amount of financial stress. It would mean that buyers looking to enter the market for the first time will be priced out unless prices decline though.
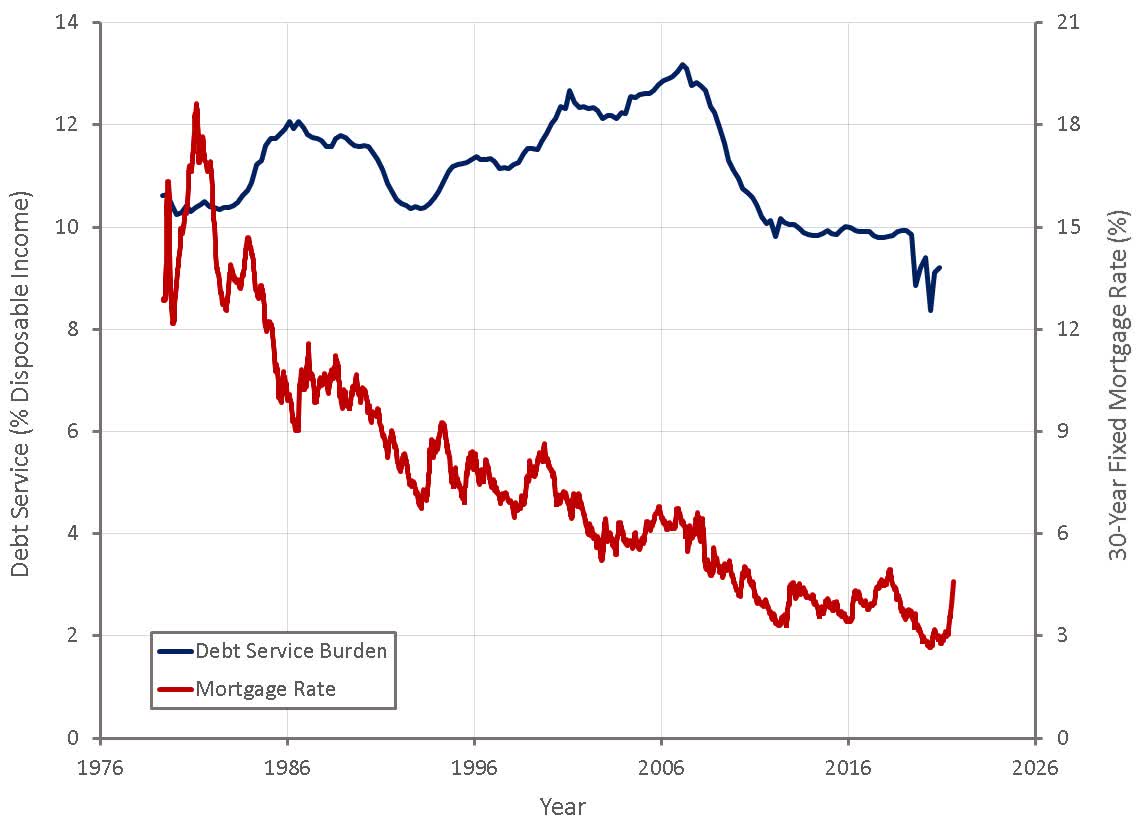
Figure 7: US Household Debt Service Burden (source: Created by author using data from The Federal Reserve)
It has also been suggested that a rapid increase in the prices of the least expensive houses is an indication that the market is peaking, as renters who are relatively poorly positioned to purchase a home may feel the market is getting away from them and purchase a home that they cannot really afford. There was some evidence of this in the lead up to the 2007 crisis and it has certainly been the case over the past 12 months.
Investor purchasing of homes has generally increased over the past 20 years, driven in part by private equity firms and corporate landlords. There is evidence that this purchasing is concentrated in areas with relatively inexpensive housing and may be responsible for the recent rapid increase in prices. If this is the case, the rise in price of inexpensive houses is less likely to be an indicator of market weakness.
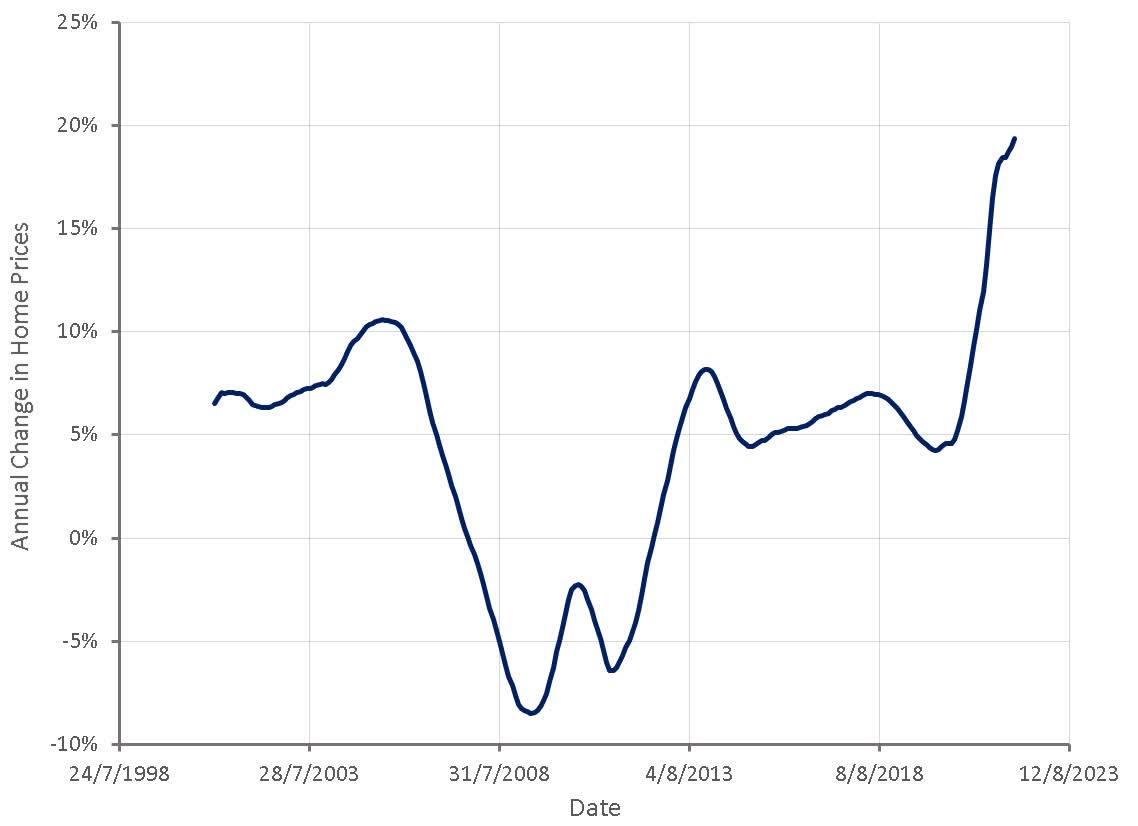
Figure 8: Annual Change in Inexpensive Home Prices (source: Created by author using data from Zillow)
While a decrease in building activity is likely, a decline in house prices is unlikely without substantial financial stress. The 2007 crisis was characterized by low quality lending and sky rocketing delinquency rates as a result. There is no evidence of this occurring in the current market though. Delinquency rates remain low, which is consistent with relatively low debt service levels.
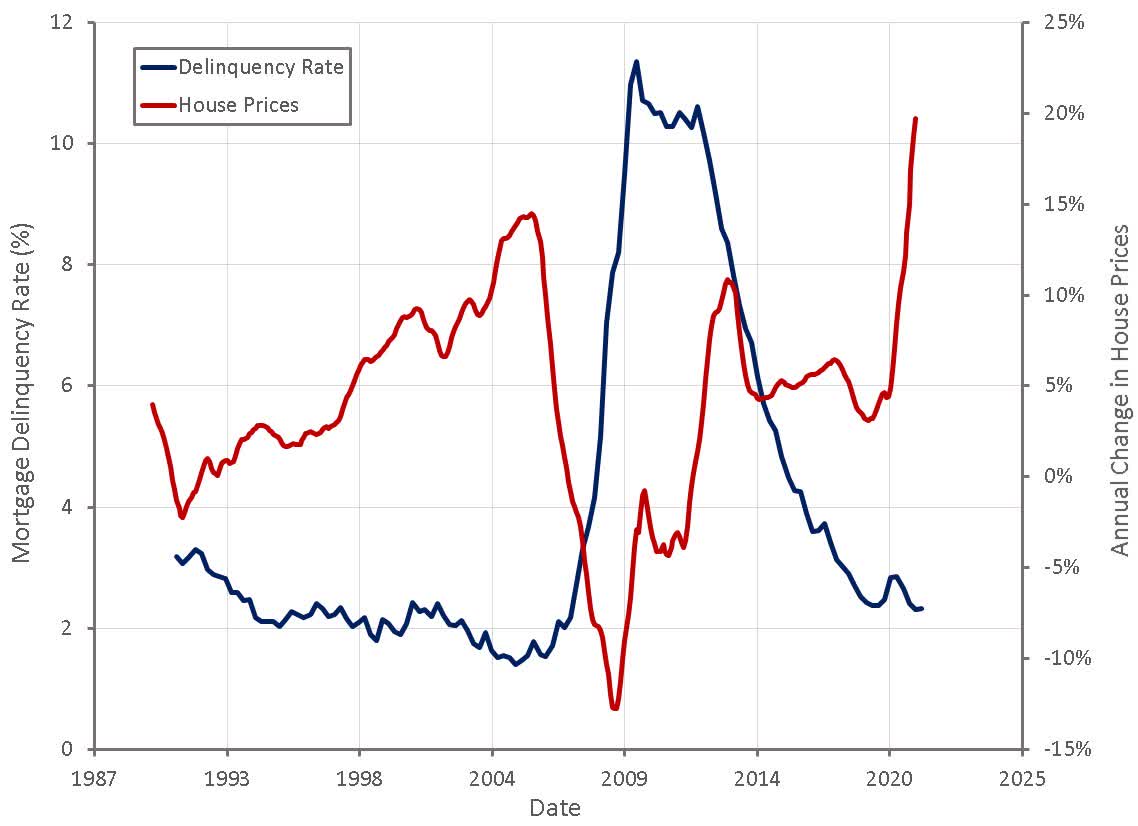
Figure 9: Mortgage Delinquency Rate (source: Created by author using data from The Federal Reserve)
A period of extended weakness in the housing market is likely to negatively impact the economy as a whole, but in particular home builders, brokers and lenders. It is also likely that suppliers of durable goods will be negatively impacted and the price of raw materials like timber will also likely decline. Some of these trends have already begun to play out, but there is likely still further downside risk as the situation evolves. Much of this will depend on the extent to which monetary policy is tightened. With a range of leading indicators like manufacturing activity and freight costs indicating that inflation will begin to rapidly decline in coming months, monetary policy may not tighten as much as expected which could provide a softer landing.
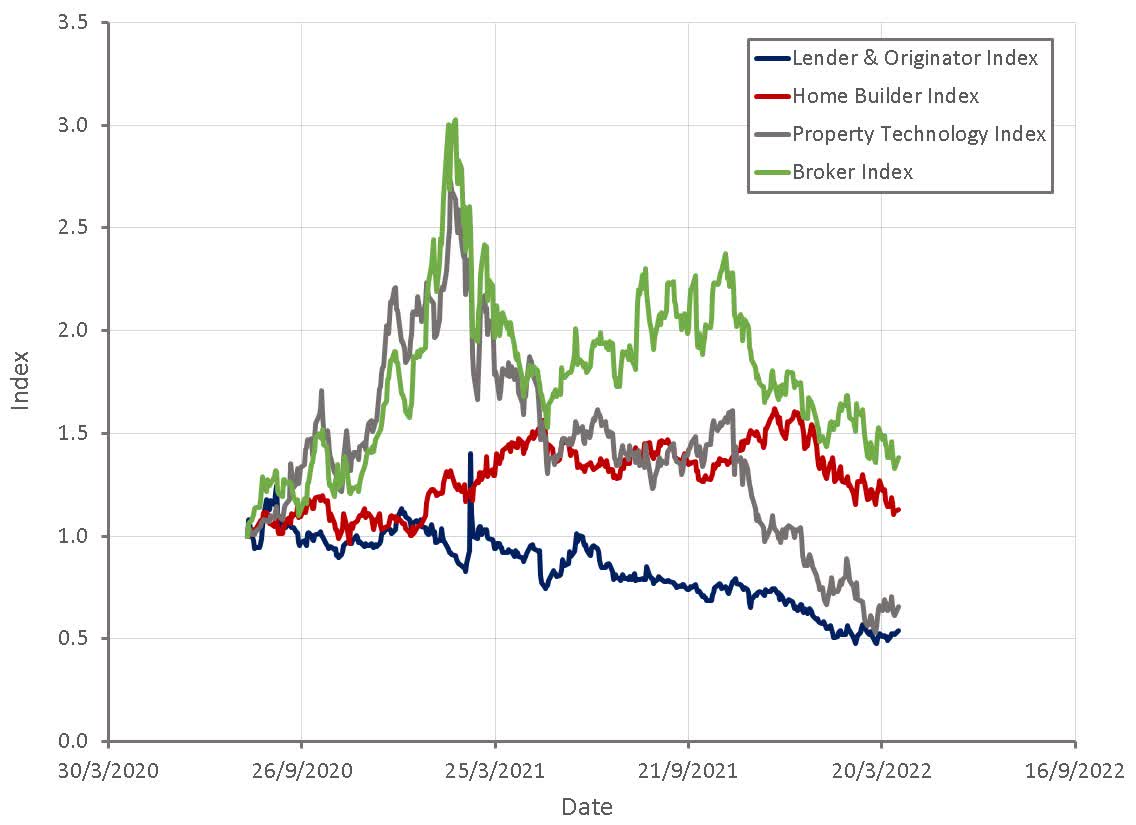
Figure 10: Housing Market Segment Indices (source: Created by author using data from Yahoo Finance)
Be the first to comment