Dow Jones Price Outlook:
- The Dow Jones soared nearly 1,300 points (5%) on Monday as central banks hinted at stimulus
- With investors buying into the talk, the onus is on central bankers to deliver follow-through
- An early indication of their willingness to act will be offered at the upcoming RBA rate decision
Dow Jones Forecast: Stocks Soar as History Suggests Further Volatility Ahead
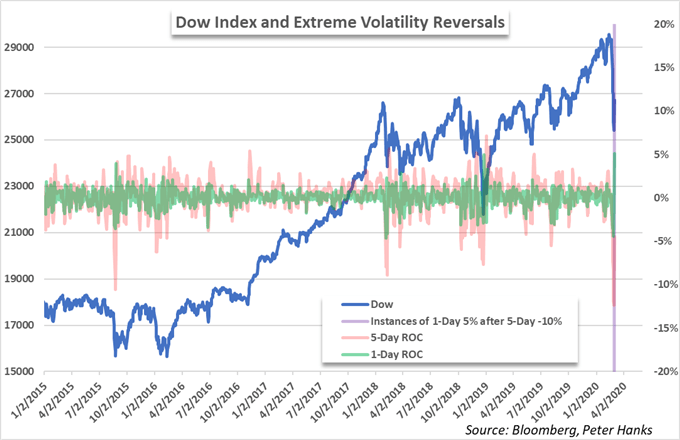
The Dow Jones climbed 5% higher on Monday as it recovered nearly 1,300 points from the Friday close which capped off the worst weekly performance for the index since the 2008 Great Financial Crisis. As stocks rallied, many analysts were eager to credit central bankers, finance ministers and government officials for their consideration of possible stimulus to combat the economic impacts of coronavirus. As a result, investors will look to the major central banks for assistance as stocks attempt to hold onto reclaimed ground.
Dow Jones Price Chart: Daily Time Frame (January 2018 – March 2020)
To be sure, current market conditions are at extremes and the resultant volatility and price action has relatively few historic parallels as a result. Most of the equitable occasions have coincided with major stock market crashes or global developments that make central bank intervention necessary to avert deeper declines.
Starts in:
Live now:
Mar 04
( 16:03 GMT )

Recommended by Peter Hanks
Weekly Stock Market Outlook
With that in mind, it seems central bank intervention is not only likely, but perhaps necessary as an already flagging global economy grapples with a unique headwind.
Dow Jones Volatility Stands at Extremes
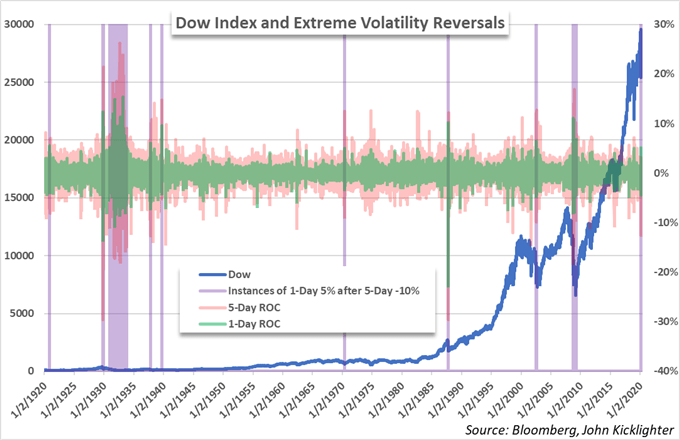
Dating back to 1940, the Dow Jones has witnessed a single day gain of more than 5% after a 5-day rate of decline greater than -10% only fifteen times – one of which was posted today. Concerningly, other such instances occurred during historically turbulent times like the aftermaths of the Dot-Com Bubble and Great Financial Crisis. Therefore, the current standing of the Dow Jones is precarious.
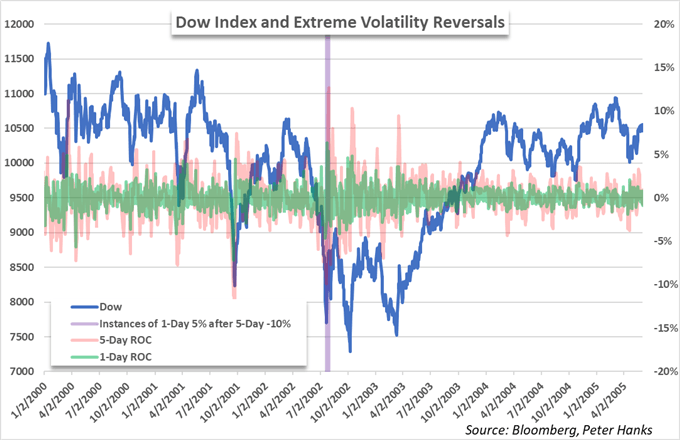
Dow Jones Volatility and Eventual Reversal in 2002
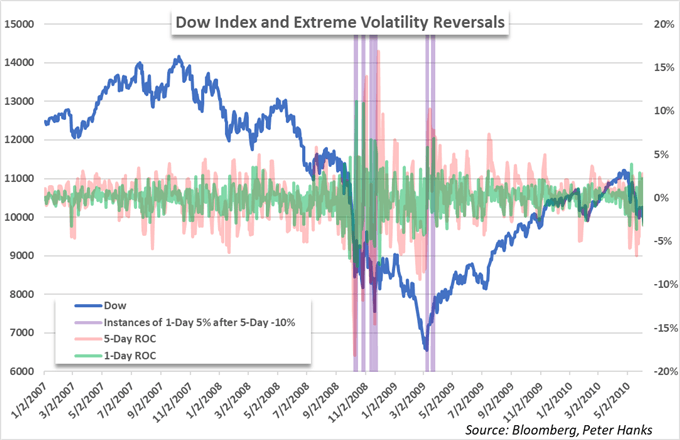
While previous instances were typically followed by rate cuts and other forms of stimulus to revive a struggling economy, many of the events were similarly followed by weeks of severe volatility and uncertainty. It can also be argued the longer-term performances are skewed due to the nature of the asset class.
Dow Jones Volatility During the Great Financial Crisis
Either way, it seems as though the Dow Jones is amid a truly historic string of performances that could force the hand of the major central banks. That said, investors will eagerly await further commentary from central bankers and government officials on the steps being taken to combat the economic impact of coronavirus.
Early insight will be offered by the Reserve Bank of Australia, but officials from the ECB and US Government have already disseminated a willingness to act. Should policy change to meet expectations, the Dow Jones and other major stock indices may enjoy gradual recoveries, but history has shown the possibility of further declines in the weeks ahead remains regardless. In the meantime, follow @PeterHanksFX on Twitter for updates and analysis on the stock market.
–Written by Peter Hanks, Junior Analyst for DailyFX.com
Contact and follow Peter on Twitter @PeterHanksFX


Be the first to comment