S&P 500, US Treasuries, Gold Talking Points
- Last week produced a brutal sell-off in US equities.
- What had started as a pullback two weeks ago pushed into correction territory last week, with a move as large as 15% showing from last Monday to last Friday morning.
- So far this week, recovery has been the tone in US stocks: But risk aversion themes have continued to show in both bonds and Gold even with the FOMC posing an emergency rate cut.
S&P Futures Pullback Ahead of US Open
It’s been a series of astounding moves across global markets over the past few weeks. What had been established as a continued up-trend quickly turned around three weeks ago and sellers have dominated the risk trade ever since. Last week was especially breathtaking in global equity markets, and that’s when this theme turned from a pullback in the S&P 500 to a straight-up sell-off, putting the index in ‘correction’ territory with bear market territory getting closer and closer.
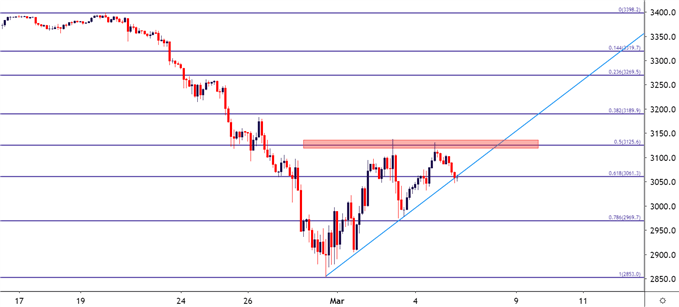
Last week alone saw the S&P fall by as much as 15%, erasing the entirety of 2020 gains in the index and support finally showing up around the Q4 2019 low. Last Friday produced a mercy bounce into the weekend, and that theme of strength has so far stuck around this week, with price action retracing up to the 50% marker of this recent sell-off. That resistance came into play on Tuesday, remained throughout the session yesterday, and sellers are taking another swing today ahead of the US equity open.
S&P 500 Daily Price Chart
To thicken the drama: Tomorrow brings Non-Farm Payroll numbers out of the US. We’re now at the point where slowdown from Coronavirus may start to show in US data, similar to what’s been happening in China after last month’s 5.4% CPI print and last week’s Chinese PMI print that came-in below the 30-marker.
Starts in:
Live now:
Mar 05
( 18:03 GMT )

James Stanley’s Thursday Webinar
Trading Price Action
Given that this threat is rather new in the US, it’s a point of interest to see how much it impacted hiring in February and this will be the first look at that data that traders will get to peek at.
There’s also been another big change of recent and this is likely not yet reflected in the data: The Federal Reserve rushed to markets with an emergency rate cut of 50 basis points; the first of its kind since 2008 during the heaviest portion of the financial collapse. While on its face this should be a positive for US corporates and US equity, the fact that data hasn’t really reflected much of a slowdown (yet) and also given the fact that this risk is still permeating throughout the US, that emergency action appeared to trigger more alarm than security. Market participants are now wondering what the Fed might know that isn’t yet public or, whether there’s a larger risk on the horizon that is waiting to show itself.
In the S&P 500, this presents a couple of different directional possibilities. On a shorter-term basis, buyers have been clawing back from last Friday’s bounce through the first-half of this week. This has built into an ascending triangle-like formation, with a series of higher-highs going along with that horizontal resistance around the 50% marker of the sell-off. This can substantiate bullish approaches on a shorter-term basis, driven by the idea that the Fed’s quick maneuvering may help to offset any potential slowdowns that may show with the further spread of Coronavirus throughout the US.
S&P 500 Two-Hour Price Chart
The Big Story: US Rates
While all of the above is interesting, a 15% pullback in the S&P 500 over a week isn’t unheard of. It’s happened before and it’ll likely happen again. What has happened recently that’s historical is the fall in US rates. Sure, the Fed is cutting an expected to cut some more: The next FOMC meeting is now just two weeks away.


Recommended by James Stanley
Download our fresh Q3 Gold Forecast
But rates markets have run amok as capital flows have driven into US Treasuries, and that drive hasn’t yet given any signs that it may soon be letting up.
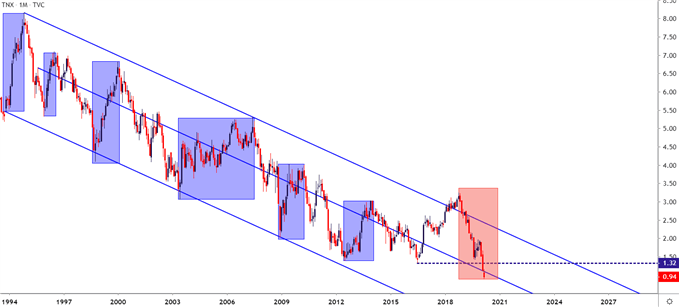
The 10-year Treasury Note is currently trading below one-percent. The prior all-time-low, set in October of 2016, right around the contentious US Presidential election – was at 1.325%. So, given all of the flurry of risks that have shown over the past decade in a post-GFC environment, markets have never been as unnerved as they are now as exhibited by capital flowing into safe-haven government bonds.
So for this week, we had one of those rare instances in which both bond and stock prices are moving in the same direction; and thusly, yields and stock prices are going in opposite directions. Even with equity recovering, traders were continuing to pile into the Treasury complex, indicating that they’re still worried or concerned about what might be around that next corner.
Ten-Year Treasury Yields Crossing Below One Percent
Gold Goes Breakout
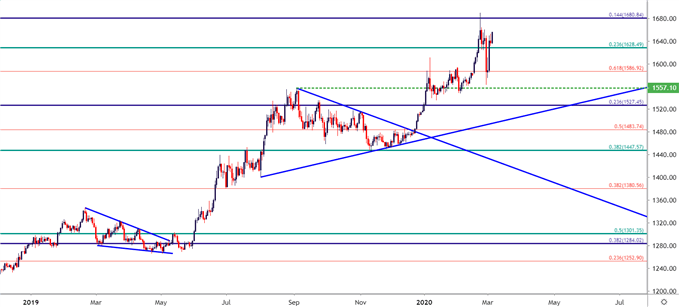
Given the mass worry around current conditions, there’s been a big beneficiary in commodity markets of recent and that’s Gold.


Recommended by James Stanley
Download our Q1 Gold Forecast
This was my top trade idea of the year, driven by the assumption that the Fed would continue to cut in 2020 after starting a cutting cycle last year. But I think few could expect how quickly this would happen or how aggressively buyers would load into Gold as fears of pandemic began to set-in. This is also an item of attraction for continued risk aversion, driven by the expectation that the Fed is going to do whatever is in their power to stem off a recession, even with massive slowdowns in supply chains as driven by fears around Coronavirus.
Gold Daily Price Chart
— Written by James Stanley, Strategist for DailyFX.com
Contact and follow James on Twitter: @JStanleyFX


Be the first to comment