USD/JPY Analysis and Talking Points
- Equity Market Fallout, FX Reaction Tame
- Japanese Yen Safe-Haven Qualities Returned?
- Japanese Yen Undervalued?
Equity Market Fallout, FX Reaction Tame
Yesterday, equity markets posted its largest drop in over 2-years as risk sentiment took a beating from the rising spread of the Coronavirus outside of China. In turn, with market participants evaluating that the impact of the Coronavirus could be significantly larger than initially thought to be the case, which had sparked a re-pricing in risk assets. That said, given the size of the move in global equities the spill-over into FX had been somewhat tame at best with the Japanese Yen yet to make a recoup last week’s breakout.
| Change in | Longs | Shorts | OI |
| Daily | 14% | -5% | 3% |
| Weekly | 9% | -26% | -12% |
Japanese Yen Safe-Haven Qualities Returned?
Given last week’s price action, the jury had been out as to whether the Japanese Yen had lost its safe-haven appeal with a pullback across equity markets and bond yields failing to coincide with repatriation flows into the Yen. However, reasons for the weakness in the currency could have been on the back of a delayed reaction to the weak Japanese GDP report, while investments flows had highlighted large outflows from Japanese investors into foreign bonds (Figure 1).
Source: DailyFX, Datastream
Japanese Yen Undervalued?
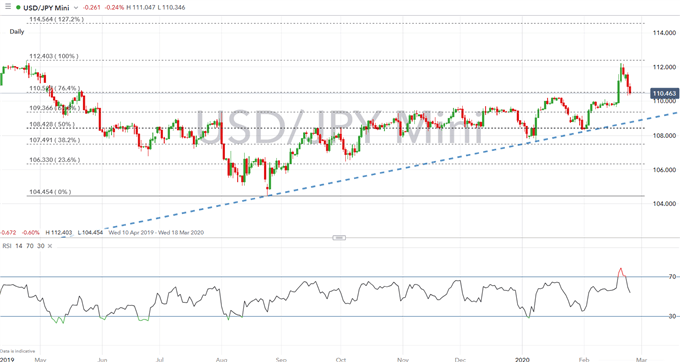
As US yields (10 year near all-time lows) continue to head lower alongside equity markets, we feel that the Japanese Yen remans somewhat undervalued and has room to play catch up with recent price action. Yesterday’s move did see support in the JPY, however, the 110.00 handle remains to be tested. As such, given that authorities have failed to show notable signs of containing the virus, risks are likely to remain on the downside. Alongside this, eyes will be on the World Health Organisation who have yet to state that the coronavirus is a pandemic, which a decision to confirm could spark renewed selling.
USD/JPY Technical Table
|
Support |
Resistance |
||
|
110.52 |
76.4% Fib |
111.00 |
– |
|
110.00 |
– |
111.70 |
Weekly High |
|
109.50 |
– |
112.22 |
YTD Peak |
USD/JPY Price Chart: Daily Time Frame
Source: IG Charts
— Written by Justin McQueen, Market Analyst
Follow Justin on Twitter @JMcQueenFX


Be the first to comment