

Dilok Klaisataporn
This article originally published on October 5, 2022.
While Street Earnings[1] overstate profits for the majority of S&P 500 companies, as shown in our recent article “Street Earnings Overstated for 73% of S&P 500 in Q2 2022,” there are many S&P 500 companies whose Street Earnings understate their true Core Earnings.
This report shows:
- the frequency and magnitude of understated Street Earnings in the S&P 500
- five S&P 500 companies with understated Street estimates likely to beat 3Q22 earnings.
Street Understates EPS for 153 S&P 500 Companies
153 companies with understated Street Earnings represent 27% of the market cap of the S&P 500 as of 8/12/22, measured on a rolling four-quarter basis. For comparison, 152 companies representing 27% of the S&P 500 market cap had overstated Street Earnings in the previous quarter.
Figure 1: Understated Street Earnings as % of Market Cap: 2012 through 8/12/22
Understated Street Earnings Through 2Q22 (New Constructs, LLC)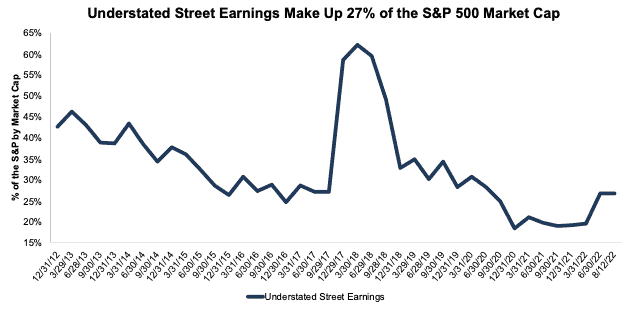
Sources: New Constructs, LLC and company filings.
When Street Earnings understate Core Earnings, they do so by an average of -15%, per Figure 2. Street Earnings understate by >10% for ~10% of S&P 500 companies.
Figure 2: Street Earnings Understated by -15% on Average in TTM Through 2Q22[2]
Understated Earnings Stats Through 2Q22 (New Constructs, LLC)
Sources: New Constructs, LLC and company filings.
Five S&P 500 Companies Likely to Beat Calendar 3Q22 Earnings
Figure 3 shows five S&P 500 companies likely to beat calendar 3Q22 earnings because their Street EPS estimates are understated. Below, we detail the hidden and reported unusual items that caused Street Distortion and understated Street Earnings in the TTM ended 2Q22 for SolarEdge Technologies, Inc. (SEDG).
Figure 3: Five S&P 500 Companies Likely to Beat 3Q22 EPS Estimates
5 Companies Likely to Beat 3Q22 Estimates (New Constructs, LLC)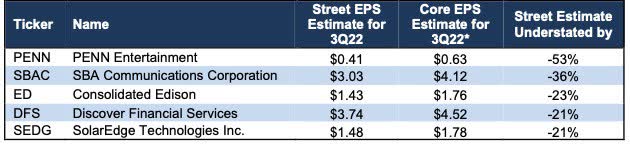
Sources: New Constructs, LLC, company filings, and Zacks*Assumes Street Distortion as a percent of Core EPS equals the same percent in 3Q22 as the TTM ended 2Q22
SolarEdge Technologies: The Street Understates Earnings for 3Q22 by $0.30/share
The Street’s 3Q22 EPS estimate of $1.48 for SolarEdge understates our estimate for 3Q22 Core EPS of $1.78/share by $0.30/share. Large financial expense and exchange rate losses included in historical EPS drive the difference between the Street and Core EPS estimates and lead us to forecast SolarEdge as one of the companies most likely to beat Wall Street analysts’ expectations in its calendar 3Q22 earnings report. SolarEdge’s Earnings Distortion Score is Beat. However, its Stock Rating is Unattractive, which indicates that while the short-term likelihood of an earnings beat is high, the long-term risk/reward of the stock is unattractive.
Below, we detail the unusual expenses that materially reduced SolarEdge’s 2Q22 Street and GAAP Earnings. After removing all unusual items, we find that SolarEdge’s TTM 2Q22 Core EPS are $3.03/share, which is better than the TTM 2Q22 Street and GAAP EPS of $2.51/share.
Figure 4: Comparing SolarEdge’s Core, Street, and GAAP Earnings: TTM Through 2Q22
SEDG Core Vs. GAAP vs. Street Earnings 2Q22 (New Constructs, LLC)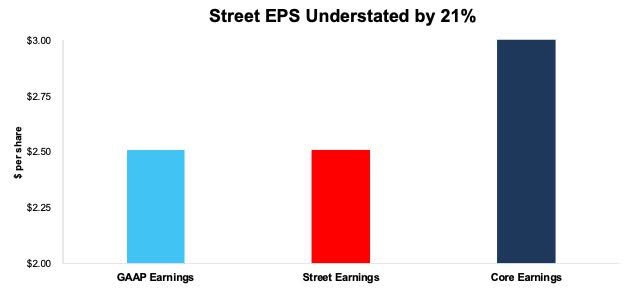
Sources: New Constructs, LLC, company filings
We detail the differences between Core Earnings and GAAP Earnings so readers can audit our research. We would be happy to reconcile our Core Earnings with Street Earnings but cannot because we do not have the details on how analysts calculate their Street Earnings.
Figure 5 details the differences between SolarEdge’s Core Earnings and GAAP Earnings.
Figure 5: SolarEdge’s GAAP Earnings to Core Earnings Reconciliation: TTM Through 2Q22
SEDG Core to GAAP Earnings Reconciliation (New Constructs, LLC)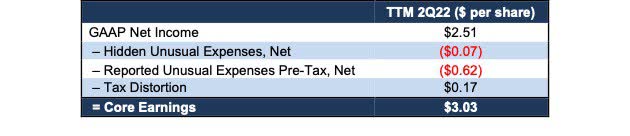
Sources: New Constructs, LLC and company filings.
More details:
Total Earnings Distortion of -$0.52/share, which equals -$29 million, is comprised of the following:
Hidden Unusual Expenses, Net = -$0.07/per share, which equals -$4 million and is comprised of
- -$4 million in loss on disposal of assets and inventory write-downs in the TTM period based on
Reported Unusual Expenses Pre-Tax, Net = -$0.62/per share, which equals -$35 million and is comprised of
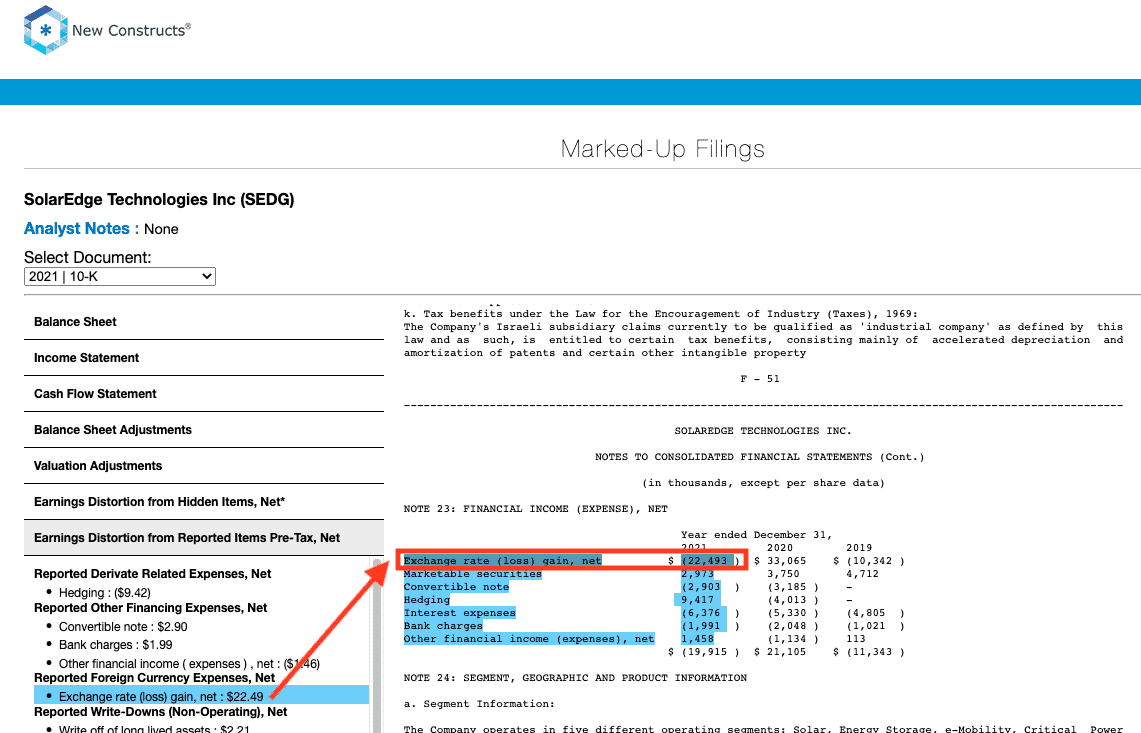
- -$22 million exchange rate loss in the TTM based on a -$22 million loss in the 2021 10-K
- -$15 million financial expenses in the TTM period based on
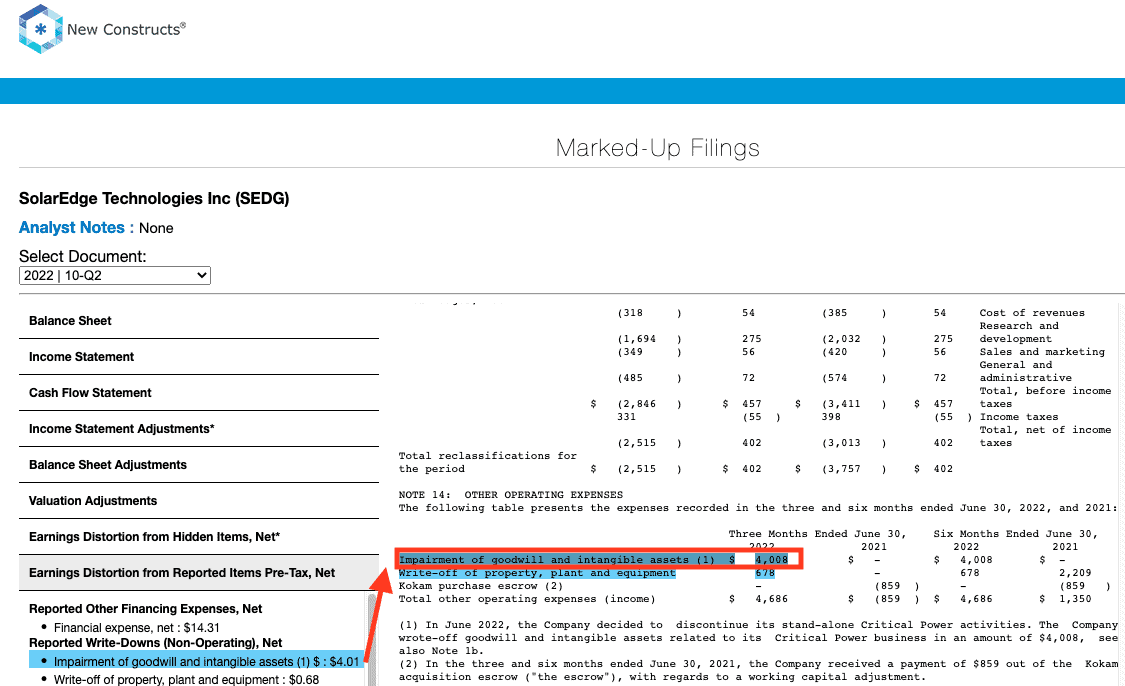
- -$7 million in reported write downs in the TTM based on
- -$4 million impairment of goodwill and intangible assets in 2Q22
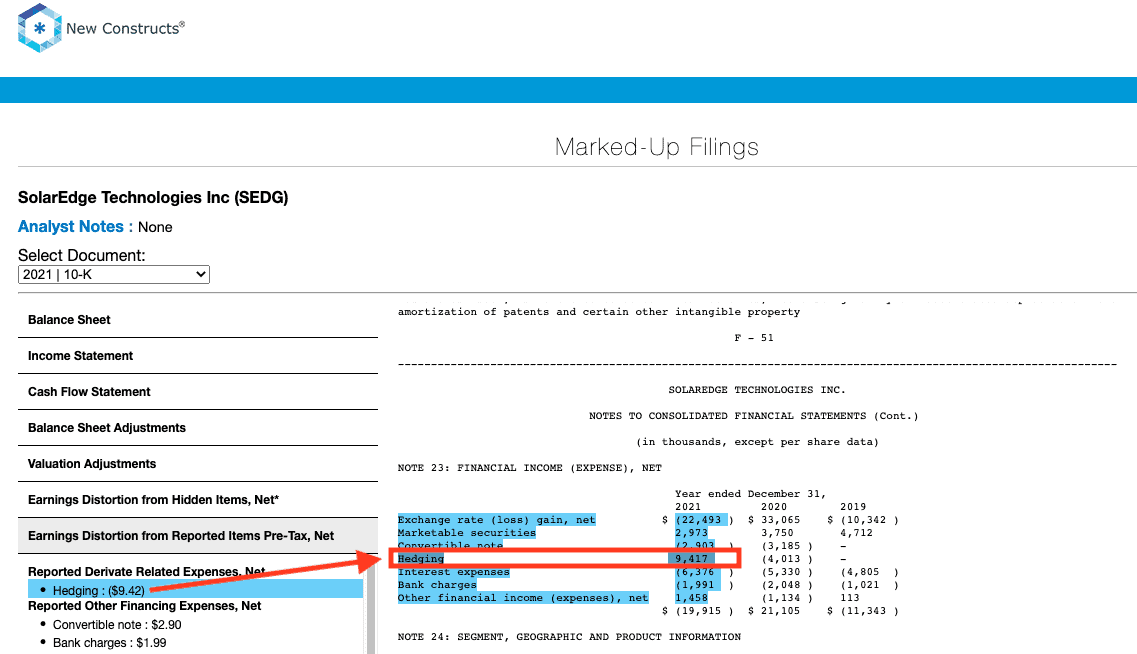
- $9 million hedging income in the TTM based on a $9 million gain in the 2021 10-K
Tax Distortion = $0.17/per share, which equals $9.7 million.
The similarity between Street Earnings and GAAP Earnings for SolarEdge indicates that Street Earnings fail to account for most of the unusual items in GAAP Earnings, even as some of the unusual items are reported directly on SolarEdge’s income statement. Core Earnings on the other hand include a more comprehensive set of unusual items when calculating SolarEdge’s true profitability.
Disclosure: David Trainer, Kyle Guske II, and Matt Shuler receive no compensation to write about any specific stock, style, or theme.
[1] Street Earnings refer to Zacks Earnings, which are adjusted to remove non-recurring items using standardized sell-side assumptions.
[2] Average understated % is calculated as Street Distortion, which is the difference between Street Earnings and Core Earnings.
Be the first to comment