

DNY59
Introduction
In this article, I will refer to my previous article about Medifast (NYSE:MED) to explain my stance on the company and if something has changed with these Q2 earnings. In my last article, I dived deep into Medifast’s business model, financials, peer comparison, and risks. If you haven’t read it already but are curious about that or why I rated it as a strong buy, I recommend giving it a quick look. Furthermore, I will talk about the recent earnings, the new outlook, and what this means for the stock.
Previous article
In my recent article, I wrote:
“MED is one of the few stocks which combines good characteristics of value, growth, and dividend stocks.”
“The management has proved to be very investor-friendly, which assures me that more shareholder returns are there to come.”
” In times of rising rates, a company’s performance is somehow dependent on its debt. In the case of Medifast, you don’t have to worry about debt since the balance sheet is entirely debt free. When it comes to debt-heavy growth stocks, Medifast stands out.”
“My thesis is that Medifast’s stock will rise again and outperform the market due to a great market outlook, superior growth and profitability metrics, and a better balance sheet compared to its peers, in addition to its current undervaluation.”
By market outlook, I meant the specific obesity market, which is still an excellent growing market. But right now, the overall market isn’t looking so well due to inflation, rate hikes, supply chain disruption, and more. Therefore, some of these things have changed, at least for the short term. I will come back to this later.
Q2 earnings
It doesn’t look that bad when giving the earnings a quick look. MED grew revenue and income more than anticipated by the analysts with a beat of 1.22% for revenue and 19.7% for EPS. But, looking deeper, you can see why the stock tanked 16% following these earnings. Revenue grew 15% YoY, the third slowest growth rate after Q1 2020 (7.6%) and Q3 2017 (12.6%) in MEDs history. EPS declined by 13.6%, the first decline in MEDs history.
As mentioned by the management in the press release, inflation is the reason for the slowdown in revenue growth: “We’re not immune to issues in the wider macroeconomic environment, and like many consumer-focused businesses, we’ve seen the impact of inflation on customer retention and consumer sentiment…”
That is something nearly every company has to deal with right now, nothing entirely company-related, which is good to see. Nonetheless, I had thought Medifast wouldn’t react that much to the slowdown in demand due to their business model. So that is something I will calculate in my rating for MED.
The decline in EPS is driven by substantially higher cost of sales (COGS) and higher selling, general & administrative (SG&A) expenses.
Income statement, quarterly (fastgraphs.com )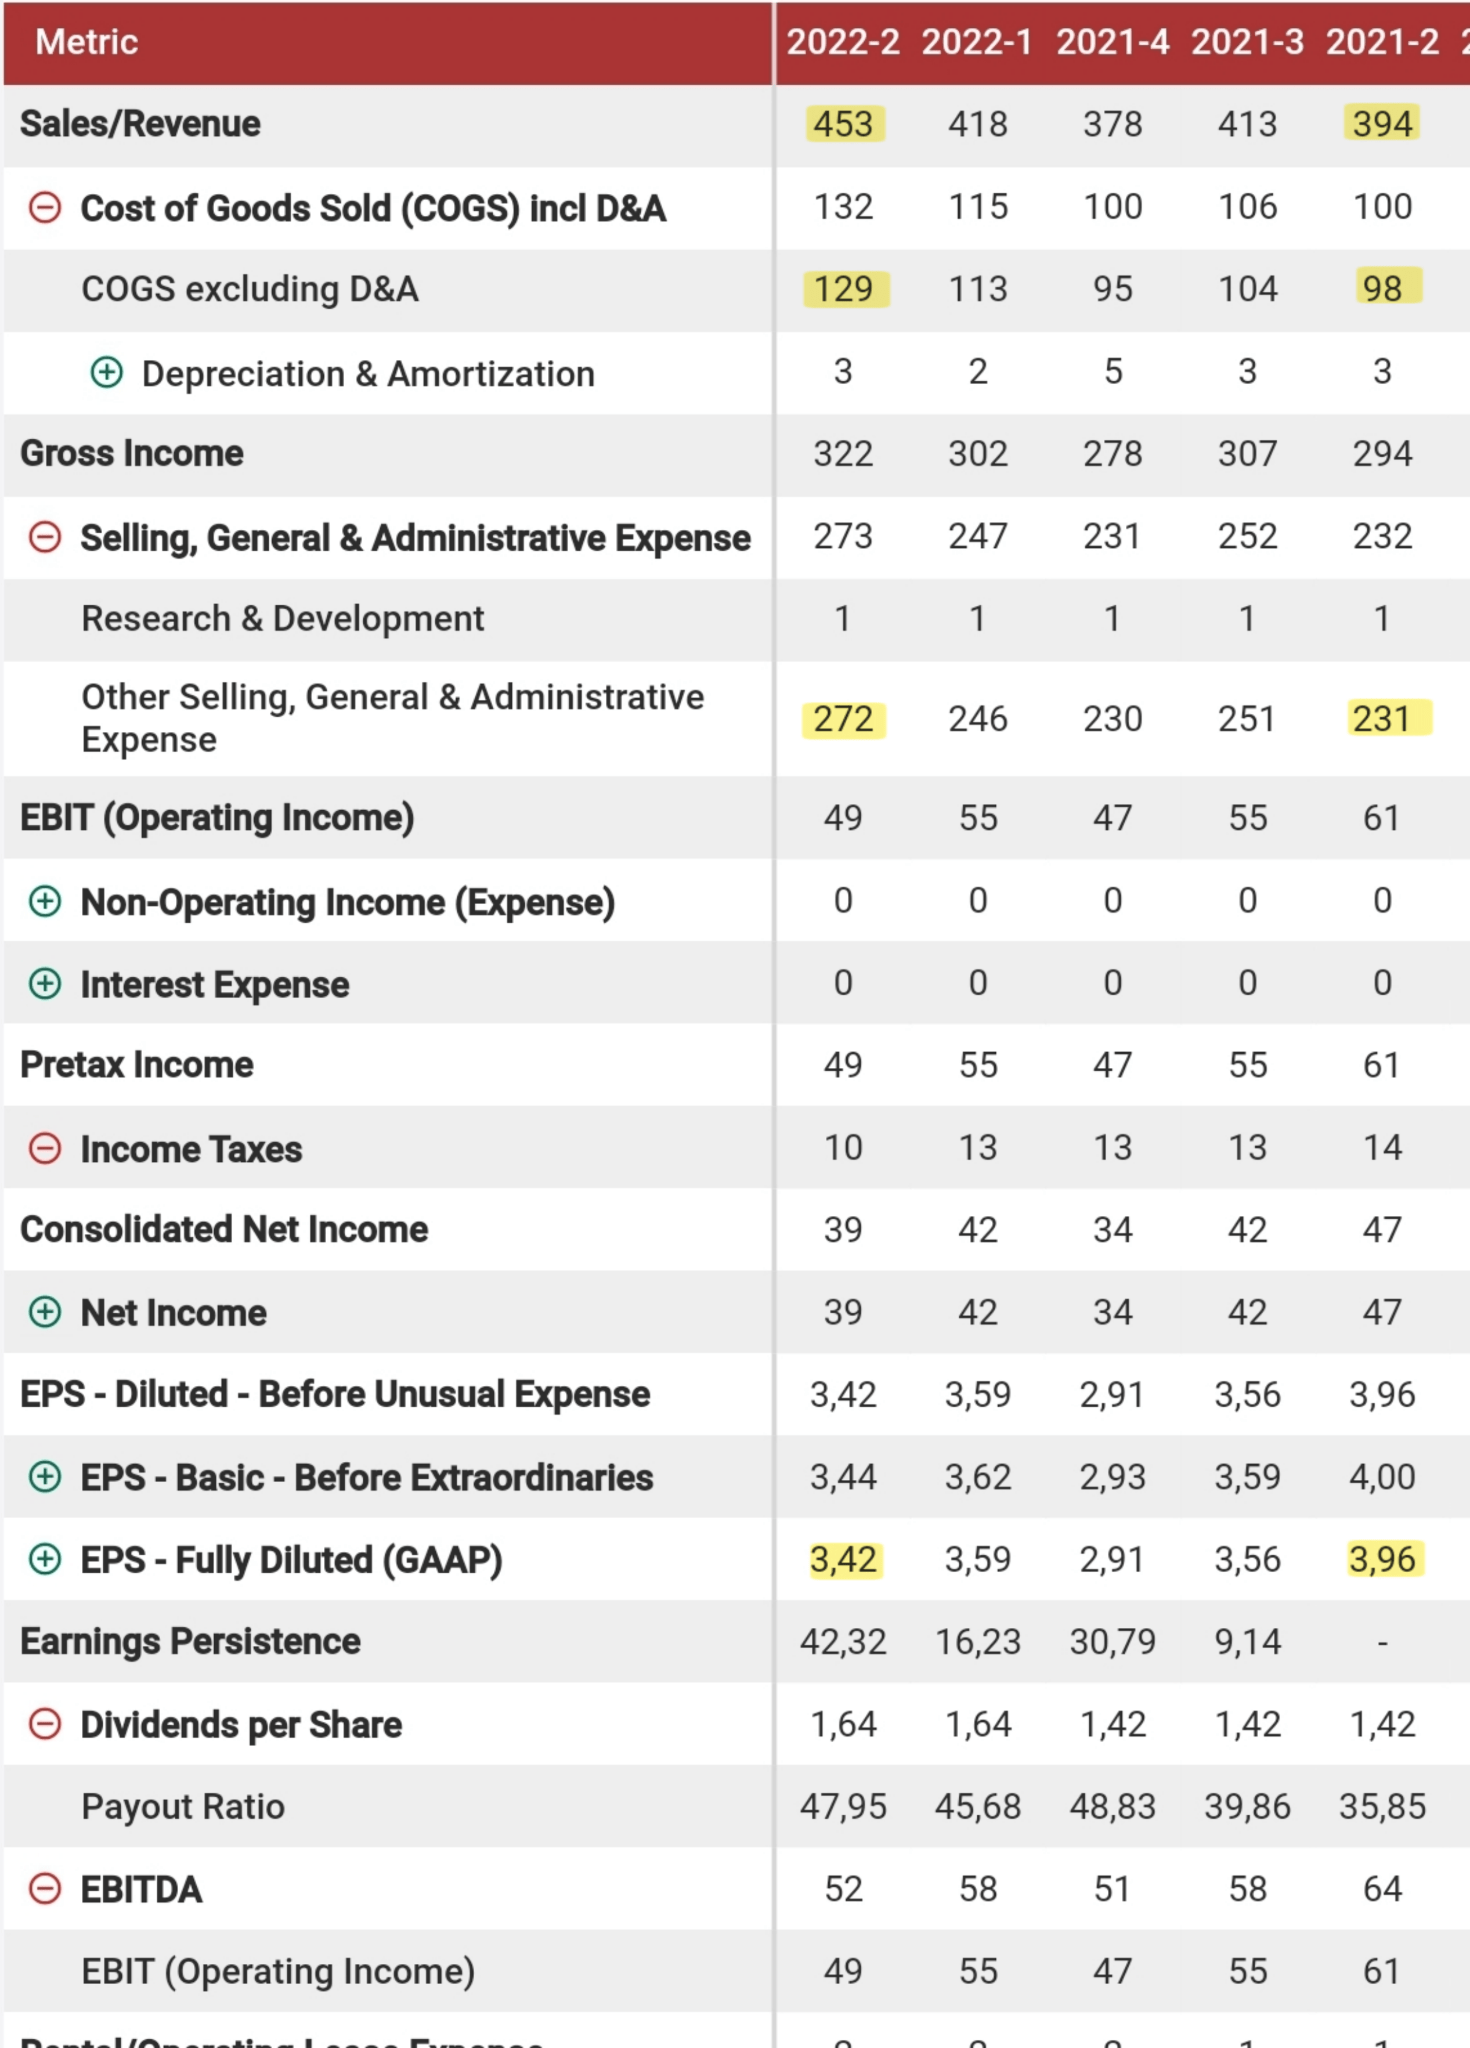
I have highlighted the essential changes which led to the decline in EPS. COGS rose by almost 32%, from $98 to $129 million. This results from higher material prices, production, and transportation costs. So, in short: inflation. Maybe something the management could have avoided partially, but not entirely. SG&A expenses grew by 17.4% to $272.7 million compared to $232.3 million for the second quarter of 2021.
As a percentage of revenue, SG&A increased 124 basis points year-over-year to 60.2% of revenue, compared to 58.9% in Q2 2021.
As mentioned by the management, this was due to:
“…higher OPTAVIA Coach compensation expense, donations made to support the Ukrainian relief effort (“Donations”), incremental costs related to continued investment in information technology and distribution infrastructure, and increased credit card fees resulting from higher sales.”
The coaches are the center of MED’s business model, so higher expenses aren’t that negative. I can’t say something negative about donations to Ukraine, either. Incremental costs for investments in information technology and distribution infrastructure will probably boost growth and efficiency in the future, so that is relatively positive. Higher credit card fees are nothing new and normal with rising sales. I don’t want to pretend that this is all good. A decline in EPS of 13.6% is everything but good. But the reasons for this are only partially company-related and more due to the overall market.
There were some good things in this quarterly earnings, too. Active coaches grew by 15% YoY, which shows that their business model works, even now. As I have pointed out in my previous article, the coaches are the heartbeat of MED’s operation and what separates them from the competition. Therefore, I am quite pleased that they are still growing. Furthermore, the management announced an accelerated $100 million share buyback program (ASR). With approximately 480 thousand shares repurchased as of June 30, 2022, and final settlement expected no later than October 2022. I like to see this as it is a way of shareholder return. Especially now when shares are trading way cheaper than they could be. I will catch up on the valuation later.
Balance Sheet
In my last article, I praised MED’s balance sheet primarily due to no debt and a high cash balance. However, this has changed with the Q2 numbers.
Balance Sheet, quarterly (fastgraphs.com)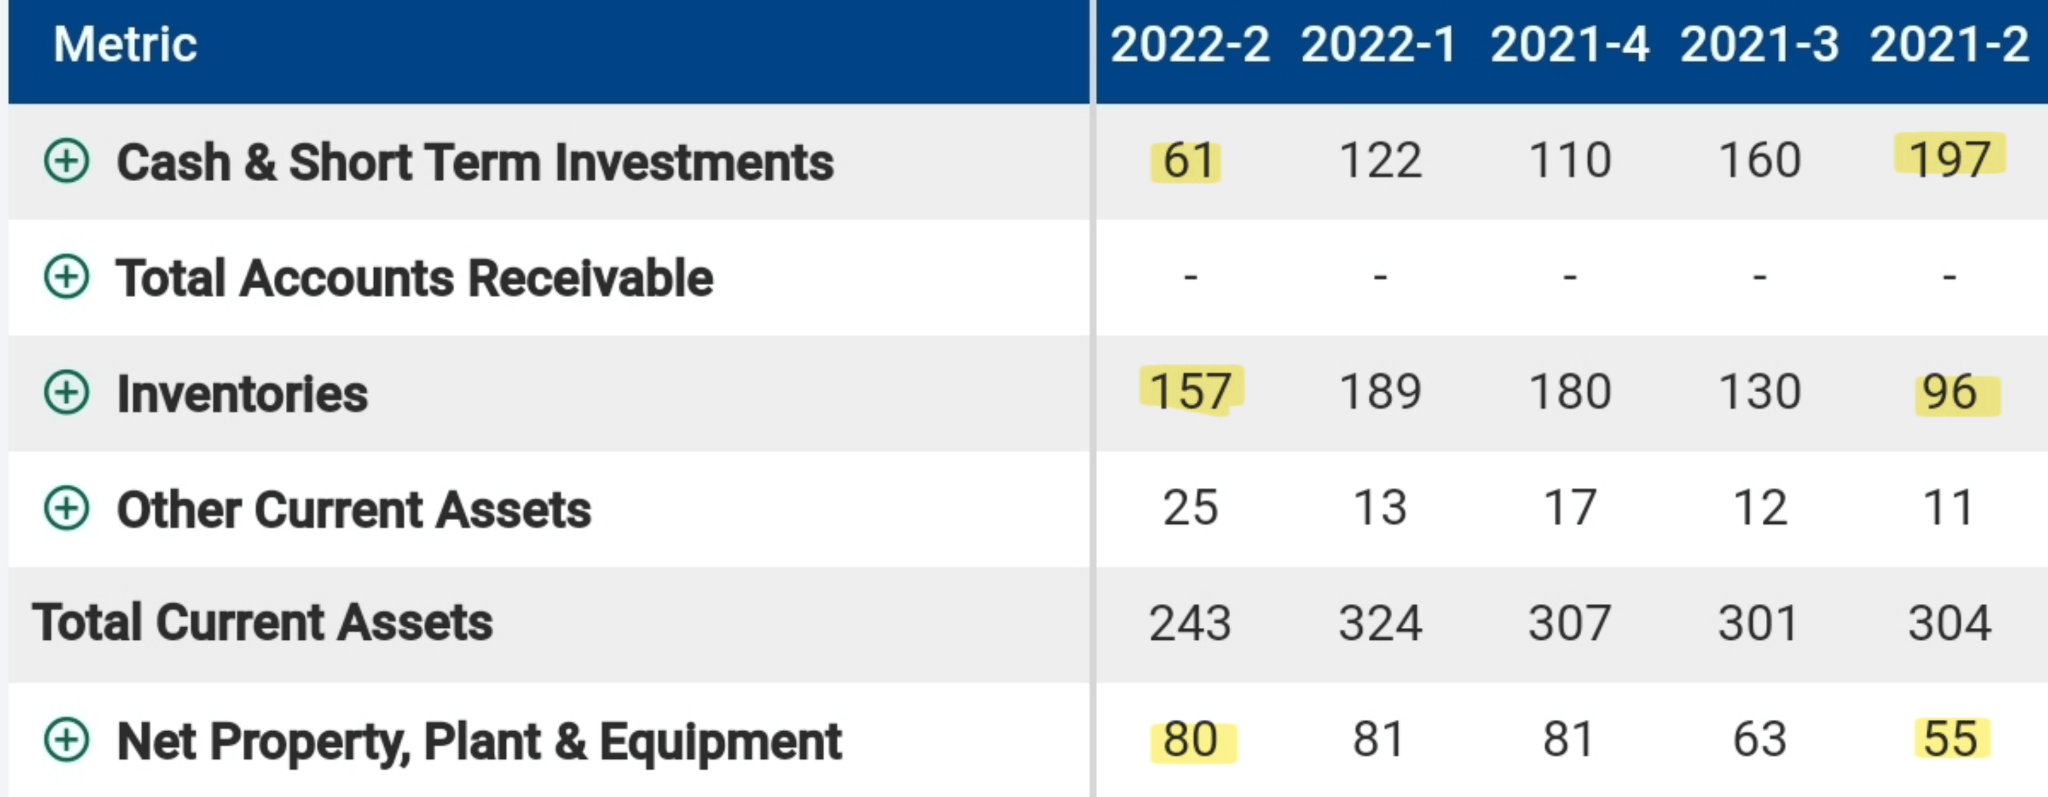
Cash & ST investments are down significantly from $197 to $61 million. This is due to the ASR, which consumed a lot of cash. Inventory is up by 63.5% YoY but down 17% QoQ. The inventory is an indicator of demand. Higher inventory usually indicates less demand because it got less sold than produced. A higher inventory creates costs, which is why it isn’t good in most cases. The fact that we see a significantly higher Inventory YoY could indicate precisely that. But I like to see that inventory is down from last quarter. This shows that the management managed this challenging situation well by reducing production and adapting it to the slower demand. Net Property, Plant & Equipment is up by 45.5% to $80 million from $55 million a year ago. Higher Net Property, Plant & Equipment shows that the management is continuing to execute the plan of developing the distribution infrastructure. For the first time in its history, MED got a revolving credit facility of $27 million. I liked that MED has no debt, but a revolving credit facility gives more financial flexibility, and $27 million isn’t much compared to sales of $450 million and net income of $39 million. Apart from this, MED’s balance sheet is still clean of debt.
Outlook and guidance
With the Q2 earnings, the management significantly lowered its full-year revenue guidance by around 10% to $1.58-$1.66 billion from $1.78-$1.84 billion. For Non-GAAP EPS, the management now expects $12.70 to $14.10, down by 12.5% from the previously announced range of $14.60 to $16.05. The analysts expect even less with revenue guidance of $1.57 billion and EPS guidance of $11.95. If these expectations turn out to be accurate, it would mean revenue growth of just 2.55% YoY and a decline of EPS of 14% YoY. I think this is what really caused the sell-off after earnings.
We’re not immune to issues in the wider macroeconomic environment, and like many consumer-focused businesses, we’ve seen the impact of inflation on customer retention and consumer sentiment, which will cause slower-than-anticipated growth in the second half. However, we believe we remain well positioned for significant future growth as we continue to execute our core strategies and expand further into the broader health and wellness arena.
Management is still sure about long-term growth even though we see these short-term headwinds which come due to the overall market and economy slowdown, again, nothing entirely company-related.
Valuation / Upside
This was the summary about valuation and upside here in my last article:
When taking all the different valuation methods (historic multiples, sector comparison, and DCF model) into consideration, I get an upside of around about 50% which is likable for a company with these characteristics. As mentioned in my investment thesis, this is one reason why I see Medifast as a great investment right now.
The things that have changed now are my DCF model and the historic multiples adapted to the growth prospects from analysts. I have updated my DCF model on the new analyst consensus, management guidance, and the lower share price. MY DCF model is very detailed, but now I will just show the changes I made, so I would suggest you look into my old article for more details.
DCF model, changed revenue growth (Author)
Now the DCF model uses the management guidance for revenue in 2022 and analyst consensus for the revenue in 2023, leading to growth of just 3.5% and 5.1% instead of 15% before. After that, I predict growth to pick up to the 15% goal again.
DCF model, result (Author)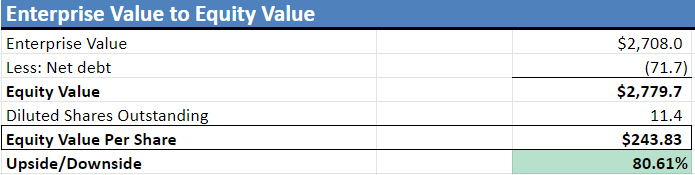
Due to a substantially lower share price and fewer outstanding shares, the upside rose significantly even though MED isn’t meant to grow very fast in 22/23. Since we have more uncertainties now, I will apply a margin of safety of 20%, bringing down the upside to 64%.
Looking at Fastgraphs.com, we can assess the upside according to adjusted earnings multiples and the analyst forecast.
Forecasting till 2024 (fastgraphs.com) Annual total return until 2024 if the share price reverts back to a 15 P/E (fastgraphs.com) Annual total return until 2024 if the share price reverts back to the 6-year historical P/E (fastgraphs.com)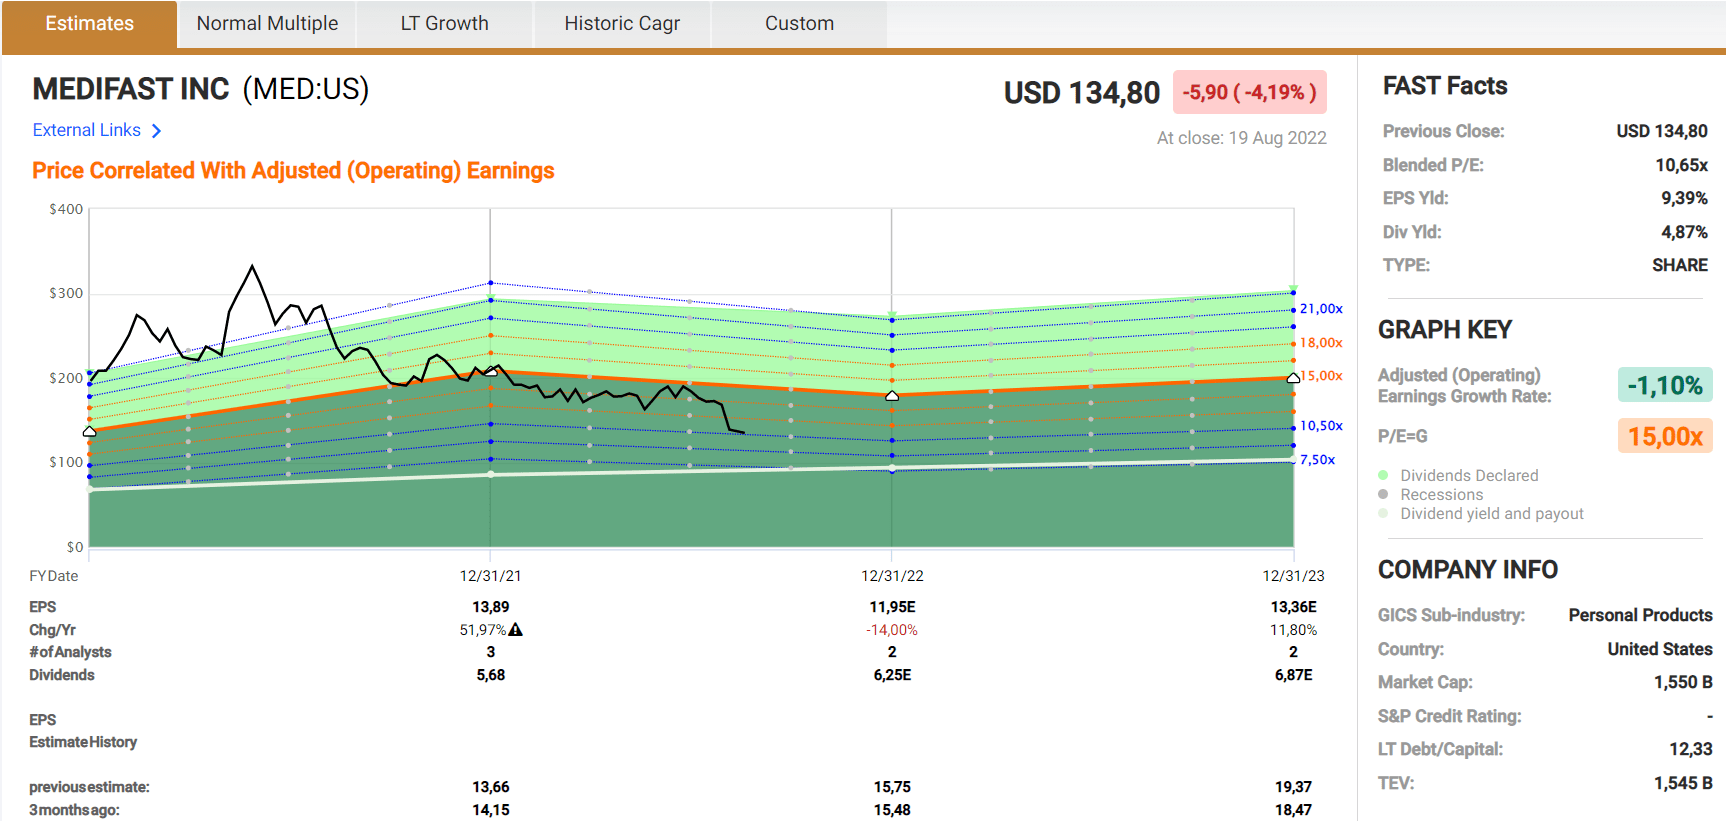
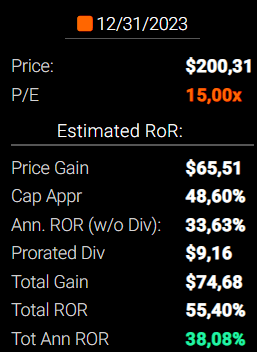
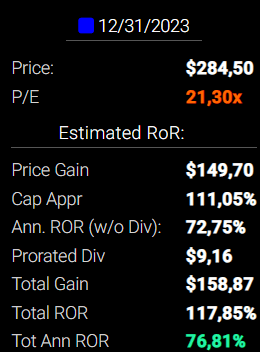
In my last article, I measured MED’s potential total return by reverting back to its historical P/E ratio. Since the growth is substantially lower, the P/E=G of 15x is a more conservative way to assess the total return. For the P/E=G, the total annual return until 2024 is 38%. For MED’s (6-year) historical P/E, the return in the same timeframe is 77%. The middle of these two potential returns is 57.5%. So, if I take my DCF model and the forecasted earnings from FAST graphs, I get to an average upside potential of 60%. In my last article, the upside was 50%.
Conclusion
These Q2 earnings showed that MED isn’t as resistant to external influences as I had thought, but we can also see that it is nothing company-related and that the business model, built on the coaches, still works. Furthermore, the management is still confident in its long-term potential and continues to pursue its growth and efficiency plans. The management is using the low share price to buy back shares as quickly as possible, generating shareholder returns even when share price gains aren’t contributing to that. The upside is higher than the last time I assessed it due to a much lower share price. All the other things I liked about MED, like the strong balance sheet, shareholder-friendly management, undervaluation, and the dividend, are still there as of now. I revise my rating from strong buy to buy due to more uncertainties. But as I have explained, MED is still a phenomenal company with much to like, even when growth doesn’t look so good in the near future.
Be the first to comment