

RapidEye/iStock via Getty Images
(This article was co-produced with Hoya Capital Real Estate)
Introduction
This article answers the question: “I like my ETF but I have a big loss. Is there a way of capturing that without being out of the market for 30 days or have double exposure for 30 days?”. The 30-days refers to the period when an investor cannot sell at a loss and buy a “substantially identical” investment and still write-off the tax loss at that time. Violate the rule, and the cost basis rolls forward. For more details see IRS Publication 550.
Author’s disclaimer:
I am not a tax lawyer or IRS rule expert. While this article is about legally capturing the loss of one ETF while replacing it with NOT a “substantially identical” ETF; according to Fidelity, there has been no IRS ruling on whether ETFs from different managers that track the same index are considered substantially identical. Here, there is the extra difference, besides managers, that the underlying indices differ too.
I review both the iShares Fallen Angels USD Bond ETF (NASDAQ:FALN) and the VanEck Vectors Fallen Angel High Yield Bond ETF (NASDAQ:ANGL), along with each index to see exactly how close they invest. While their correlation is 98%, they do follow different indices. Since “fallen angels” are now rated the same as other “junk bonds”, the returns and risk factors of both are also compared to such an ETF, the iShares iBoxx $ High Yield Corporate Bond ETF (HYG).
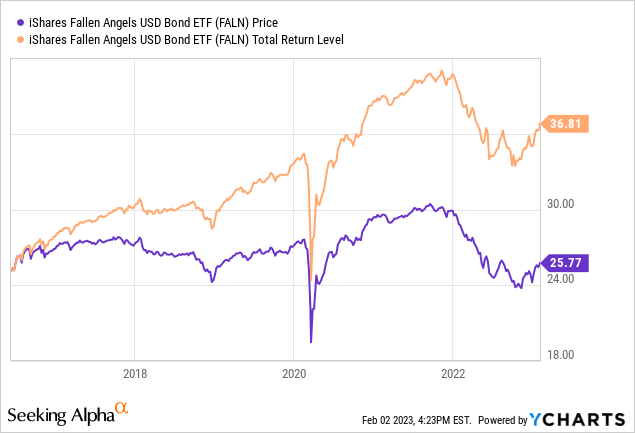
iShares Fallen Angels USD Bond ETF review
Seeking Alpha describes this ETF as:
The iShares Fallen Angels USD Bond ETF invests in the fixed income markets of developed countries across the globe. The fund invests in U.S. dollar-denominated high yield corporate bonds which were previously rated investment grade. The underlying index is the Bloomberg US High Yield Fallen Angel 3% Capped Index. FALN started in 2016.
Source: seekingalpha.com FALN
FALN has $1.55b in AUM and comes with 25bps in fees. The TTM Yield is 4.95%.
Index review
Bloomberg provides this description of their index:
The Bloomberg Barclays US High Yield Fallen Angel 3% Capped Bond Index is a component of the US Corporate High Yield Index that is designed to track USD-denominated, high yield, fixed-rate corporate bonds that have been downgraded from investment grade. Securities are classified as high yield if the middle rating of Moody’s, Fitch and S&P is Ba1/BB+/BB+ or below. Bonds from issuers with an emerging markets country of risk, based on the indices’ EM country definition, are excluded. The US High Yield Fallen Angel 3% Capped Bond Index was created in March 2016, with history backfilled to January 1, 2005.
The same document lists the Index rules:
- Principal and interest must be denominated in USD.
- Fixed-rate coupon issued by Corporate (industrial, financial institutions, utility) issuers. Minimum size: $150m still outstanding.
- Callable fixed-to-floating rate and fixed-to-variable bonds are eligible during their fixed-rate term only. Bonds with a step-up coupon that changes according to a predetermined schedule are eligible.
- Minimum of one before maturity. Bonds that convert from fixed to floating rate, including fixed-to-float perpetuals, will exit the index one year prior to conversion to floating-rate. Fixed-rate perpetuals are not included.
- Index Cap: Issuers that exceed 3% of the market value of the uncapped US High Yield Fallen Angel Index are limited at 3%. The excess market value over the 3% cap is redistributed on a pro rata basis to all other issuers’ bonds in the index that are under the 3% cap. The process is repeated until no issuer exceeds the 3% limit. For example, an issuer that represents 4% of the uncapped index will have 1% of the index’s market value redistributed to each bond from all issuers under the 3% cap on a pro rata basis. The 3% issuer cap is applied each month as the index is rebalanced.
FALN holdings review
I will start with portfolio characteristics provided by iShares.
ishares.com FALN ishares.com FALN sectors; compiled by Author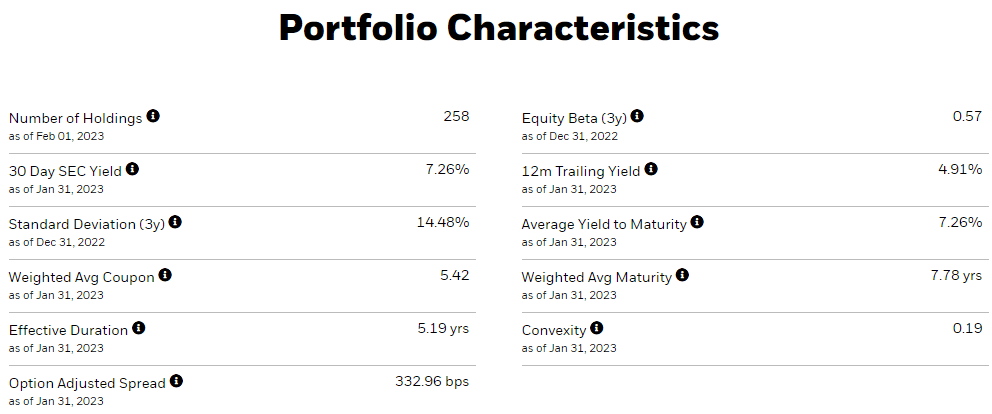
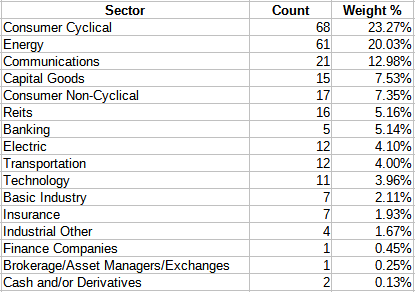
I will look at this data more later when comparing the ETFs. Breaking down the portfolio by maturity year gives us this:
ishares.com FALN maturity; compiled by Author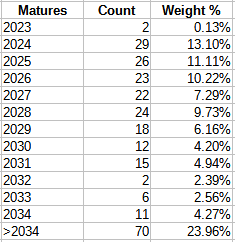
The next table shows the top issuers of the bonds held; some issuers have more than one bond in the portfolio.
ishares.com FALN issuers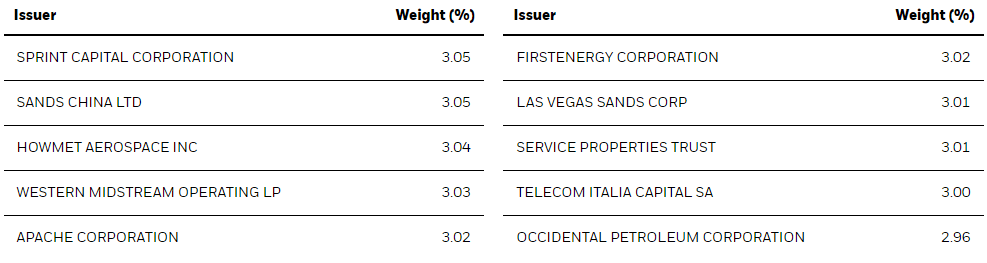
Top holdings
ishares.com FALN holdings; compiled by Author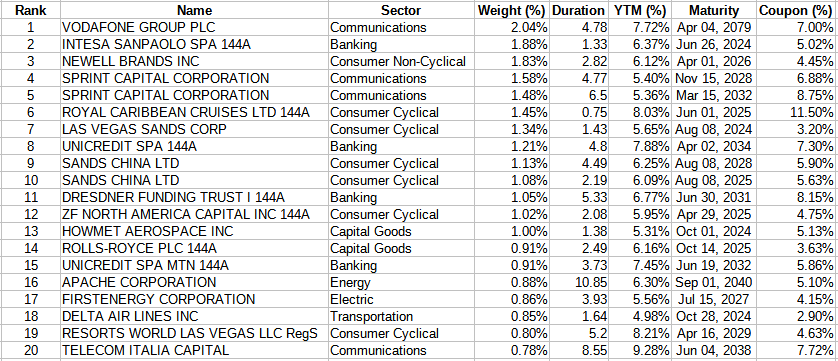
With about 260 bonds held, the Top 20 account for 24% of the portfolio; the bottom half slightly more at 26%. The three smallest positions are in Bed Bath & Beyond (BBBY) bonds: the company is about to file for bankruptcy. The portfolio is 84% in BBB-rate debt; 13% BB, and the rest lower rated. As noted, all bonds must be issued in USD to be eligible.
FALN distribution review
seekingalpha.com FALN DVDs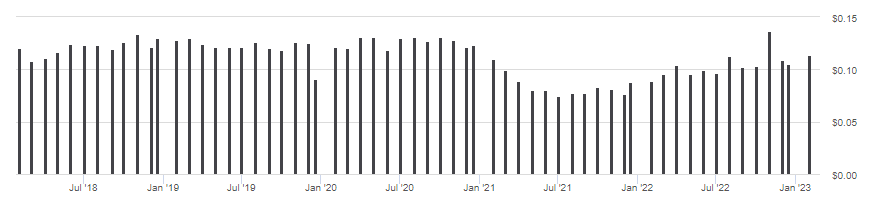
The size of the payout slightly follows the change in interest rates, but not closely by my estimate. Seeking Alpha shows a “C-” grade for dividends.
seekingalpha.com FALN scorecard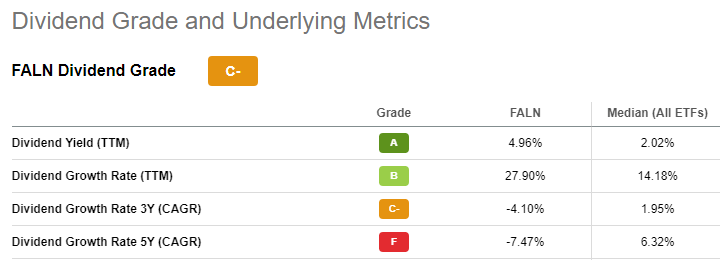
VanEck Vectors Fallen Angel High Yield Bond ETF review
Seeking Alpha describes this ETF as:
The VanEck Fallen Angel High Yield Bond ETF invests in below investment grade corporate bonds denominated in U.S. dollars but can be from a global issuer. ANGL invests based on the ICE US Fallen Angel High Yield 10% Constrained Index, which comprises bonds that were originally investment-grade when issued. ANGL started in 2012.
Source: seekingalpha.com ANGL
ANGL has $2.78b in AUM and has 35bps in fees, 10bps higher than FALN. The TTM yield is 4.59%, which is less than what FALN holders receive.
Index review
The ICE US Fallen Angel High Yield 10% Constrained Index tracks the performance of US dollar denominated below investment grade corporate debt publicly issued in the US domestic market and that were rated investment grade at the point of issuance.
Source: Theice
The same Methodology PDF provides these rules:
- Qualifying securities must have a below investment grade rating (based on an average of Moody’s, S&P and Fitch), at least 18 months to final maturity at the time of issuance, at least one year remaining term to final maturity as of the rebalancing date, a fixed coupon schedule and a minimum amount outstanding of $250 million.
- Qualifying securities must have risk exposure to countries that are members of the FX-G10, Western Europe or territories of the US and Western Europe. The FX-G10 includes all Euro members, the US, Japan, the UK, Canada, Australia, New Zealand, Switzerland, Norway and Sweden.
- Callable perpetual securities are included provided they are at least one year from the first call date. Fixed-to-floating rate securities are included provided they are callable within the fixed rate period and are at least one year from the last call prior to the date the bond transitions from a fixed to a floating rate security. Contingent capital securities (“cocos”) are excluded.
- Index constituents are market capitalization weighted, provided the total allocation to an individual issuer does not exceed 10%. Issuers that exceed the limit are reduced to 10% and the face value of each of their bonds is adjusted on a pro-rata basis. Similarly, the face values of bonds of all other issuers that fall below the 10% cap are increased on a pro-rata basis.
The Index Factsheet provides these overviews of the Index.
indices.theice.com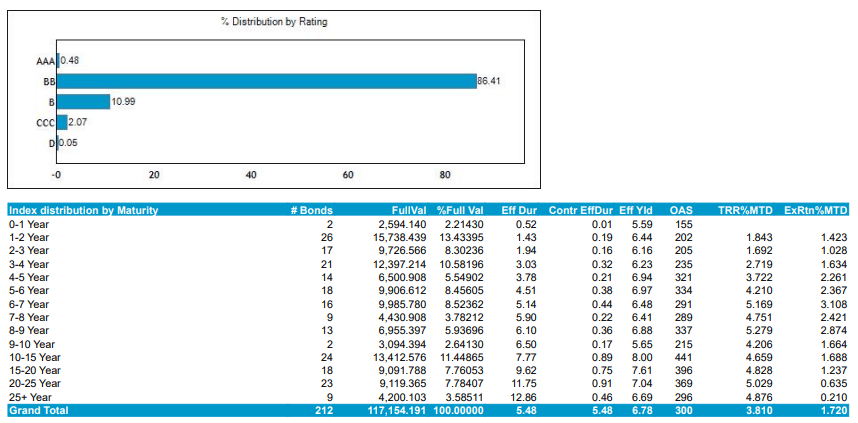
Industrial issuers are the vast majority (87%), with Financials and Utilities, with almost equal weights, comprising most of the rest.
ANGL holdings review
The manager provides more portfolio detail than the other ETF had, starting with the country allocations.
.vaneck.com ANGL,; compiled by Author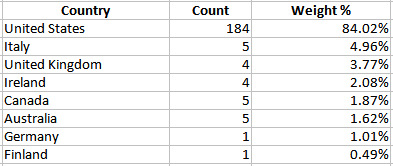
As with FALN, all bonds are in USDs. Next we have the sector allocations.
vaneck.com ANGL sectors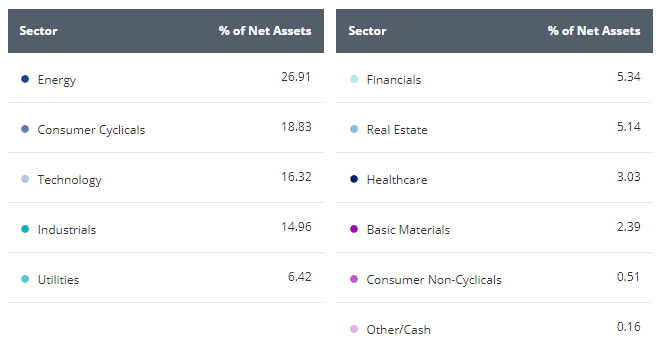
There is a finer breakdown of the ratings data too.
vaneck.com ANGL ratings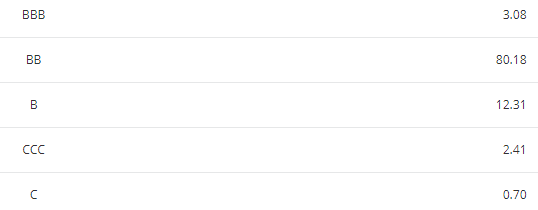
ANGL actually owns some investment-grade debt, which by rules, should be sold soon. The maturity schedule shows there is a decent percent maturing in the near future; opening up the possibility of reinvesting in higher coupon debt than those maturing.
vaneck.com ANGL maturity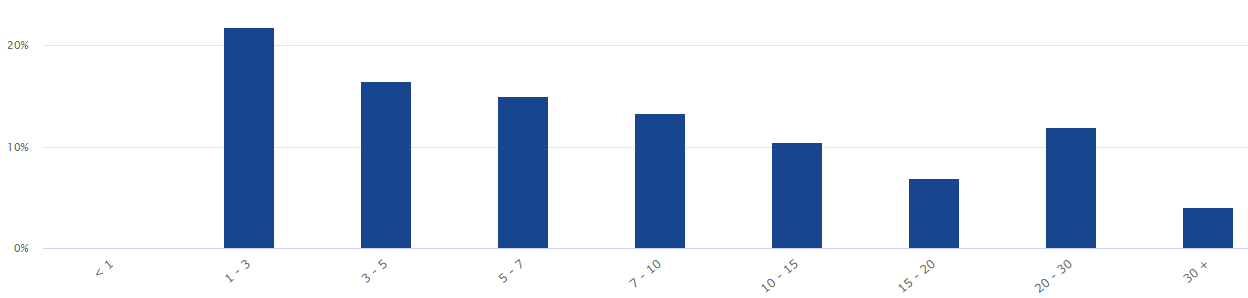
Top holdings
vaneck.com ANGL holdings; compiled by Author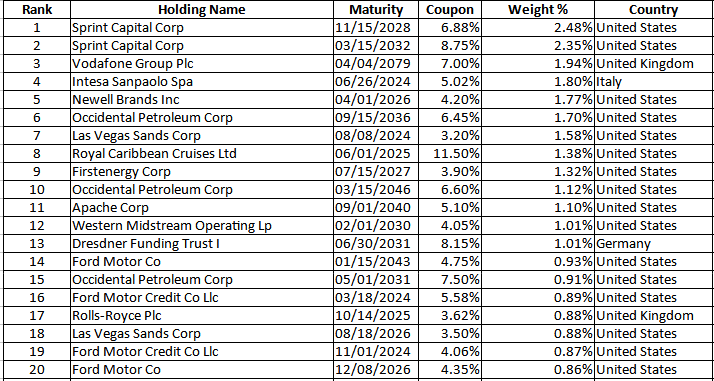
ANGL distribution review
seekingalpha.com ANGL DVDs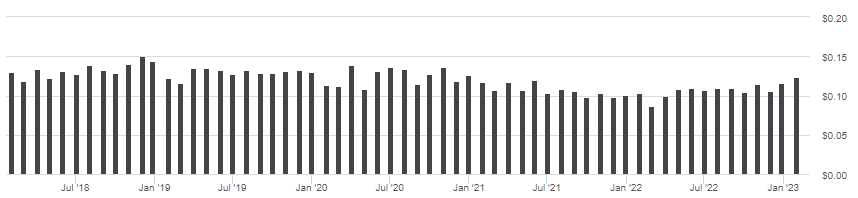
These payouts show even less correlation to interest rates than what I saw for FALN. Here I found the full dividend scorecard: ANGL gets a “C+” grade.
seekingalpha.com ANGL scorecard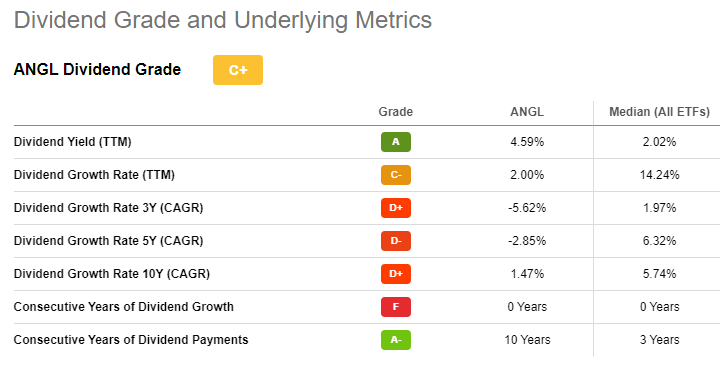
ETF comparison
I am including the iShares iBoxx $ High Yield Corporate Bond ETF (HYG) since invests in debt that started life below investment-grade.
Multiple webpages: compiled by Author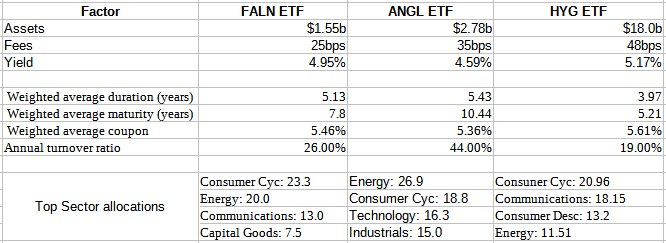
The HYG ETF has the shortest duration and maturity values which should have help recently but won’t when rates stop climbing and start down again. The 1-year and 3-month data seem to support that statement.
PortfolioVisualizer.com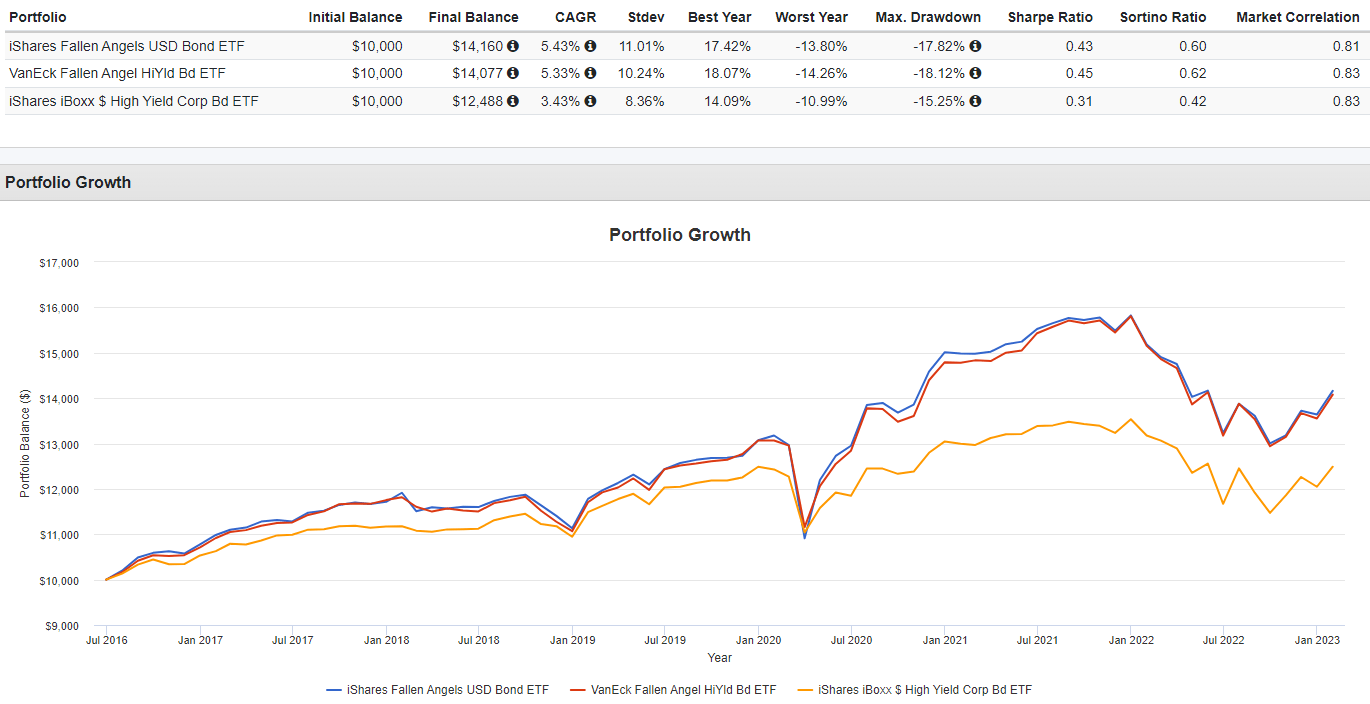
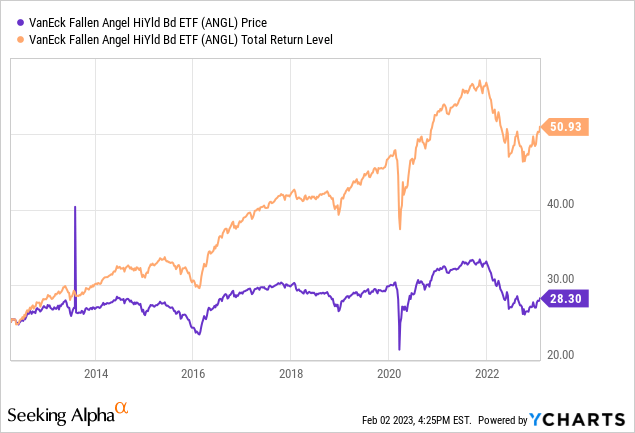
Since FALN started in the summer of 2016, the two Fallen Angel ETFs show a 98% correlations to each other, meaning investor’s risk should not change much by switching ETFs. The data also shows these ETFs outperforming the ETF that is allowed to own bonds that started life as “junk bonds”.
Seeking Alpha grades and ranks US ETFs on multiple factors, along with how various groups of people view each ETF.
seekingalpha.com FALN seekingalpha.com ANGL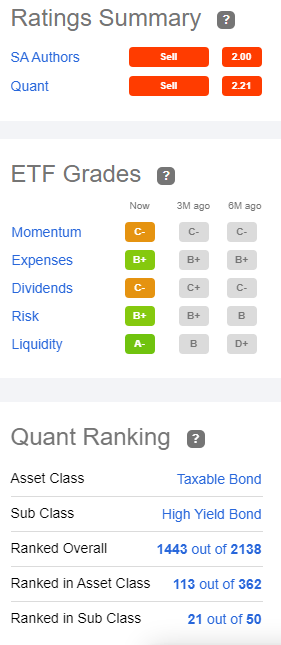
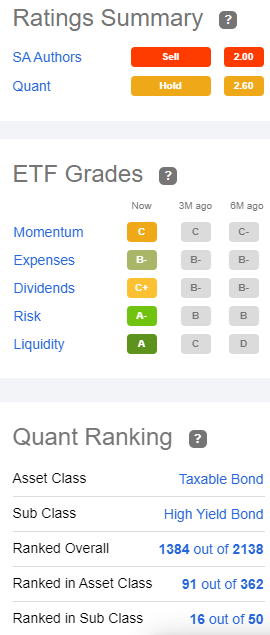
The Seeking Alpha Quant Rankings prefers ANGL over FALN. The HYG ETF ranks 40th in the same sub-class.
Portfolio strategy
I made the point of doing the swap now versus waiting until later in the year as most of the fall in price might have already occurred. Assuming the two ETFs stay highly correlated, the total profit/loss would remain the same regardless of when the trade was executed. The difference is the when the loss is claimable. Let me explain with this example. An investor has a $3000 loss in FALN. They sell and buy exactly the same number of shares in ANGL (for this example, I am assuming the prices are identical) for a cost of $10,000. They sell a year later at 10% gain and have $1000 in capital gains to report. In short, $3000 loss this year, $1000 gain next. Let’s say instead, the investor waited for the FOMC to stop rising rates. Both ETF prices have climbed 10% when the trade is executed and, like the first example, the new shares are sold next year. In this case, there is only a $2000 gain for this year, and no gain for next year. In both cases, the total investment loss is the same $2000.
For investors sitting on loss and need to offset potential gains that might occur in 2023 or later, swapping FALN for ANGL or vice versa. Holders of losing positions in HYG might consider the same trade, though to be extra safe from IRS “wash sale rules”, buy ANGL as the replacement: different managers.
Be the first to comment