

Pgiam/iStock via Getty Images
Investing Thesis
Desire to minimize loss or its potential from uncertainty of future developments makes the value of minimizing holding periods of exposure to risks a prime objective. The ability to compound gains accomplished by repeated reinvestment adds to the attractiveness of holding period brevity and makes the Odds for profitable experiences an equally important objective.
Forecasts of achievable prospects are essential; their time horizons need to be as short as possible.
The ability to recognize rewards of investing profits in excess of risk of capital loss is the basic measure of investing accomplishment. In today’s actively developing technologies, equity markets are far more likely to find rewards of capital gain as the best means of developing portfolio wealth accretion, not “income” orientations.
Primary Security Of Interest Here
The Direxion Daily Healthcare Bull 3X Shares ETF (NYSEARCA:CURE)
Fund Summary
“The fund invests at least 80% of its net assets in financial instruments, such as swap agreements, securities of the index, and ETFs that track the index and other financial instruments that provide daily leveraged exposure to the index or to ETFs that track the index. The index includes domestic companies from the healthcare sector, which includes: pharmaceuticals; health care equipment and supplies; health care providers and services; biotechnology; life sciences tools and services; and etc. It is non-diversified”
(Source: Yahoo Finance)
Coming Price Range Prospect
“A3-5 month prospect of ETF-share gains could reasonably range from $101, its present price, to $124 a gain of +22.5%, or to a breakeven of -0%.
The result of 26 positions like today’s in the 1261 past 5 year possible end of day positions was for average gains of +17.3% net of -0% average losses. The average worst price draw-down exposures during the 26 holding periods of 31 market days (6+ weeks) was -7.4%.
All 25 positions reached closure at a positive contribution to the +17.3% gain. On a 31 market-day measure the basis-points per day of 55.8 (just over 1/2% a day of the 252 market-day year) converts to a 266% yearly CAGR”
Source: blockdesk.com
Alternative Investments Compared
The investment selections most frequently visited by users of Yahoo Finance were added to by principal holdings of stocks in the subject’s ETF, and as a group against which to match CURE. Following the same analysis as with CURE, historic sampling of today’s Risk~Reward balances were taken for each of the alternative investments. They are mapped out in Figure 1.
Figure 1
blockdesk.com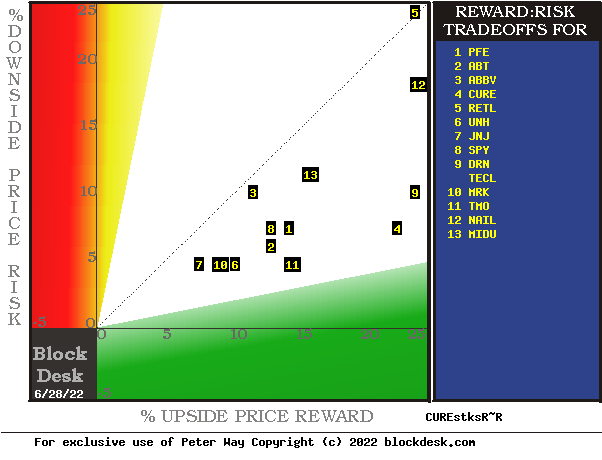
Expected rewards for these securities are the greatest gains from current closing market price seen worth protecting short positions. Their measure is on the horizontal green scale.
The risk dimension is of actual price drawdowns at their most extreme point while being held in previous pursuit of upside rewards similar to the ones currently being seen. They are measured on the red vertical scale.
Both scales are of percent change from zero to 25%. Any stock or ETF whose present risk exposure exceeds its reward prospect will be above the dotted diagonal line. Capital-gain attractive to-buy issues are in the directions down and to the right.
Our principal interest is in CURE at location [4], midway between locations [9 and 11]. A “market index” norm of reward~risk tradeoffs is offered by SPY at [8]. Most appealing (to own) by this Figure 1 view is CURE.
Comparing Features Of Alternative Investment Stocks
The Figure 1 map provides a good visual comparison of the two most important aspects of every equity investment in the short term. There are other aspects of comparison which this map sometimes does not communicate well, particularly when general market perspectives like those of SPY are involved. Where questions of ‘how likely’ are present other comparative tables, like Figure 2, may be useful.
Yellow highlighting of the table’s cells emphasizes factors important to securities valuations and the security CURE, most promising of near capital gain as ranked in column [R].
Figure 2
blockdesk.com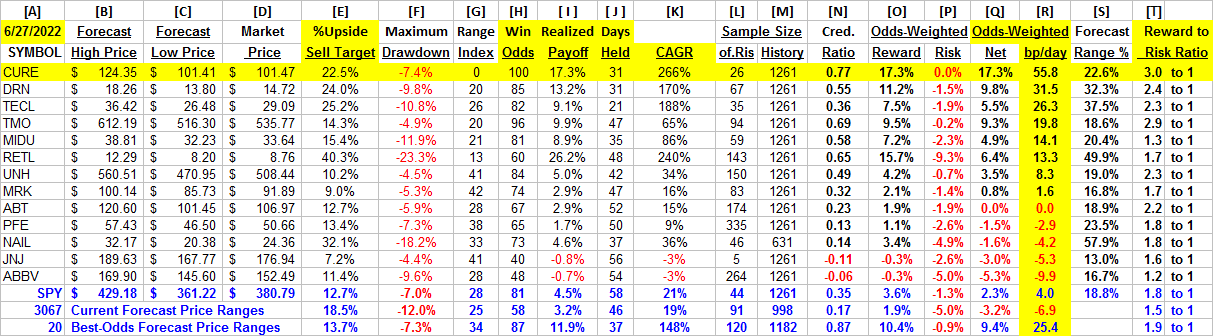
Why Do All This Math?
Figure 2’s purpose is to attempt universally comparable answers, stock by stock, of a) How BIG the prospective price gain payoff may be, b) how LIKELY the payoff will be a profitable experience, c) how SOON it may happen, and d) what price drawdown RISK may be encountered during its holding period.
Readers familiar with our analysis methods after a quick examination of Figure 2 may wish to skip to the next section viewing Price range forecast trends for CURE.
Column headers for Figure 2 define investment-choice preference elements for each row stock whose symbol appears at the left in column [A]. The elements are derived or calculated separately for each stock, based on the specifics of its situation and current-day MM price-range forecasts. Data in red numerals are negative, usually undesirable to “long” holding positions. Table cells with yellow fills are of data for the stocks of principal interest and of all issues at the ranking column, [R].
The price-range forecast limits of columns [B] and [C] get defined by MM hedging actions to protect firm capital required to be put at risk of price changes from volume trade orders placed by big-$ “institutional” clients.
[E] measures potential upside risks for MM short positions created to fill such orders, and reward potentials for the buy-side positions so created. Prior forecasts like the present provide a history of relevant price draw-down risks for buyers. The most severe ones actually encountered are in [F], during holding periods in effort to reach [E] gains. Those are where buyers are emotionally most likely to accept losses.
The Range Index [G] tells where today’s price lies relative to the MM community’s forecast of upper and lower limits of coming prices. Its numeric is the percentage proportion of the full low to high forecast seen below the current market price.
[H] tells what proportion of the [L] sample of prior like-balance forecasts have earned gains by either having price reach its [B] target or be above its [D] entry cost at the end of a 3-month max-patience holding period limit. [ I ] gives the net gains-losses of those [L] experiences.
What makes CURE most attractive in the group at this point in time is its basic strength of reward to risk ratio of 3.0 to 1 in [T].
Further, Reward~Risk tradeoffs involve using the [H] odds for gains with the 100 – H loss odds as weights for N-conditioned [E] and for [F], for a combined-return score [Q]. The typical position holding period [J] on [Q] provides a figure of merit [fom] ranking measure [R] useful in portfolio position preferencing. Figure 2 is row-ranked on [R] among alternative candidate securities, with CURE in top rank.
Along with the candidate-specific stocks these selection considerations are provided for the averages of some 3000 stocks for which MM price-range forecasts are available today, and 20 of the best-ranked (by fom) of those forecasts, as well as the forecast for S&P500 Index ETF (SPY) as an equity-market proxy.
Current-market index SPY is not competitive as an investment alternative with its Range Index of 24 indicates 3/4ths of its forecast range is to the upside, but little more than half of previous SPY forecasts at this range index produced profitable outcomes, with enough losers to put its average in negative result.
As shown in column [T] of figure 2, those levels vary significantly between stocks. What matters is the net gain between investment gains and losses actually achieved following the forecasts, shown in column [I]. The Win Odds of [H] tells what proportion of the Sample RIs of each stock were profitable. Odds below 80% often have proven to lack reliability.
Price Range Forecast Trends For CURE
Figure 3
blockdesk.com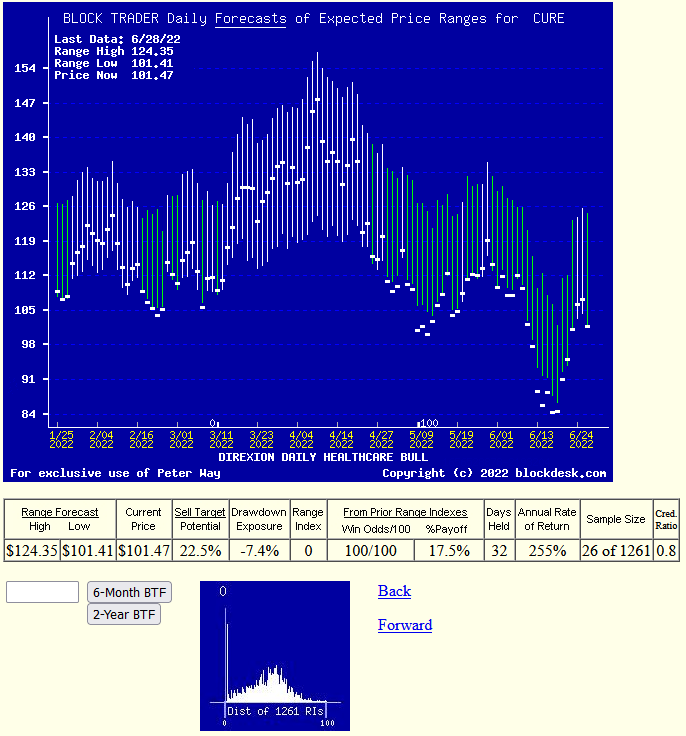
(used with permission)
No, this is not a “technical analysis chart” showing only historical data. It is a Behavioral Analysis picture of the Market-Making community’s actions in hedging investments of the subject. Those actions define expected price change limits, shown as vertical bars with a heavy dot at the closing price of the forecast’s date.
It is an actual picture of the expected future, not a hope of the recurrence of the past.
The special value of such pictures is their ability to immediately communicate the balance of expectation attitudes between optimism and pessimism. We quantify that balance by calculating what proportion of the price-range uncertainty lies to the downside, between the current market price and the lower expected limit, labeled the Range Index [RI].
Here the RI at zero indicates no further price decline is likely, but not guaranteed. The odds of 3 months passing without either reaching or exceeding the upper forecast limit or being at that time below the expected lower price (today’s) are quite slight.
The probability function of price changes for CURE is pictured by the lower Figure 3 (thumbnail) frequency distribution of the past 5 years of RI values, with the zero RI today indicated.
Conclusion
The multi-path valuations explored by the analysis covered in Figure 2 is rich testimony to the near-future value prospect advantage of a current investment in Direxion Daily Healthcare Bull 3x Shares ETF over and above the other compared alternative investment candidates.
Additional disclosure: Peter Way and generations of the Way Family are long-term providers of perspective information, earlier helping professional investors and now individual investors, discriminate between wealth-building opportunities in individual stocks and ETFs. We do not manage money for others outside of the family but do provide pro bono consulting for a limited number of not-for-profit organizations.
We firmly believe investors need to maintain skin in their game by actively initiating commitment choices of capital and time investments in their personal portfolios. So our information presents for D-I-Y investor guidance what the arguably best-informed professional investors are thinking. Their insights, revealed through their own self-protective hedging actions, tell what they believe is most likely to happen to the prices of specific issues in coming weeks and months. Evidences of how such prior forecasts have worked out are routinely provided, both on blockdesk.com and on our Seeking Alpha Contributor website.
Be the first to comment