GOLD PRICE FORECAST: GOLD SPIKES TO FRESH HIGH BUT GIVES BACK GAINS AMID STOCK MARKET SELLOFF
- Gold priced in USD eclipsed the $1,700 per ounce level overnight as global markets panic in response to growing coronavirus concerns and rising recession risk
- Spot gold seems pressured by need for cash amid the largest drawdown in the S&P 500 Index since 2008 that triggered a brief halt in trading
- XAU/USD might have potential to soon reach its all-time high near $1,900 with US Treasury yields hitting record lows and the FOMC likely to keep cutting rates
Gold price action hit a fresh high for the year as XAU/USD skyrocketed above $1,700 overnight – the precious metal’s highest reading since December 2012. Spot gold has since pulled back from its 2% intraday spike, however, and is currently trading around the $1,670 price level. I noted in this week’s gold price forecast that risk of a massive liquidity crunch and dash for cash could pressure the price of gold.
GOLD PRICE BOGGED DOWN BY INVESTOR NEED FOR CASH?
This morning’s jaw-dropping 7% plunge in the S&P 500 Index as US equity investors race to hit the sell button, which triggered a limit-down circuit breaker that halted trading on the NYSE for 15-minutes shortly after the open, could in part explain the retracement lower in spot gold.
Traders might have been offsetting stock market losses by unwinding long gold positions. There was almost $3 billion net-inflows into the SPDR S&P 500 ETF (ticker symbol: SPY) last week, perhaps driven by market participants attempting to ‘BTFD’ after an emergency Fed rate cut, but the move is being completely reversed so far today with $2.87 billion net-outflows.


Recommended by Rich Dvorak
Trading Forex News: The Strategy
Desperation for liquidity also seems to have been noticed by the FOMC this morning. The New York Fed announced earlier today that it is increasing the cap on its daily overnight repo operations limit from $100 billion to at least $150 billion. Additionally, two-week term repo offerings will be increased from $20 billion to $45 billion. With the Federal Reserve slashing benchmark interest rates and pumping liquidity into the financial system, gold price action looks like it has potential to resume its near-vertical ascent.
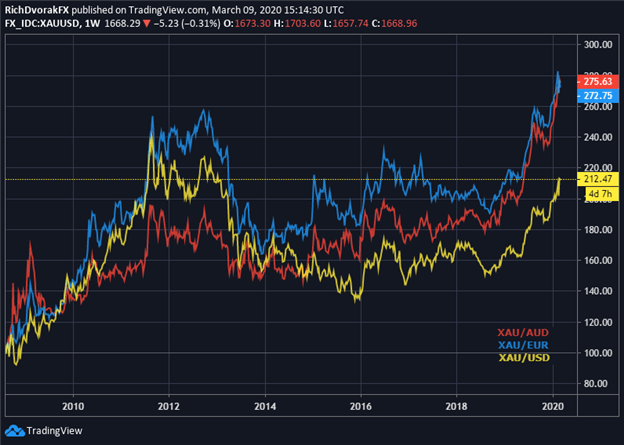
GOLD PRICE CHART: WEEKLY TIME FRAME (AUGUST 2008 TO MARCH 2020)

Chart created by @RichDvorakFX with TradingView
With gold already notching all-time highs priced in Euro (XAU/EUR) and the Australian Dollar (XAU/AUD), gold priced in US Dollars (XAU/USD) could stretch toward its record highs near $1,900 per ounce.


Recommended by Rich Dvorak
Learn the ins-and-outs of Forex Trading
This could be driven by Fed capitulation as the US central bank cuts interest rates to offset economic fallout from the growing coronavirus pandemic and rising recession risk.
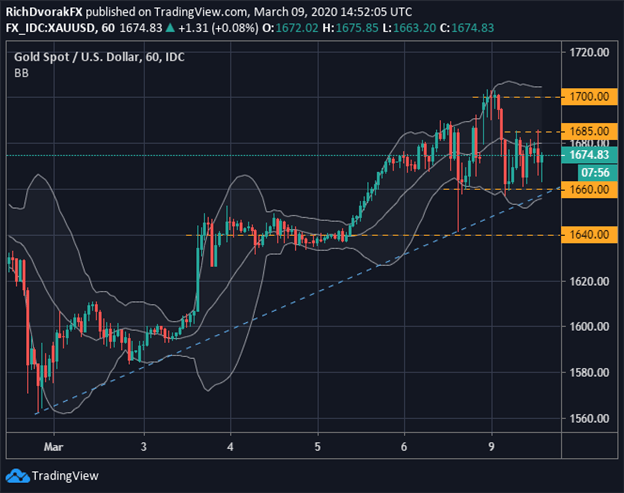
GOLD PRICE CHART: 1-HOUR TIME FRAME (FEBRUARY 28 TO MARCH 09, 2020)

Chart created by @RichDvorakFX with TradingView
The price of gold looks to have consolidated slightly above the $1,660 level with a notable series of higher lows since this morning’s bottom.
The broader month-to-date trendline of support could have potential to keep XAU/USD price action supported as well. If this area of confluence gives way, however, spot gold prices could edge lower toward the $1,640 area.
| Change in | Longs | Shorts | OI |
| Daily | 28% | -9% | 15% |
| Weekly | 0% | 6% | 1% |
Gold faces short-term technical resistance posed by $1,685 price, which might present an obstacle for XAU/USD before a retest of the psychologically-significant $1,700 zone comes into consideration.
GOLD PRICE CHART: WEEKLY TIME FRAME (AUGUST 2008 TO MARCH 2020)

Chart created by @RichDvorakFX with TradingView
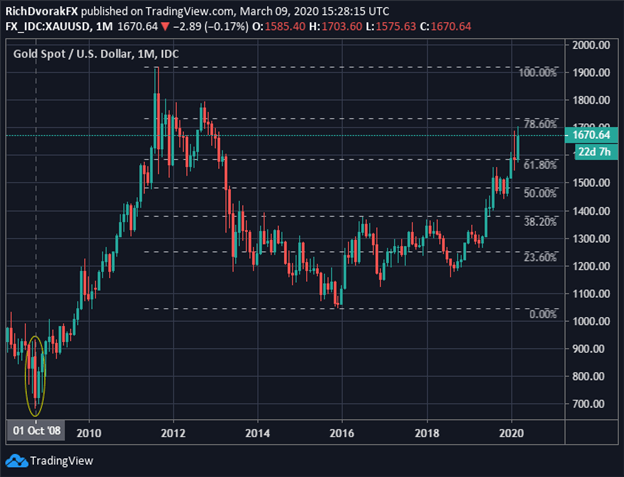
That said, a monthly gold chart highlights the 78.6% Fibonacci retracement level of the precious metal’s trading range since printing its all-time high in September 2011 slightly above the $1,900 mark, which could serve as another possible topside objective beyond the current year-to-date high.
Keep Reading: Gold Nears Record High as Yields Collapse & Volatility Rages
— Written by Rich Dvorak, Junior Analyst for DailyFX.com
Connect with @RichDvorakFX on Twitter for real-time market insight


Be the first to comment