

HeliRy
Introduction
Bermuda-based Frontline Ltd. (NYSE:FRO) reported its first-quarter 2022 results on May 24, 2022.
Important note: This article is an update of my article published on February 22, 2022. I have been following FRO on Seeking Alpha since 2015.
1 – 1Q22 results snapshot
Frontline reported a net income of $31.15 million, or $0.15 per diluted share for the first quarter of 2022, compared to $28.90 million or $0.15 per share in 1Q21. The Adjusted net loss was $1.61 million, or $0.01 per diluted share, for the first quarter of 2022.
Furthermore, Frontline reported total operating revenues of $217.44 million for the first quarter of 2022 compared to $193.99 million in 1Q21. Results were in line with analysts’ expectations.
FRO 1Q22 financial highlights Presentation (Frontline Presentation)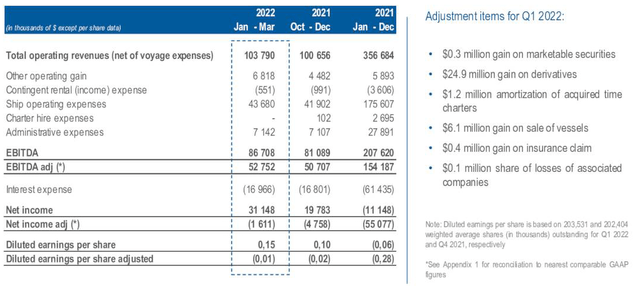
However, the most important news is, without a doubt, the private acquisition of 3.82% of Euronav (EURN) using Frontline’s common share, creating a more prominent tanker company.
2 – Fleet status after the Frontline Euronav potential merger
On June 6, 2022, Frontline announced it had completed the acquisition of 3.82% of Euronav.
announces that it has agreed to acquire in privately negotiated transactions with certain shareholders of Euronav N.V. (NYSE: EURN & Euronext: EURN) a total of 7,708,908 shares in Euronav, representing 3.82% of the outstanding shares in Euronav, in exchange for a total of 10,753,924 shares in Frontline, which is equivalent to 1.395 Frontline shares for every one share of Euronav.
Following completion of the issue of the new Frontline shares, Frontline will have a total of 222,622,889 shares issued and outstanding.
John Fredriksen (Hemen) owns nearly 15% of the combined companies. I noticed that the swap above had been completed at a slight discount to the merger agreement from 1.45 FRO to 1.395 FRO.
A reminder, on April 7, 2022, FRO and EURN indicated:
Have signed a term sheet that has been unanimously approved by their Board of Directors and Supervisory Board, respectively, on a potential stock-for-stock combination between the two companies, based on an exchange ratio of 1.45 FRO shares for every EURN share resulting in Euronav and Frontline shareholders owning approximately 59% and 41%, respectively, of the combined group. It is anticipated that Euronav will pay total dividends of up to 12 cents before the closing of the business combination with no impact on the exchange ratio.
Negotiations are still ongoing, and if the merger is completed, the new Frontline will own and operate a large and modern fleet that comprises 67 VLCC, 56 Suezmax vessels, and 18 LR2/Aframax vessels with a market cap of $4.2 billion.
One issue that could stall the merger is that the “Saverys family, which as the largest shareholder in Euronav has continued to oppose the deal, proposed an alternative merger with Compagnie Maritime Belge.”
The company indicated that the new relationship offers significant benefits from a more extensive combined fleet, leading to improved overall utilization and cost synergies. Also, the market cap of the new FRO would be almost 4 times larger than Scorpio Tankers Inc (STNG) at $1.2 billion and Hafnia Ltd (OTCPK:HFIAF) at $1.0 billion.
3 – Stock Performance
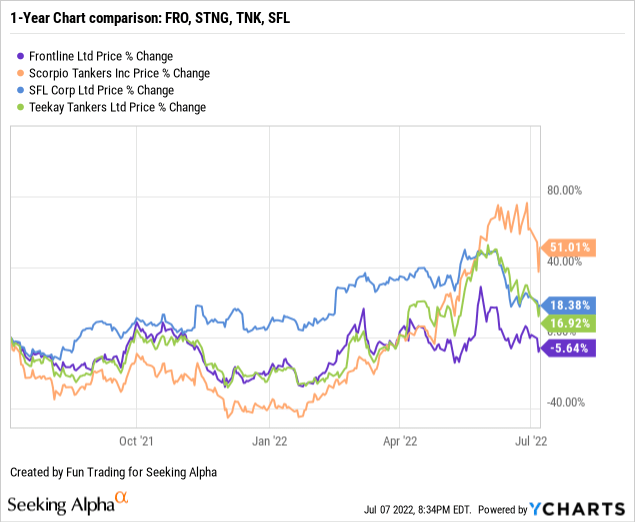
Frontline has underperformed its peers below and is now down 6% on a one-year basis.
Note: I recommend reading my recent article on SFL published on May 18, 2022, by clicking here. Also, my article on TNK was published on July 5, 2022.
4 – Investment thesis
Assuming that the merger between FRO and EURN is completed, the new Frontline will be considered a global leader in the oil tanker industry. Frontline and Euronav are part of John Fredriksen’s group, which already owns about 15% of the combined companies.
Frontline will be headed by Mr. Hugo De Stoop as the Chief Executive Officer and the Board of Directors of the combined group is expected to consist of seven members, including three current independent Euronav Supervisory Board members, two nominated by Hemen Holding Limited (“Hemen”) and two additional new independent directors
However, I do not see a significant change arising from such a large merger in terms of investment. As always, bigger doesn’t necessarily mean better.
The tanker market is highly volatile, and investing a considerable amount in this business is not a good idea. I consider FRO an excellent trading tool due to its high volatility.
FRO Tanker market Presentation 1Q22 (Frontline)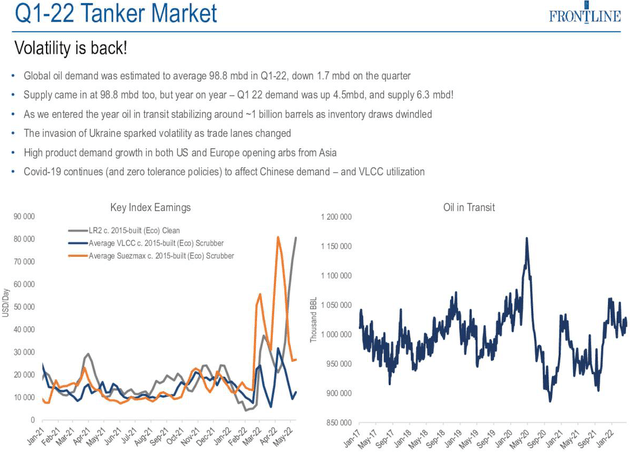
The stock has performed quite well recently, but the outlook for tanker rates has always been unpredictable. 2021 was the worst year in three decades, and after a slow start in 2022, the tankers industry experienced an unusual spike in spot tanker rates late in 1Q22.
This increase was driven primarily by the impact of the ongoing Ukraine conflict. The midsize tankers segment benefitted the most due to disruptions in oil trading patterns.
Thus, I continue to recommend primarily using FRO as a trading vehicle and keeping a minimal long-term position while waiting for a massive rebound in the sector. The idea is to keep a core position and trade short-term LIFO.
Lars Barstad – Interim Chief Executive Officer, said in the conference call:
We announced the proposed combination with Euronav early April, and we’ve since then been working diligently together to finalize and appropriate transaction structure for this combination.
Frontline Ltd. – The Raw Numbers: First-Quarter Of 2022 And Financials History
| FRO | 1Q21 | 2Q21 | 3Q21 | 4Q21 | 1Q22 FRO | 1Q22 EURN |
| Total Revenues in $ Million | 193.99 | 170.02 | 171.83 | 213.55 | 217.44 | 114.37 |
| Net Income in $ Million | 28.90 | -26.63 | -33.21 | 19.79 | 31.15 | -43.37 |
| EBITDA $ Million | 44.64 | -12.0 | -17.97 | 41.25 | 48.10 | 38.87 |
| EPS diluted in $/share | 0.15 | -0.13 | -0.17 | 0.10 | 0.15 | -0.22 |
| Operating cash flow in $ Million | 12.00 | 29.22 | -3.53 | 25.24 | 17.34 | -44.21 |
| CapEx in $ Million | 44.33 | 137.65 | 36.85 | 243.57 | 11.19 | 62.56 |
| Free Cash Flow in $ Million | -32.33 | -108.43 | -40.38 | -218.33 | 6.15 | -106.77 |
| Total cash $ Million | 154.13 | 143.03 | 124.95 | 115.51 | 113.88 | 169.58 |
| Long-term Debt in $ Million | 2,133.0 | 2,217.9 | 2,258.2 | 2,316.2 | 2,230.8 | 1,790.54 |
| Shares Outstanding (Diluted) in Million | 197.78 | 197.82 | 198.03 | 202.45 | 203.53/222.62* | 201.77 |
Source: Frontline material
* Following completion of the issue of the new Frontline shares after the acquisition of 3.82% of Euronav, Frontline will have a total of 222,622,889 shares issued and outstanding.
Note: More data are available to subscribers only.
Analysis: Total Operating Revenues, Earnings Details, Free Cash Flow
1 – Operating Revenues were $217.44 million in 1Q22
FRO Quarterly Revenue history (Fun Trading)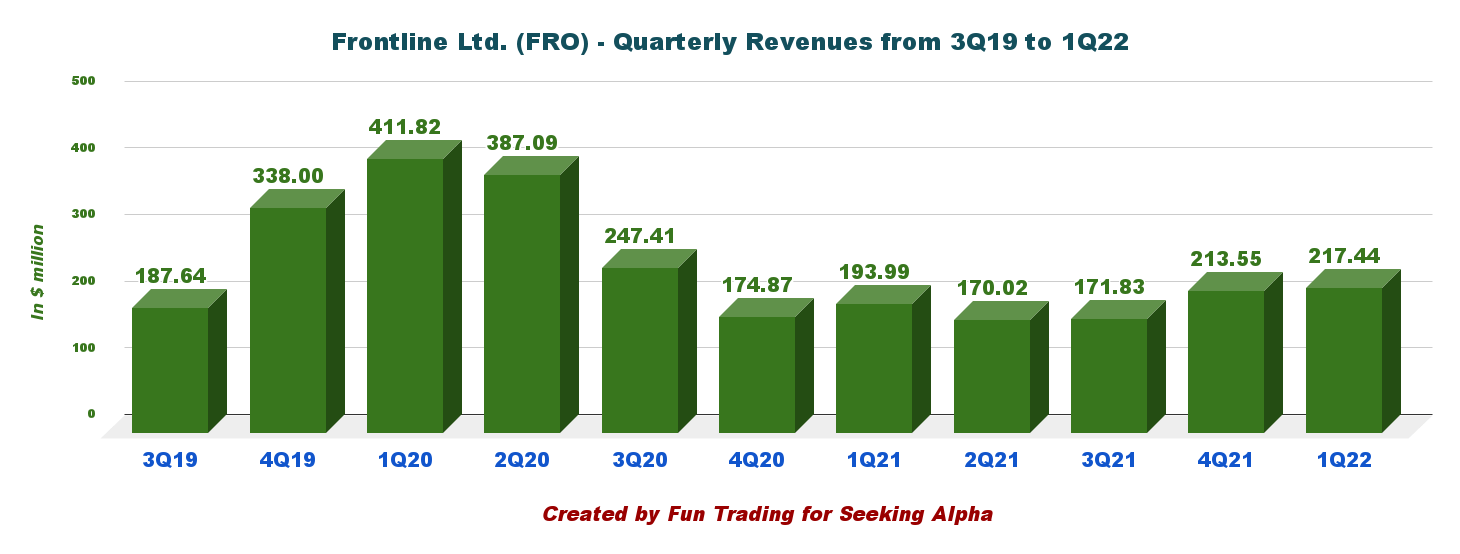
Frontline announced lower-than-expected revenues of $217.44 million for the first quarter of 2022 (see chart above).
The company posted a net income of $31.15 million, or $0.15 per diluted share, for the first quarter of 2022 and an adjusted net loss of $1.61 million, or $0.01 per diluted share. The decrease in adjusted net loss YoY was driven by an increase in time charter equivalent earnings due to the higher TCE rates in the quarter, partly offset by other movements in operating gains and expenses.
CEO Lars Barstad said in the conference call:
So far, in the first quarter of 2022, we booked 74% of our VLCC days at $22,600 per day. We booked 70% of our Suezmax days at $32,700 per day and 58% of our LR2/Aframax days at $46,300 per day. All numbers in this table are on the load to discharge basis as usual for Frontline.
2 – Free cash flow was $6.15 million in 1Q22
FRO Quarterly Free cash flow history (Fun Trading)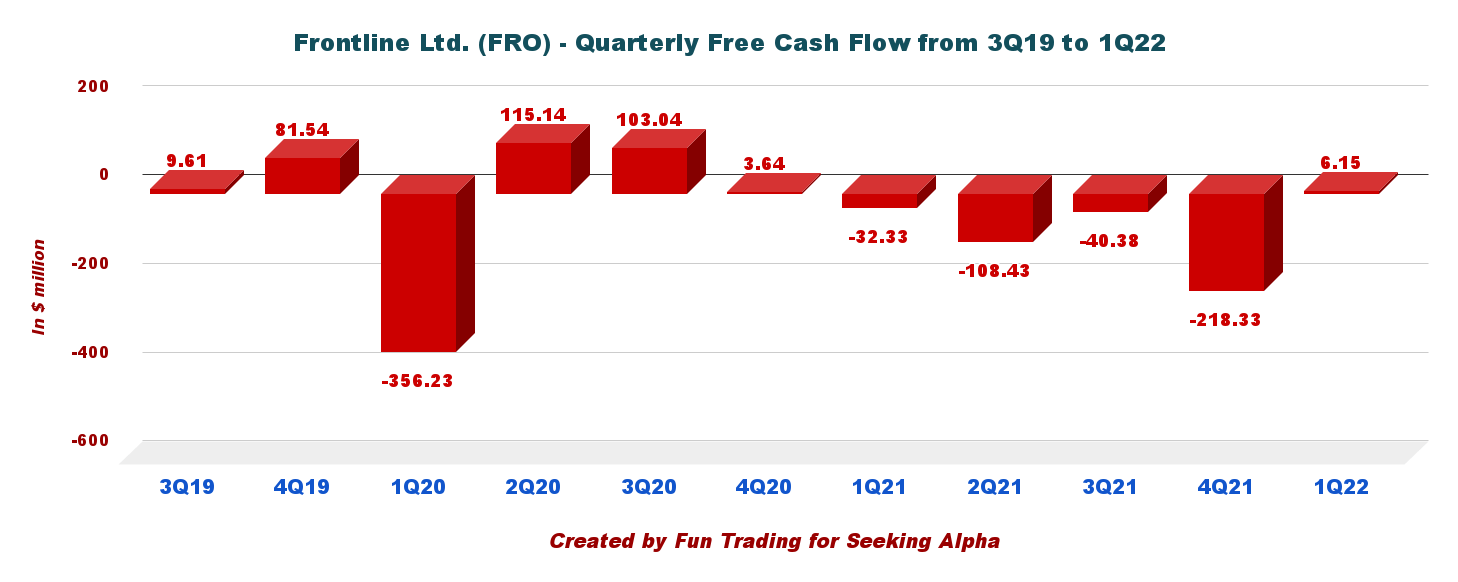
Note: Generic free cash flow is cash from operation minus CapEx
Trailing 12-month free cash flow is estimated at a loss of $360.99 million, with a gain of $6.15 million in 1Q22.
As a reminder, FRO stopped paying dividends starting in 3Q20.
3 – Debt analysis: Net debt is estimated at $2.12 billion in 1Q22 (consolidated and including current)
FRO Quarterly Cash versus Debt history (Fun Trading)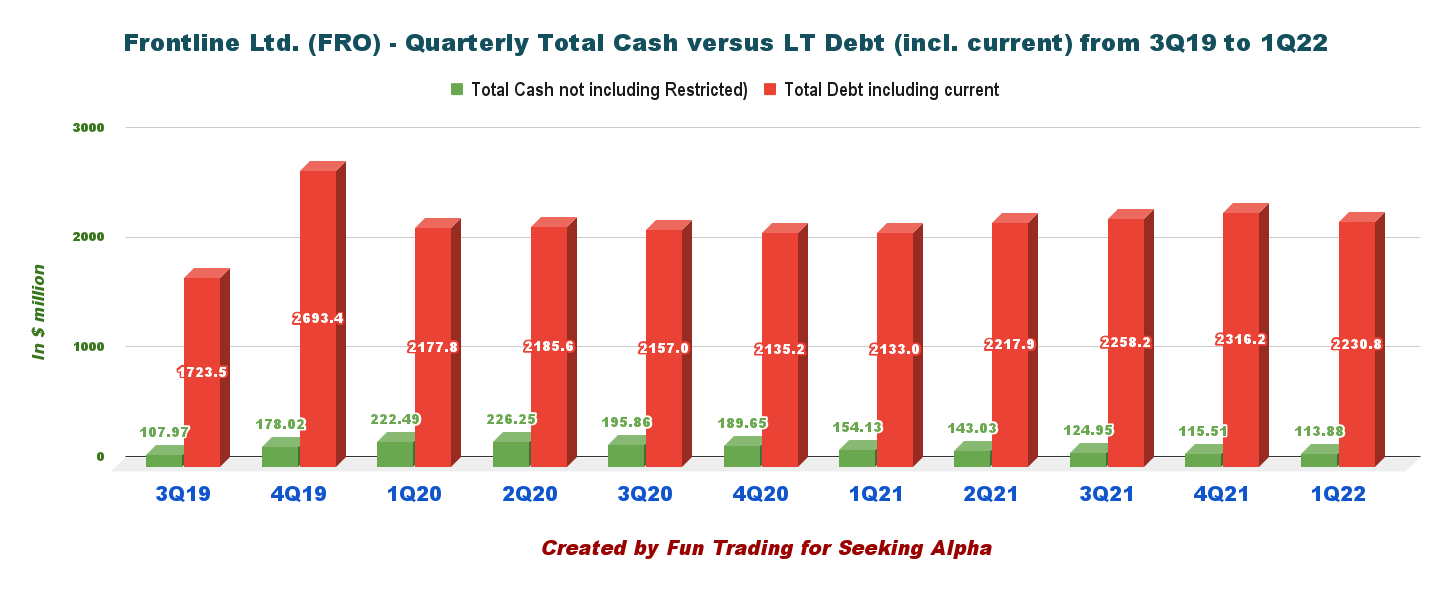
As of March 31, 2022, total cash was $113.88 million, and long-term debt, including current, was 2,230.8 million.
Technical Analysis And Commentary
FRO TA Chart short-term (Fun Trading)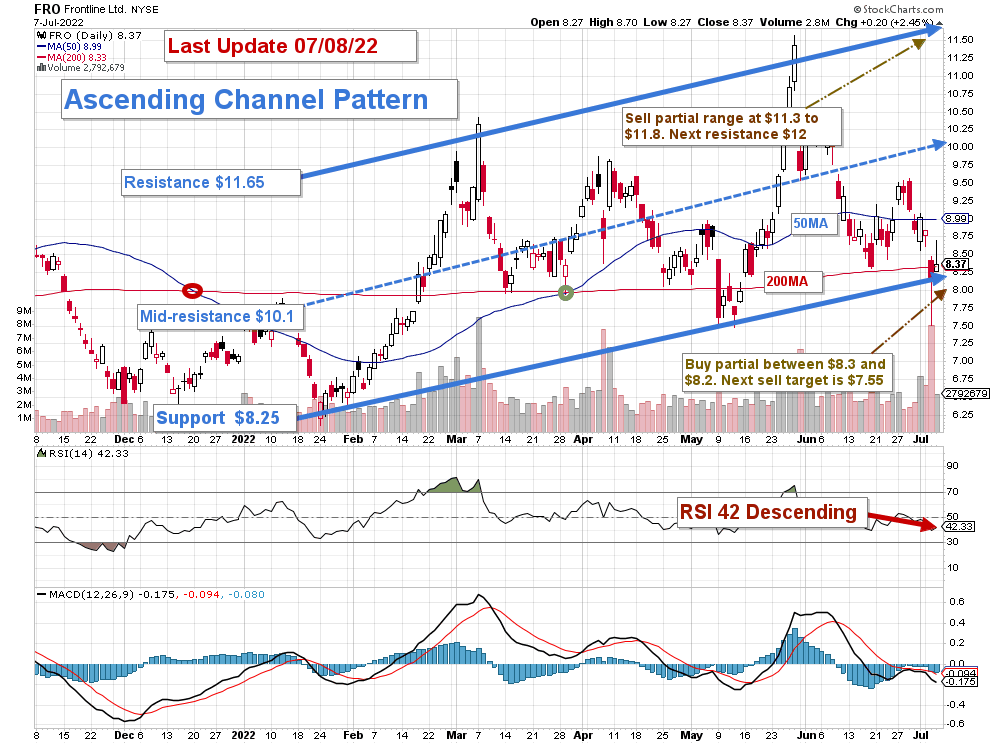
Note: The chart is adjusted from the dividend.
FRO forms an ascending channel pattern with resistance at $11.65 and support at $8.25.
The short-term trading strategy is to trade LIFO about 60%-70% of your position and keep a core long-term position for a much higher payday.
I suggest selling between $11.3 and $11.8 and waiting for a retracement between $8.3 and $8.2 with potential lower support at $7.65.
If the market turns bullish, FRO could break out and reach $12, but it is not likely at the moment.
Instead, the risk of entering a bear market rises due to stubborn record inflation and the tightening of the Fed. We may be heading toward a recession by the end of 2022, severely affecting the market and FRO. In this case, FRO could drop to $6.25 or even lower.
Hence, the priority is to build up a cash position and trade short-term LIFO until a clear trend emerges.
Note: The LIFO method is prohibited under International Financial Reporting Standards (IFRS), though it is permitted in the United States to generally accepted accounting principles (GAAP). Therefore, only US traders can apply this method. Those who cannot trade LIFO can use an alternative by setting two different accounts for the same stocks, one for the long term and one for short-term trading.
Warning: The TA chart must be updated frequently to be relevant. It is what I am doing in my stock tracker. The chart above has a possible validity of about a week. Remember, the TA chart is a tool only to help you adopt the right strategy. It is not a way to foresee the future. No one and nothing can.
Author’s note: If you find value in this article and would like to encourage such continued efforts, please click the “Like” button below as a vote of support. Thanks.
Be the first to comment