

Justin Sullivan/Getty Images News
Ford Motor Company (NYSE:F) just reported rapid growth in sales for August, with total sales up 48% vs. August 2021. While electric vehicles (“EVs”) were only 3.7% of the total number of vehicles sold, the company reported a growth rate of 310% vs. August of last year, largely due to the popularity of the F-150 Lightning. Ford’s new Bronco has also been selling at a brisk pace.
Ford’s March announcement that it would split into two separate divisions, with one focusing on EVs and the other on traditional internal combustion vehicles, has been met with broad support. EV companies trade at far higher valuations than traditional auto firms (Tesla’s (TSLA) forward P/E is 63 vs. F’s 7.3), and breaking out Ford’s EV business will highlight the developments and innovations that can help Ford to lead in this space.
Seeking Alpha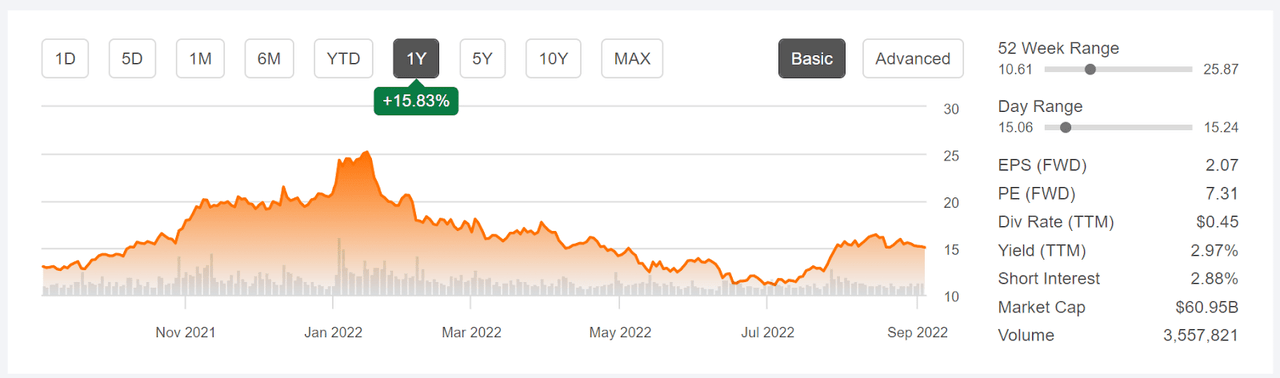
12-Month price history and basic statistics for Ford stock.
With low interest rates and Ford’s impressive new vehicle releases, F enjoyed a significant rally from the start of September 2021 to the middle of January 2022. Ford’s October announcement that it was reinstating the dividend also contributed to investor enthusiasm. Over an (approximately) 4 ½ month period from September 1, 2022 to January 12, 2022, F rose from $13 to $25, a gain of 92%. With concerns about a slowing economy, along with rising interest rates, investors pulled back. The company’s significant earnings miss for Q4 of 2021, reported on February 2nd, accelerated the sell-off. The shares have returned a total of -25.3% for the YTD vs. -27.7% for the auto industry as a whole (as tracked by Morningstar) and -16.9% for the S&P 500 (SPY).
ETrade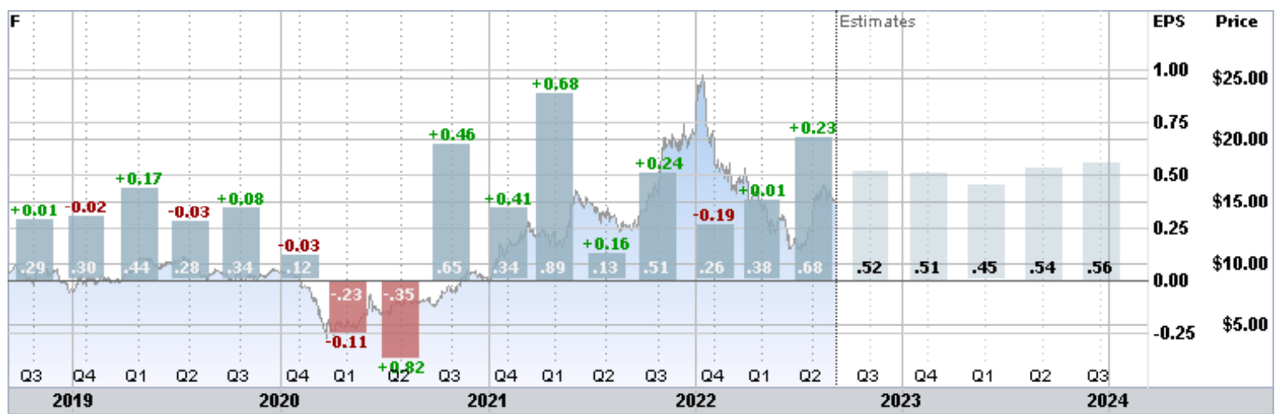
Historical (4 years) and estimated future quarterly EPS for F. Green (red) values are amounts by which EPS beat (missed) the consensus expected value (Source: ETrade)
Q2 earnings, reported on July 27th, were strong, with EPS beating expectations by more than 50% (expected quarterly EPS was $0.45 vs. actual EPS at $0.68). While the consensus outlook suggests that Q2 was an anomaly and the next year or two will have significantly lower earnings, it will not be surprising to see one or more substantial positive surprises due to the brisk sales of the F-150 Lightning and the Bronco.
I last wrote about Ford almost 6 months ago, on March 15, 2022, and I maintained a neutral/hold rating on the stock. At that time, the shares were trading at $15.73 and have since fallen 5.4% to reach the current level of $14.88. At that time, the Wall Street analyst consensus rating was neutral and the consensus 12-month price target was about 40% above the share price at that time. There was, however, substantial disagreement between the individual analysts, with the highest price target at more than 2.5X the lowest. High dispersion among the analyst price targets reduces the predictive value of the consensus. The outlook expressed by the prices of call and put options on Ford, the market-implied outlook, was bearish. I compromised between the bullish analyst consensus and the bearish market-implied outlook by maintaining a hold rating.
For readers who are unfamiliar with the market-implied outlook, a brief explanation is needed. The price of an option on a stock is largely determined by the market’s consensus estimate of the probability that the stock price will rise above (call option) or fall below (put option) a specific level (the option strike price) between now and when the option expires. By analyzing the prices of call and put options at a range of strike prices, all with the same expiration date, it is possible to calculate a probabilistic price forecast that reconciles the options prices. This is the market-implied outlook. For a deeper explanation and background, I recommend this monograph published by the CFA Institute.
I have calculated updated market-implied outlooks for F and I have compared these with the current Wall Street consensus outlook in revisiting my rating.
Wall Street Consensus Outlook for F
ETrade calculates the Wall Street consensus outlook for F by combining the views of 15 ranked analysts who have published ratings and price targets during the last 3 months. The consensus rating is neutral/hold and the consensus 12-month price target is $15.56, 3.5% above the current share price. The consensus price target has fallen dramatically from the value in May, $23.13. As in May, the spread among the individual price targets is large, with the highest being 2.3X the lowest. As a rule of thumb, I largely discount the Wall Street consensus price target when this ratio exceeds 2 because the forward-looking value of the consensus diminishes with increasing dispersion in individual analyst price targets.
ETrade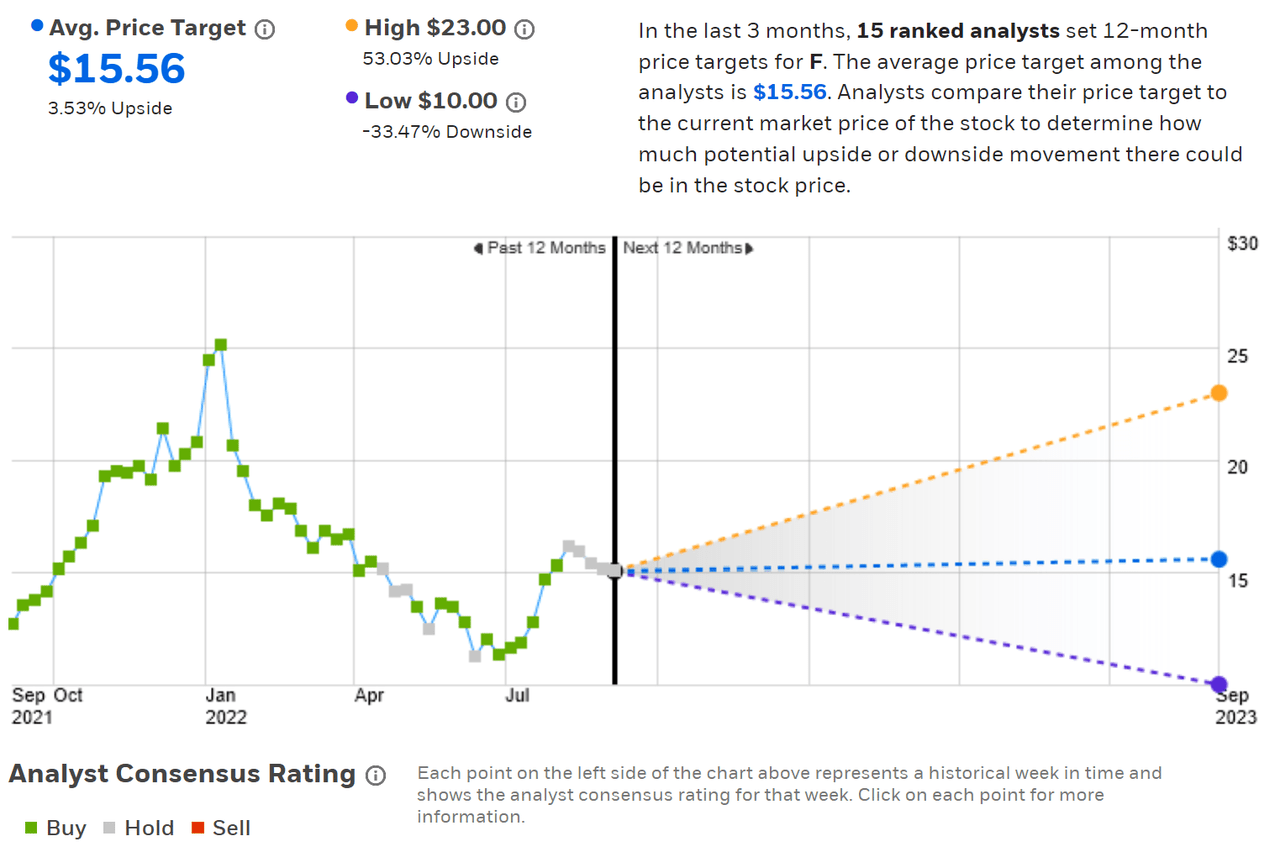
Wall Street analyst consensus rating and 12-month price target for F (Source: ETrade)
Seeking Alpha’s version of the Wall Street consensus outlook is constructed using price targets and ratings from 23 analysts who have published their views over the past 90 days. The consensus rating is bullish and the consensus 12-month price target is $17.20, 14.4% above the current share price.
Seeking Alpha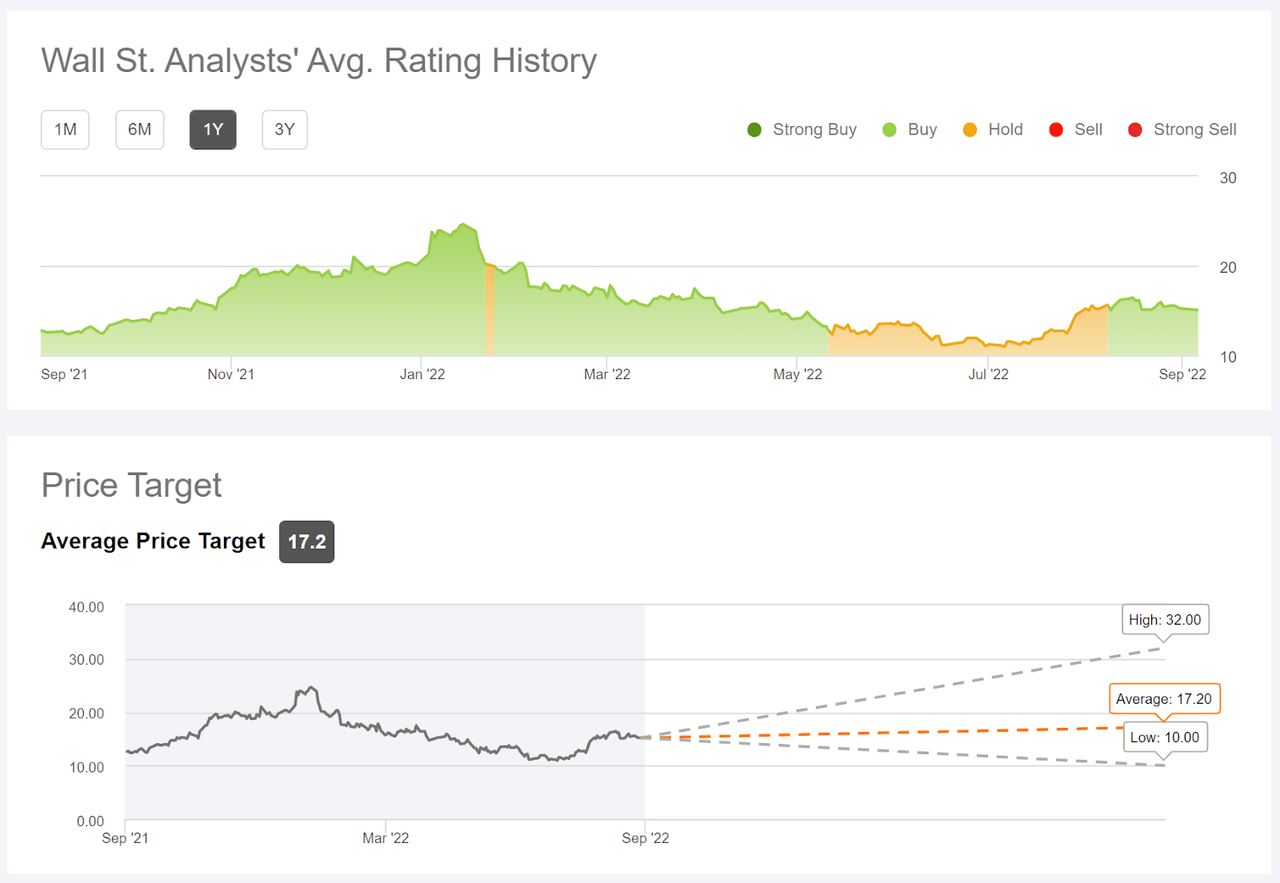
Wall Street analyst consensus rating and 12-month price target for F (Source: Seeking Alpha)
It is fairly unusual to find such a large difference between calculations of the Wall Street consensus. ETrade has the consensus rating at a hold, with an expected 12-month total return (including dividends) of 6.5%. Seeking Alpha has the consensus rating at a buy, with an expected 12-month return of 17.4%. This disagreement, due to the specific selection of analysts surveyed, highlights the lack of agreement.
Market-Implied Outlook for F
I have calculated the market-implied outlook for F for the 4.4-month period from now until January 20, 2023 and for the 9.3-month period from now until June 16, 2023, using the prices of put and call options that expire on each of these two dates. I selected these specific dates to provide a view to early- and to mid-2023, as well as because these options tend to be among the most liquid.
The standard presentation of the market-implied outlook is a probability distribution of price return, with probability on the vertical axis and return on the horizontal.
Geoff Considine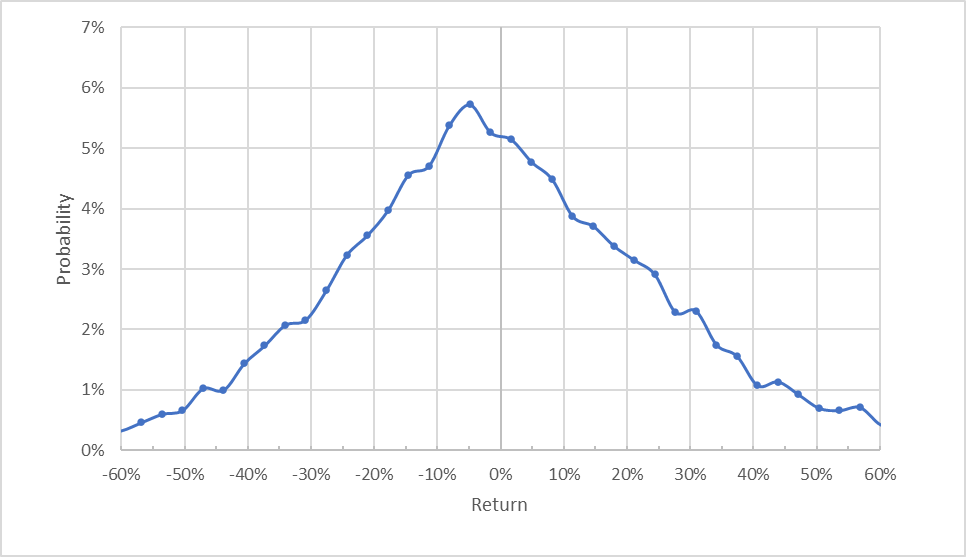
Market-implied price return probabilities for F for the 4.4-month period from now until January 20, 2023 (Source: Author’s calculations using options quotes from ETrade).
The market-implied outlook is generally symmetric, although the peak in probability is slightly shifted to favor negative returns. The maximum probability corresponds to a price return of -5% for this 4.4-month period. The expected volatility calculated from the distribution is 48% (annualized).
To make it easier to compare the relative probabilities of positive and negative returns, I rotate the negative return side of the distribution about the vertical axis (see chart below).
Geoff Considine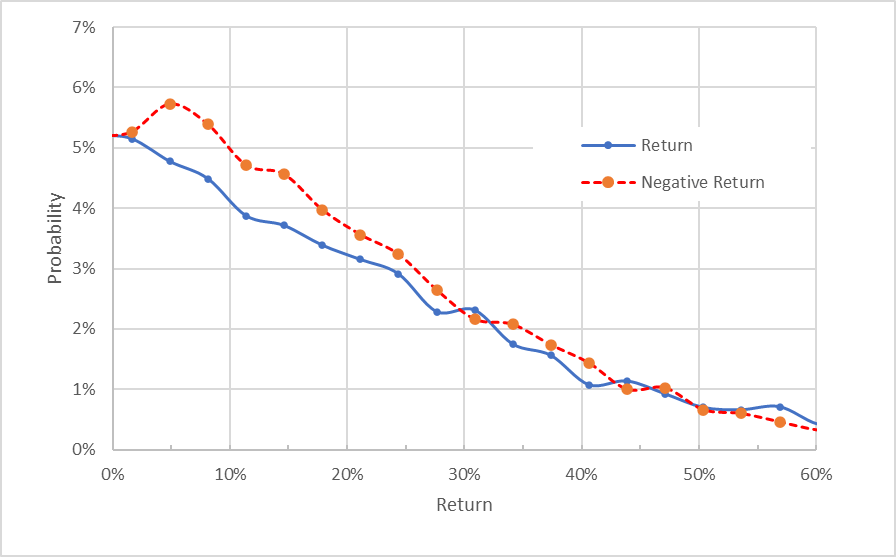
Market-implied price return probabilities for F for the 4.4-month period from now until January 20, 2023. The negative return side of the distribution has been rotated about the vertical axis (Source: Author’s calculations using options quotes from ETrade).
This view shows that the probabilities of negative returns are higher than the probabilities of positive returns of the same magnitude, across a wide range of the most-probable outcomes (the dashed red line is consistently above the solid blue line over the left ½ of the chart above). This is a bearish tilt in the market-implied outlook.
Theory indicates that the market-implied outlook is expected to have a negative bias because investors, in aggregate, are risk averse and thus tend to pay more than fair value for downside protection. There is no way to measure the magnitude of this bias, or whether it is even present, however. With the expectation of a negative bias, I interpret this market-implied outlook as predominantly neutral, with a bearish tilt.
The market-implied outlook for the 9.3-month period from now until June 16, 2023 is more bearish, with a larger spread in probabilities favoring negative returns (the dashed red line is notable above the solid blue line over the left ⅔ of the chart below). The maximum probability corresponds to a price return of -18% over this 9.3-month period. The expected volatility calculated from this distribution is 47% (annualized). Even with the expected negative bias, I interpret this market-implied outlook as bearish.
Geoff Considine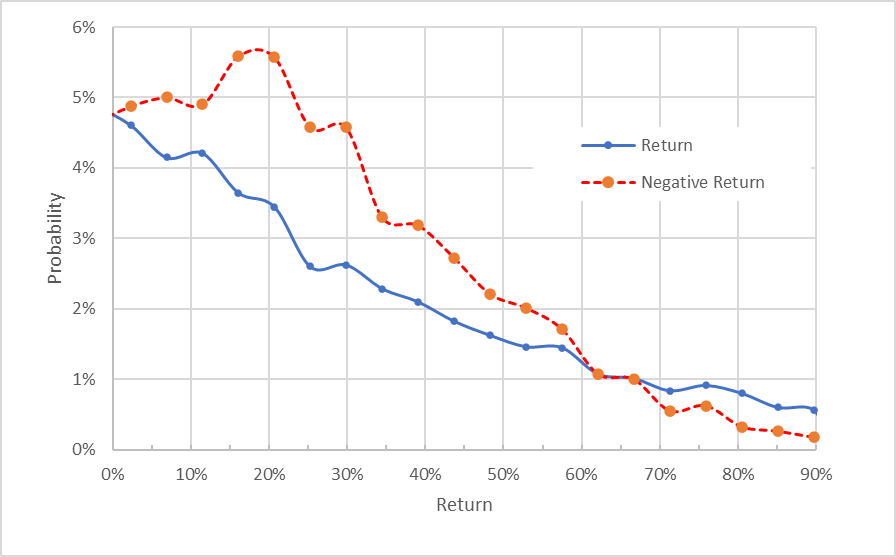
Market-implied price return probabilities for F for the 9.3-month period from now until June 16, 2023. The negative return side of the distribution has been rotated about the vertical axis (Source: Author’s calculations using options quotes from ETrade).
The market-implied outlook for F shifts from neutral, with a bearish tilt, over the next 4.4 months to bearish over the next 9.3 months. The expected volatility is stable at 47% to 48% to the middle of 2023.
Summary
Ford is making substantial steps to position the company to thrive with the growth in the EV market while also maintaining a dominant position as a manufacturer of internal combustion engine (ICE) vehicles. The robust earnings growth, emerging from a period of pent-up demand, along with the positive reception of a number of new models, boosted earnings.
Looking ahead, with higher interest rates and the broad expectation of an economic slowdown, Ford’s growth is expected to slow. The Wall Street consensus price target for F has declined substantially in recent months. There is enough disagreement in projecting future earnings that versions of the Wall Street consensus outlook look quite different because of the specific populations of analysts included. ETrade’s version of the Wall Street consensus rating is a hold, with a consensus price target that implies a total return of 6.5%. Seeking Alpha’s version of the Wall Street consensus rating is a buy, with expected 12-month total return of 17.4%.
As a rule of thumb for a buy rating, I want to see an expected return that is at least ½ the expected annualized volatility. With expected volatility of 48%, even the highest of these two Wall Street consensus price targets is below this threshold. The market-implied outlook is neutral with a bearish tilt to mid-January of 2023 and bearish to the middle of 2023. I am maintaining my neutral/hold rating on Ford.
Be the first to comment