Source: IG
Main USD/MXN Talking Points:
- The US Dollar cements its performance against emerging market currencies as COVID-19 takes its toll
- USD/MXN pushes past 20 reaching a new high since December 2018
Another week of heightened volatility comes to an end and the USD/MXN continues to push higher, but not without a step-back at the beginning of the week. The US Dollar has been steadily losing ground against G10 currencies as an unexpected 50 bps rate cut from the Fed caused investors to flee towards treasuries, causing bond yields to fall to all time lows. With the 10-year treasury yield below 0.7% for the first time ever, the EUR/USD has surpassed the 1.13 handle for the first time since July 2019.
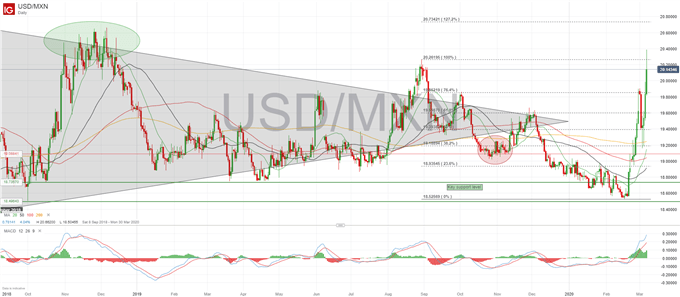
But risk-aversion has continued to boost the dollar against emerging market currencies after a period of relative stability had seen EMFX push higher before the COVID-19 outbreak took place. Looking at USD/MXN, if there was any doubt about the end of the two-month rally in the Peso at the end of last week, there definitely isn’t any now. The pair slipped slightly on Monday, back below 19.50 as risk assets rallied, but the last 4 days have seen continuous upside gain, pushing past 20 pesos per dollar, and hitting a new high since December 2018.
The case for the Peso remains mostly unchanged from before the outbreak, fundamentals are weak, but its inflation-adjusted carry trade value keeps it attractive. If it weren’t for the current flight to safety, USD/MXN would have probably pushed below 18.50 by now. Markets are showing an increased probability that Banxico will continue to cut rates in the near future, up to 125 basis points until the end of 2020, following on from its 5 consecutive rate cuts up until last month.
One could argue that its stellar performance towards the end of 2019 has given the Mexican Peso enough wiggle room compared to other emerging market currencies, it being considered one of the favourite EMFX for traders, despite its economy bordering a recession.
USD/MXN FORECAST AND ANALYSIS
The push above 20.26 has seen USD/MXN clear its 2019 highs, but the pair has found short-term resistance around that level. The confirmation of a false downside breakout of the 2017 symmetrical triangle has cemented the case for the pair to head higher in the coming weeks, clearing major resistance levels as it soared past the 20 handle.
USD/MXN DAILY PRICE CHART (SEPTEMBER 2018 – MARCH 2020)
A close above the 2020 highs will see the next price target at 20.53, bordering the fake breakout of the triangle seen in December 2018. If the price action turns negative, a close below 19.85, the 76.4% Fibonacci retracement level could give way to further selling pressure. An analyst forecast conducted by Bloomberg shows there is a 72% probability that USD/MXN will be between 19.52 and 21.04 in a weeks’ time.
— Written by Daniela Sabin Hathorn, Junior Analyst
Follow Daniela on Twitter @HathornSabin


Be the first to comment