

FatCamera/E+ via Getty Images
Investment Summary
We remain neutral on Zynex, Inc (NASDAQ:ZYXI) shares and note our thesis is unchanged on the stock from December 2020. We have previously covered ZYXI in detail and highlighted the impeding operational issues we envisioned looking ahead. Fast forward to the present day, and much of the narrative remains unchanged, by our estimation. Here we demonstrate a number of market, fundamental and valuation factors that plague the investment case, outweighing factors that balance the risk/reward calculus. We rate shares neutral with a price target of $5.35.
Exhibit 1. ZYXI 6-month price action
Data: Updata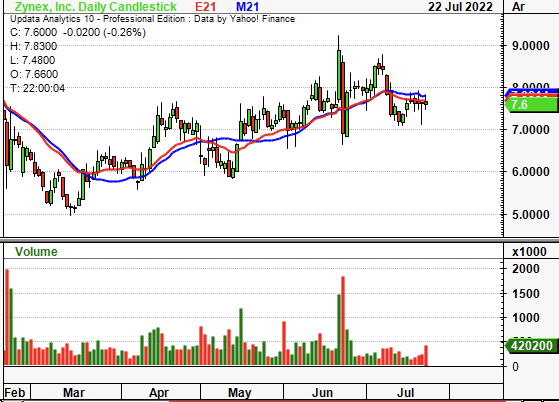
Market Factors
Investors have wound back equity duration right back in FY22 and the high-beta/growth trade has now exhausted itself. The market’s overexposure to sloppy fundamentals looks to be finally being dealt with. Alas, it’s been low-beta, high quality plays that have agreed with investors the most this year. As such, investors have been reducing equity correlation and shifting focus onto idiosyncratic risk premia.
In that vein, we see ZYXI fall behind against the wider market. The ZYXI share price is down ~6% since March but had been losing strength relative to the benchmark since mid-FY21. At the same time, its covariance structure has shifted upwards, as seen in Exhibit 2. These are undesirable characteristics looking ahead as we are seeking to reduce correlation to the benchmark.
Exhibit 2. ZYXI covariance structure shifting upwards as investors step up in quality and liquidity
Data: Updata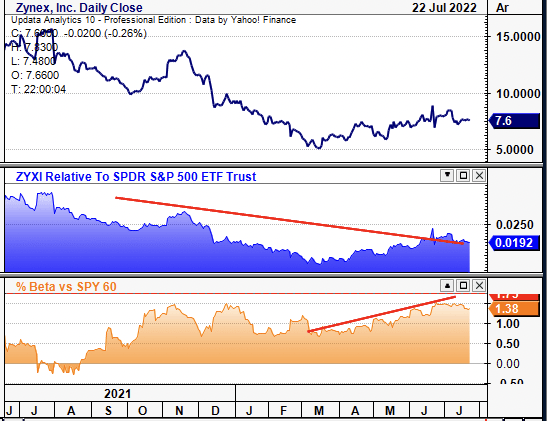
On the other hand, ZYXI has also been gaining in relative strength against the medical devices and health care equipment sector since May. It bounced off a bottom of $5.90 and gathered support, as seen below. This is important, as US medtech has caught a bid in July and is up 221bps MoM on last check. Hence, the stock is gaining against a strengthening sector and this could be a bullish indicator.
However, we need to determine if investors are rewarding the stock for idiosyncratic risk premia, versus how much of the return is just beta (to the sector). As seen in Exhibit 3, whilst the stock price and relative strength to the sector have curled up since March, so too has ZYXI’s beta to the sector. Hence, this leads us to believe the market hasn’t identified an alpha opportunity here, and the stock is gaining on the back of sector strengths.
Exhibit 3. ZYXI has gained in relative strength vs. medical devices, However, this looks to be as a result of up-shifting beta to the sector versus a result of company-specific drivers
Data: Updata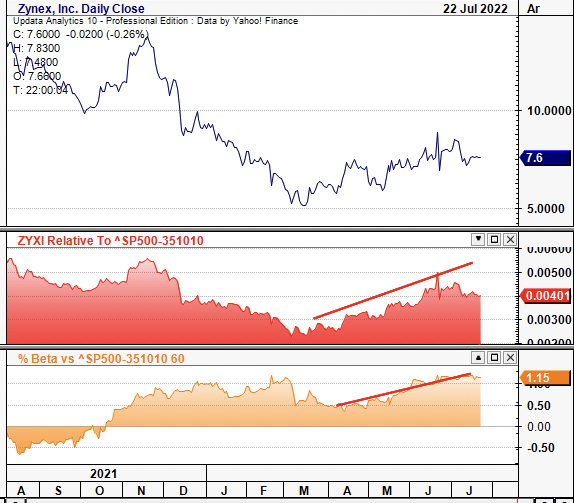
As a result, momentum at the market level appears unsupportive of budgeting equity risk, and this must be considered into the investment debate.
Fundamental Factors
Top-line performance continues to be a standout for the company. ZYXI printed a record 10% YoY growth in orders in its Q2 earnings pre-announcement. This is up 19% sequentially. For Q1, revenue came in at ~$30 million, ~30% gain YoY. Turnover all stemmed from its pain management segment. It recently branched into haemodynamic monitoring, acquiring Kestral Labs in FY21. It is also awaiting FDA clearance for its CM1600 wireless blood and fluid monitor after submissions in FY21.
Sales have grown sequentially since FY15 at a hefty pace and this has pulled through to gross profit each quarter. Despite this, quarterly operating margins have normalized at 20% since FY18, having narrowed in substantially from a peak of ~35% in Q3 FY18 to just 6.1% in the last print. This sees net margins normalize at ~18% for the 3-year period to date, however, come in to average just 11% since pandemic. It did reaffirm FY22 guidance in its earnings pre-announcement, but the market’s response was negligible. This suggests much of the upside may already be priced in.
Exhibit 4.
Data: HB Insights, Refinitiv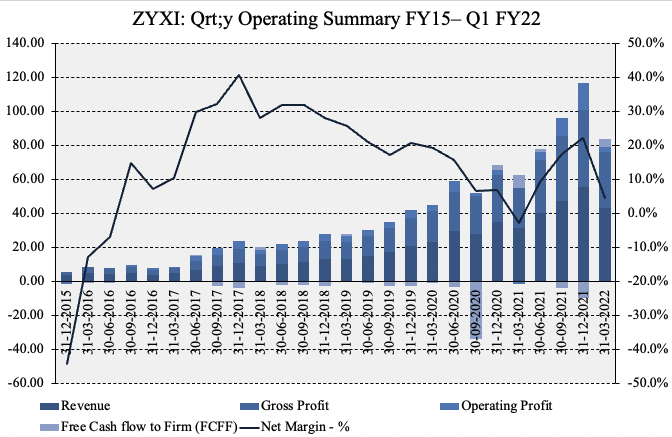
Our previous critique of ZYXI pointed to inventory management. It is our estimation, backed by data found in our previous ZYXI analyses here and here. Indeed, ZYXI is a story of sales reps, inventory and working capital by our estimation. As such, we see a number of curious factors in the working capital cycle when performing forensics over the company’s 3 financial statements, as seen in Exhibit 5. Firstly, accounts receivable turnover has crept down since FY18, whilst accounts payable turnover has increased. Average receivable collection days has also drifted upwards in that time to 60 days in the last quarter.
Meanwhile, inventory turnover has come down substantially since FY19 from ~4x pre-pandemic to just 2.3x last quarter. This is primarily due to ZYXI’s posture on inventory, having expanded inventory value from $5.6 million in March 2020 to more than $18 million in Q1 FY22. Per COO, Anna Lucsok, on the last earnings call:
“We’ve maintained effective inventory management throughout the global supply chain challenges and have sufficient inventory to accommodate our order growth in the coming months. We’ve seen longer lead times from our manufacturers…”
However, the data shows average inventory to cash days has widened substantially from FY19 to date. It has increased from 46 days in the first quarter of 2019 on a sequential basis to 157 days in the last print. Whilst inventory value has increased along the same time, when analyzing the movement of this inventory, it appears to be a headwind. As a result, the cash conversion cycle has increased to 151 days, up from 25 days pre-pandemic.
Exhibit 5. Working capital cycle has increased along with inventory value, whilst inventory turnover narrowed
Data: HB Insights, ZYXI SEC Filings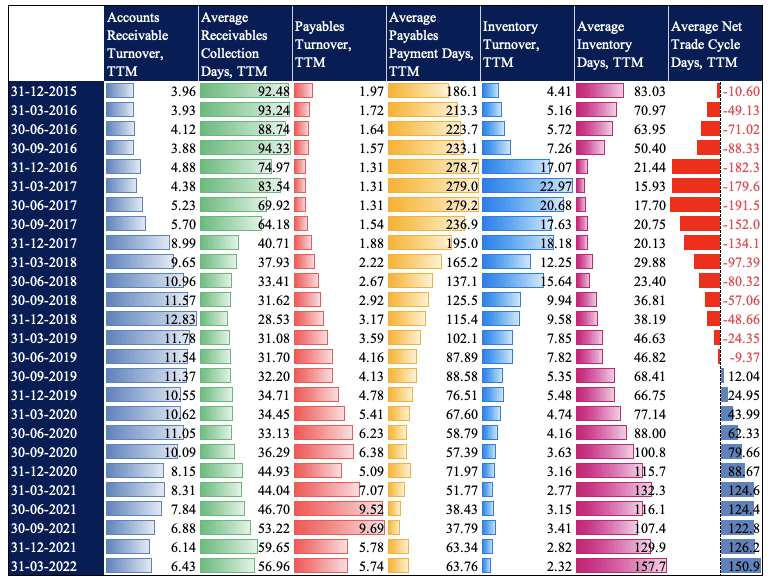
ZYXI Working Capital Flow:
Data: HB Insights 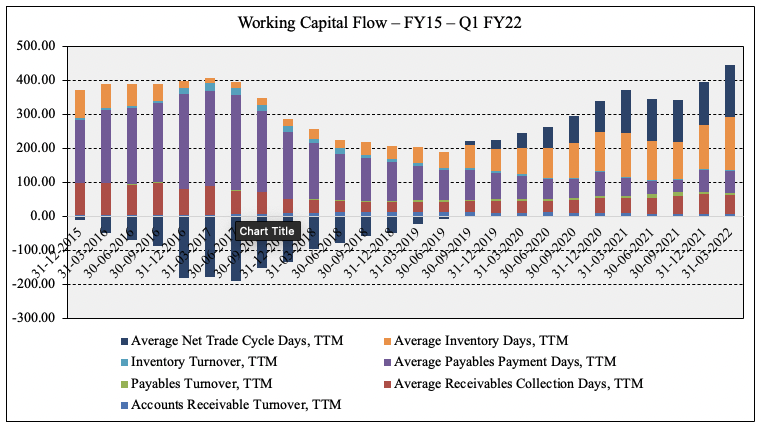
The analysis is seldom complete without crunching the data on ZYXI’s operating efficiency. We had been calling for revenue per sales rep as a measure to rate the company since early 2021. In that time, we’ve seen the company make substantial effort in building its sales rep force. It has a long-term goal of reaching 800 territories, and has been hovering around 430 territories for some time.
This continues to be a key risk for the company by our estimation. Firstly, the company’s top revenue generator continues to be its Next Wave device. It is a transcutaneous electronic neuromuscular stimulation (“TENS”) device that is indicated for pain management.
The evidence on TENS for pain management/analgesia is mixed at best, as corroborated by numerous systematic meta-analyses and cochrane reviews. Whilst there is certainly a push away from opioid-based pain management, that’s for sure, TENS has been on the market for years with varying success. Vance and colleagues (2014) found that evidence for TENS in pain relief is conflicting and that use of the device leads to no meaningful change in function. This was especially true in knee osteoarthritis (“KOA”) and lower back pain (“LBP”). Meanwhile, Wu and co-authors (2021) demonstrated that TENS is effective in KOA, but only when “combining with other interventions”, clouding the validity of the TENS’ efficacy. Paley et al (2019) however found that there was moderate-certainty evidence that “pain intensity is lower during or immediately after TENS compared with placebo.”
Hence, looking ahead, there remains a risk ZYXI’s next wave could get knocked off the shelf in favor of a more effective, widely accepted and adopted (non-TENS) substitute. Moreover, ZYXI’s reps must sell into this data with the push-back from clinicians and insurers another key risk to consider, as with all pain relief devices.
Second, the company’s goal to achieving a 500-rep headcount continues to be a key risk factor. Not only considering the current labor market, whereby filling future rep positions will be difficult, there is no assurance on the quality of reps hired. ZYXI found this out the hard way in FY21 when it had to trim down the headcount after some reps weren’t performing to standard.
Next, ZYXI says its revenue per rep grew 51% YoY last quarter. It also had a rep headcount of 430 last quarter, Management reaffirmed FY22 guidance of $150–$170 million at the top, calling for revenue per rep of $395,350 for the year, with Q2 guidance of $35–$38 million ($88K/rep). If the company hits these figures it would be a good sign it is meeting its efficiency targets at the sales rep level (and vice-versa).
ZYXI has also been struggling to deliver a substantial return on invested capital since FY18, as seen in the chart below. Here we are examining how much NOPAT was generated from last year’s invested capital. We prefer to use last year’s figure versus the average invested capital to get a cleaner picture of the operating leverage. Since that time, ROIC has narrowed in to ~2% in the last quarter, all whilst the level of invested capital has crept upward. FCF also came in the red at a loss of $2.7 million last quarter. This would be fine, and even desirable if the ROIC outweighed the cost of capital. However, ZYXI has a WACC of 5.05% as seen in Exhibit 6, leaving a c. 300bps spread, and the ROIC/WACC ratio to 0.43x. In Q1 FY22, ROIC from NOPAT was just 2.2%.
Exhibit 6. ROIC summary for ZYXI shows declining profitability from invested capital
Data: HB Insights Estimates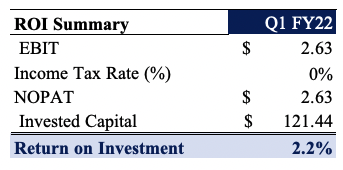
Data: HB Insights, ZYXI Sec Filings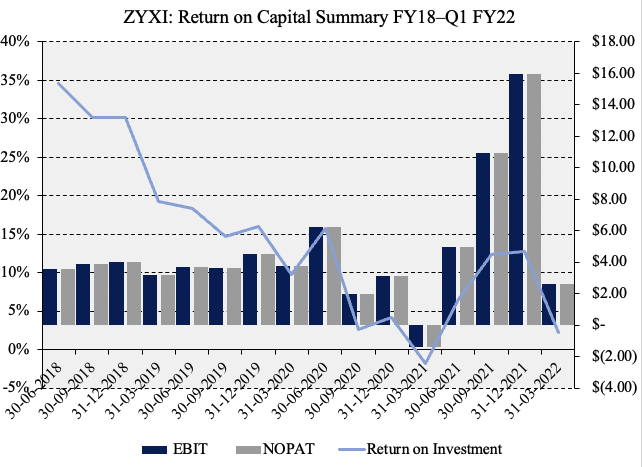
Valuation
Shares are trading at ~17x P/E, below the GICS sector median’s ~29x. Shares are also priced at ~2.25x sales, whilst trading at ~4x book value, below the industry’s 5x. We’re after value and thus looking ahead, the stock offers little upside to the sector on forward P/E, but is trading at a 22% discount to peers on a ~4 book value, with 58% ROE. At first glance, this is attractive and suggests ZYXI offers upside potential at the profitability level.
Exhibit 7. Multiples and comps
Data: HB Insights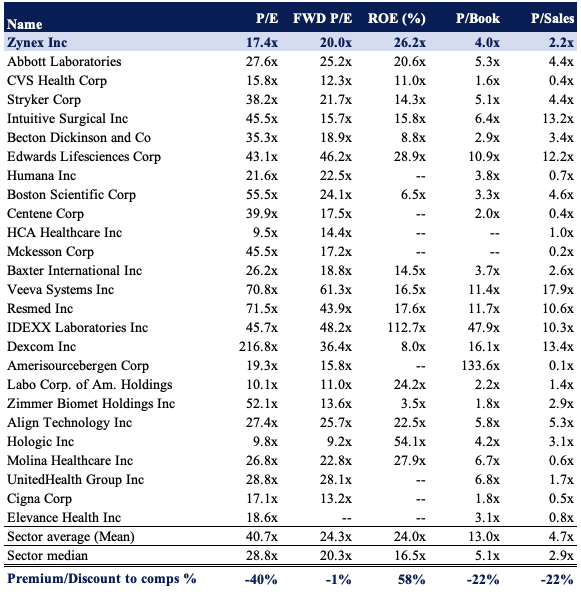
However, we have to dig a little deeper to gauge our ROE as investors. We’ve done this with both conventional ROE and ROE from FCF (“ROE[FCF]”). These figures are shown in the table below. Simply, ZYXI’s ROE is 58%. We paid 4x the book value, meaning our ROE is ~14.5%, or just 2.66% from FCF. Hence, the equity duration on FCF is 27 years, and goes against our current investment strategy seeking shorter equity duration.
Exhibit 8.
Data: HB Insights estimates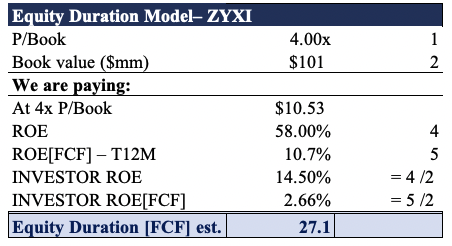
Based on the above, it looks like we are overpaying by ~42% or ~$3 per share at $4 book value. Hence, we believe ZYXI is overvalued by that amount, and adjusting for this sees us price the stock at $5.35 apiece.
In short
We recommend investors look elsewhere than ZYXI to obtain exposure to the factor premia driving equity returns in medtech. Issues we had identified in previous analyses persist, even if showing signs of receding. Chief to these risks is the success of the company’s sales force, and the ability to continue selling TENS units en masse amid a shifting treatment landscape.
Moreover, we believe there is a lack of idiosyncratic risk premia to harvest in the name, and that recent gains are beta-driven from strengths in the sector. Hence, we price ZYXI at $5.35 per share, with the view that it is currently 42% overvalued. Rate neutral.
Be the first to comment