

shaunl
During the last month, ZIM Integrated Shipping Services (NYSE:ZIM) stock price increased by 18% to $50 per share. In the last eight weeks, freight rates from Asia to the United States and Europe plunged. However, despite the recent correction, freight rates are still high. During the second quarter of 2020 and the second quarter of 2021, the Shanghai Containerized Freight Index (SCFI) was around 1000 and 3000, respectively. The Index was more than 4000 in the second quarter of 2022. According to Wall Street, the stock has a low price target of $40, a median price target of $72, and a high price target of $120. I evaluate that the stock is worth $50 per share. ZIM stock is a hold.
Freight rates are still high
Recently, regulations are threatening container shipping companies. The bipartisan Ocean Shipping Reform Act of 2022, which prohibits ocean carriers from declining opportunities for U.S. exports, has been signed into law. In my last article on ZIM, I explained that it has been more than a year that because of the significant freight rate difference of shipping from Asia to the United States than the other way round, shippers have the incentive to, after transporting goods from Asia to the United States, leave U.S. ports as quickly as possible (with empty containers) to return back to Asia. I concluded that ZIM’s revenues will not be hurt by the new act, as the company operates on a global scale. It can reallocate its vessels to benefit from the market condition. Also, 43% of the company’s trade exposure by carried TEU is immune to the U.S. Ocean Shipping Act of 2022.
Moreover, I predicted that the freight rate from the U.S. to Asia and Europe will increase. Figure 1 shows that from 26 May 2022 to 14 July 2022, the freight rate from Los Angeles to Shanghai increased from $1,250 per FEU to $1,292 per FEU. However, from 14 July 2022 to 28 July 2022, the freight rate from Los Angeles to Shanghai decreased to $1,259 per FEU. Moreover, from 26 May 2022 to 28 July 2022, the freight rate from New York to Rotterdam increased from $1,183 per FEU to $1,274 per FEU. On the other hand, the freight rates from Asia to U.S. and Europe plunged in the last two months. Figure 1 shows that from 26 May 2022 to 28 July 2022, the freight rate from Shanghai to Los Angeles dropped by 17%. In the same period, the freight rate from Shanghai to Rotterdam dropped by 6%. Moreover, the freight rate from Shanghai to Genoa plunged by 15%.
Figure 1 – Spot freight rates by major route (www.drewry.co.uk)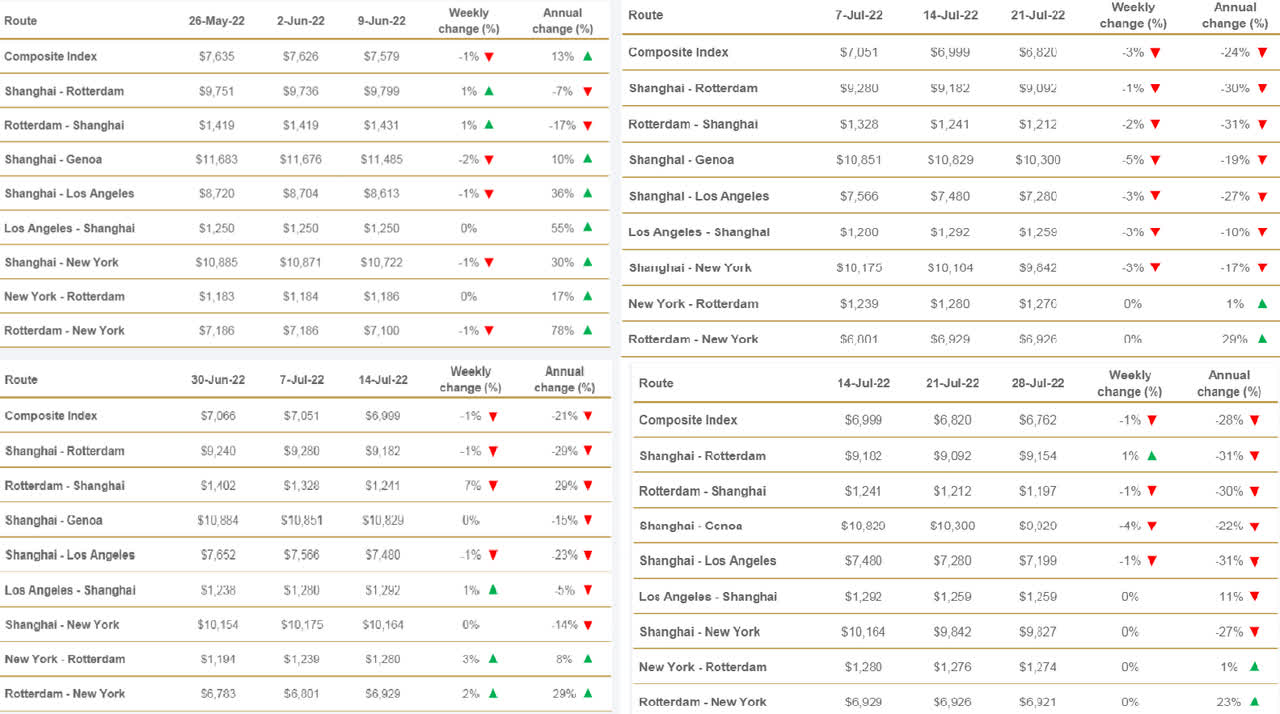
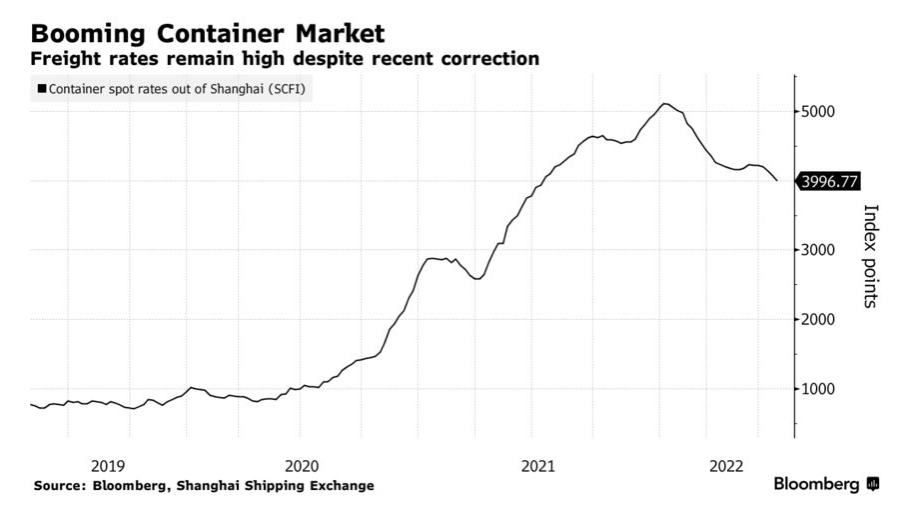
Figure 2 shows that in July 2022, freight rates are higher than in July 2020 and lower than in July 2021. Thus, despite the recent drop in the freight rates, especially from Asia to the United States and Europe, freight rates for container shipping companies are still attractive. According to Figure 3, during the second quarter of 2020 and the second quarter of 2021, the Shanghai Containerized Freight Index was around 1000 and 3000, respectively. In its 2Q 2020 financial result, ZIM reported an adjusted EBITDA of $145 million. In its 2Q 2021 financial results, ZIM reported an adjusted EBITDA of $1340 million. According to Figure 3, SCFI was more than 4000 in the second quarter of 2022. Based on ZIM’s quarterly financial reports and the SCFI, I estimate a 2Q 2022 adjusted EBITDA of $1.9 billion For ZIM. For the full year of 2022, I estimate an adjusted EBITDA of $7.7 billion for ZIM, compared with its 2022 guidance of $7.8 to $8.2 billion.
Figure 2 – Trade Routes from Shanghai (US$/40ft) (www.drewry.co.uk) Figure 3 – Freight rates are still high (Bloomberg)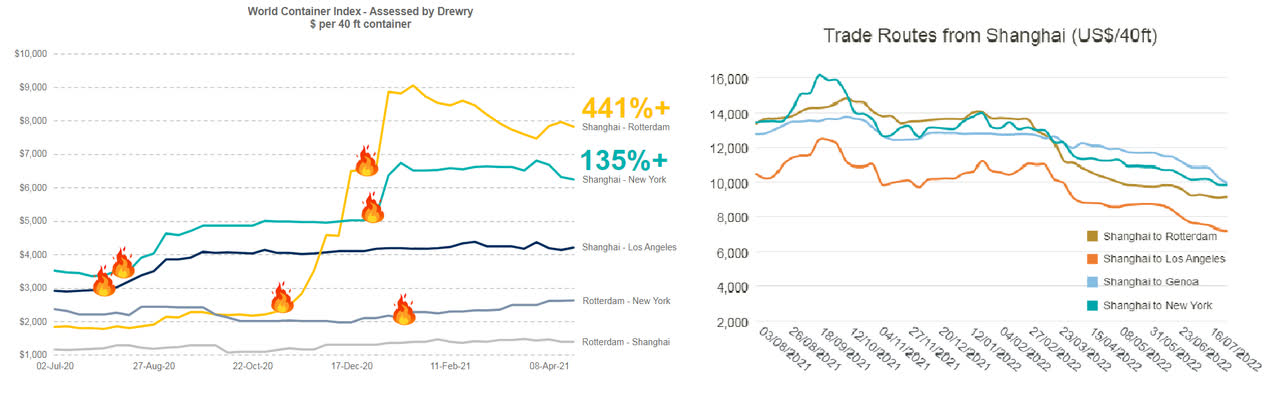
ZIM performance outlook
As a bottom line to provide a final capture of the company’s profitability, ZIM’s ever-increasing net profit margin grew by more than 200% and sat on 0.43 at the end of 2021 compared with its amount of 0.13 in 2020 when the pandemic started. Moreover, across the board of return on assets, the ROA ratio shows that 46.7% of the company’s net earnings is related to its assets. ZIM’s return on assets boosted impressively during 2021 and sat on 47% versus its previous level of 13.3% at the end of 2020. Thus, ZIM’s profitability ratios provide a good picture of its ability to generate income relative to its revenue and assets (see Figure 4).
Figure 4 – ZIM Integrated profitability ratios (Author – based on SA data)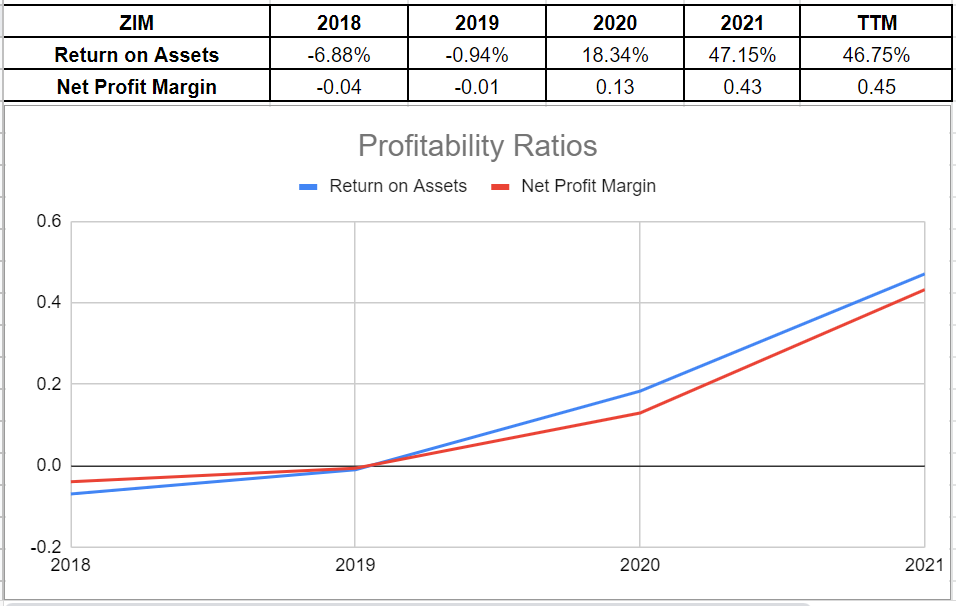
Moreover, we can analyze ZIM’s coverage ability across the board of its interest-coverage ratio and cash-coverage ratio. Currently, its ICR indicates that 43 times the company is able to pay its interest expenses on its debt with its operating income. ZIM’s interest coverage ratio in TTM has improved impressively compared to its amount of 34.3x at the end of 2021. Also, as a conservative metric to compare the company’s cash balance to its annual interest expense, ZIM’s cash-coverage ratio has increased to 16.24x versus its previous level of only 9.14x at the end of 2021. The company’s coverage ratios represent that ZIM is able to pay its obligations easily (see Figure 5).
Figure 5 – ZIM Integrated coverage ratios (Author – based on SA data)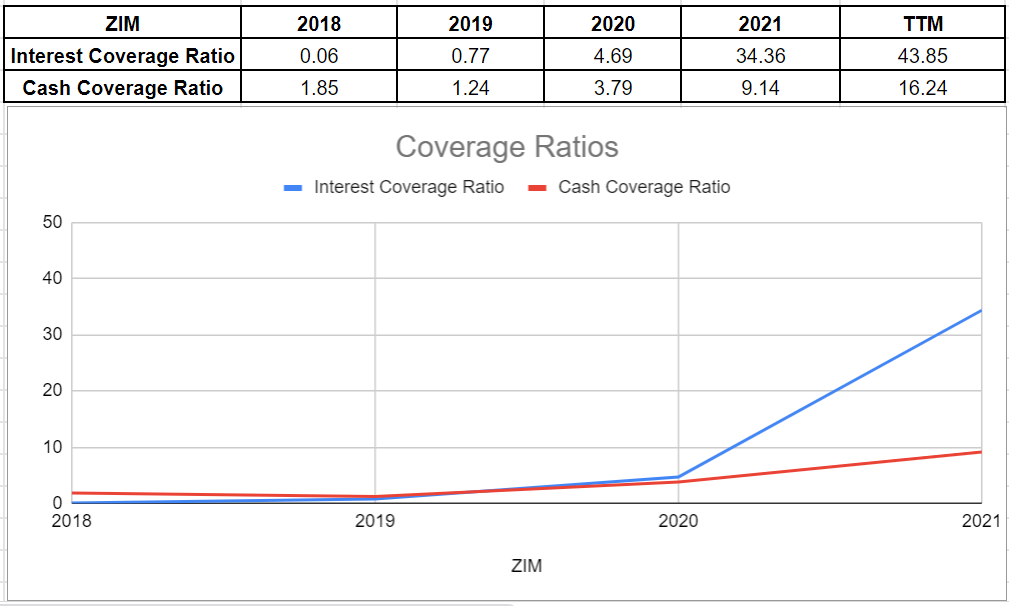
Based on the company’s strong cash and capital structures that I covered in my last update, it is expected to observe improvements in its liquidity ratios. ZIM’s cash ratio in TTM shows an increase of 89% to 0.55x compared with its previous amount of 0.29x at the end of 2021. On the other hand, after an amazing increase in the current ratio to 1.84x at the end of 2021 relative to its previous level of 1.04x at the end of 2020, the company’s current ratio of 1.84x in 2021 declined to 1.29x in the first quarter of 2022, down 29% (see Figure 6).
Figure 6 – ZIM Integrated liquidity ratios (Author – based on SA data)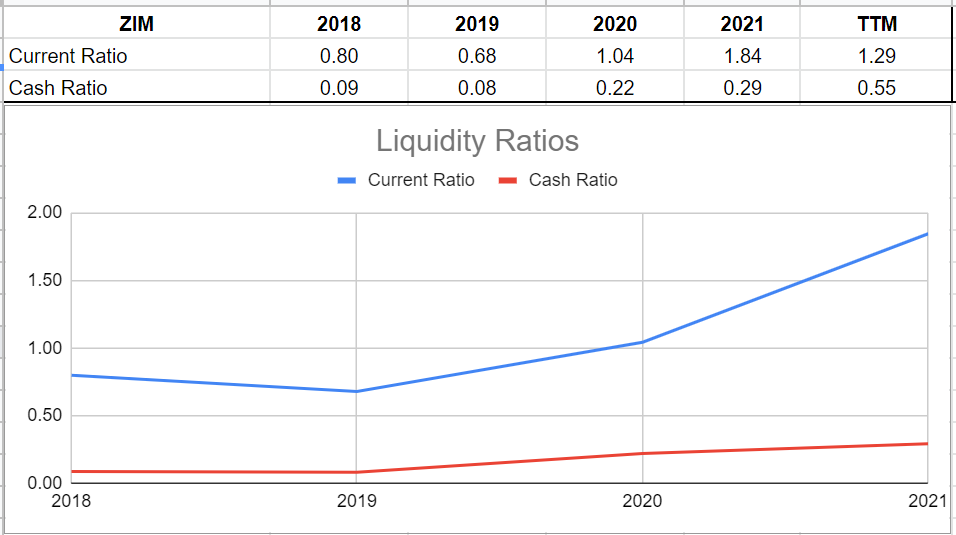
ZIM stock Valuation
To estimate ZIM’s fair value, I investigated its EBITDA growth during the last five years. The company’s EBITDA grew impressively in recent years. Meanwhile, its net debt declined by over 18% in the previous years. Based on 1Q 2022 data and the long-term contracts in 2022, the company updated and increased its full-year 2022 guidance. They expect to generate adjusted EBITDA between $7.8 billion to $8.2 billion. Notwithstanding the predicted adjusted EBITDA, I considered ZIM’s adjusted EBITDA to be about $7.75 billion. Moreover, it is realized that the company’s net debt amount is going to be between $(416) to $(510) million. According to the EV/EBITDA ratio in TTM and its financial data, ZIM Integrated’s fair value is around $50 per share (see Table 1). As it is mentioned in Table 1, Scenario 1 is based on the 18% average rate of decline in the net debt during the last years, and Scenario 2 is based on the TTM net debt. We can see that in both scenarios, the stock is worth around $50 per share. Based on my valuation, the stock is a hold.
Table 1 – ZIM Integrated fair value (Author’s calculations)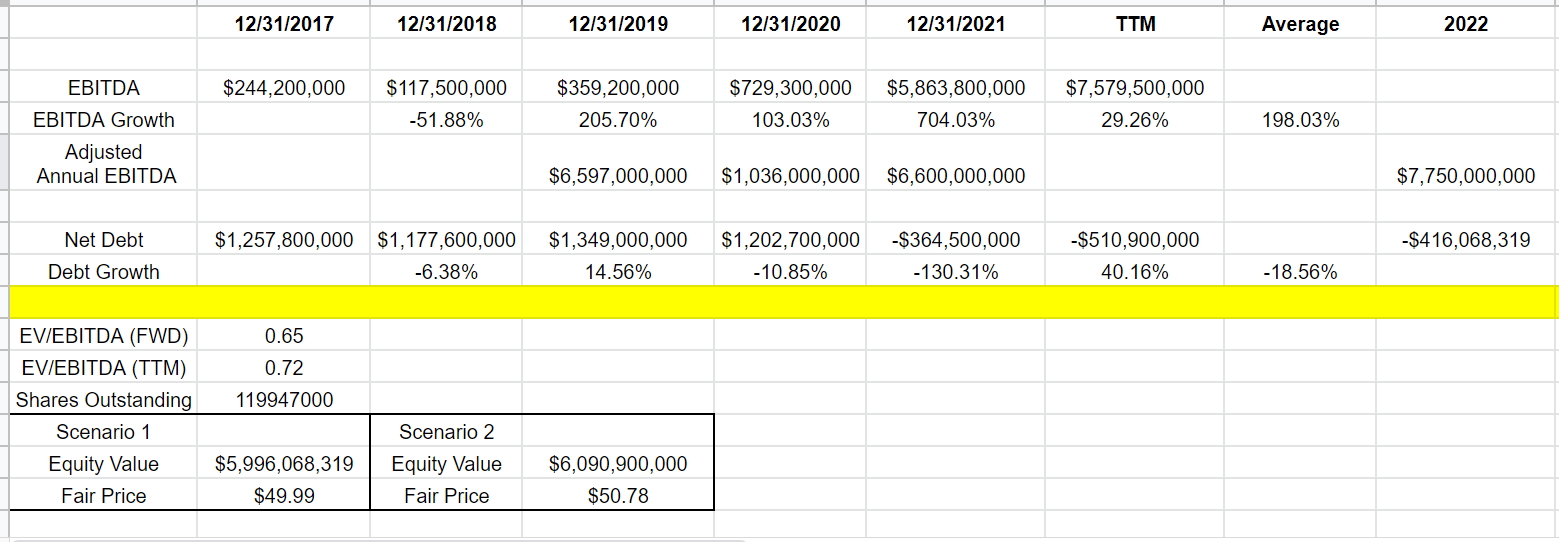
Summary
Despite the recent correction of the freight rates, the container market is still attractive. I estimate a 2Q 2022 adjusted EBITDA of $1.9 billion for ZIM. Also, for the full-year of 2022, I predict that ZIM’s adjusted EBITDA will be close to its guidance of $7.8 to $8.2 billion. My stock valuation shows that ZIM is worth around $50 per share. Furthermore, the company’s coverage ratios represent that ZIM is able to pay its obligations easily. In short, ZIM’s healthy liquidity position is observable from its liquidity ratios. The stock is a hold.
Be the first to comment