

B4LLS/iStock via Getty Images
A Quick Take On Zenvia
Zenvia (NASDAQ:ZENV) went public in July 2021, raising approximately $150 million in gross proceeds from an IPO that priced at $13.00 per share.
The firm provides businesses in Latin America with a modern customer experience software and services platform.
For the near term, I’m on Hold for ZENV until management can show a meaningful turn toward operating breakeven while continuing to produce 30% or more growth.
Zenvia Overview
São Paulo, Brazil based Zenvia was founded to develop a customer communications system for companies to digitally interact with their customers and prospective customers across the entire customer journey.
Management is headed by founder and Chief Executive Officer Cassio Bobsin, who was previously the founder of WOW Accelerator, a large independent accelerator in Brazil.
The company’s primary offerings include:
-
Marketing campaigns
-
Sales communication
-
Customer service
-
Client engagement
-
APIs, chatbots and other tools
-
Customer communication channels
The firm pursues a ‘land and expand’ approach to gaining enterprise clients, which is common for enterprise software firms providing a SaaS solution.
Zenvia’s Market & Competition
According to a 2018 market research report by Research and Markets, the global customer experience management market is projected to grow to $21.3 billion by 2024.
This represents a forecast CAGR of 22% from 2018 to 2024.
The main drivers for this expected growth are the growing needs of customers for a personalized customer experience throughout their purchase journey.
Also, experience management helps enterprises grow their brands, increase customer loyalty, reduce client attrition and improve their operations.
Major competitive or other industry participants include:
-
Infobip
-
Sinch (OTC:CLCMF)
-
Twilio (TWLO)
-
MessageBird
-
Zendesk (ZEN)
-
Salesforce (CRM)
-
Take
-
Yalo
-
Qualtrics (XM)
-
Others
Zenvia’s Recent Financial Performance
Total revenue by quarter has risen per the following chart:
9 Quarter Total Revenue (Seeking Alpha)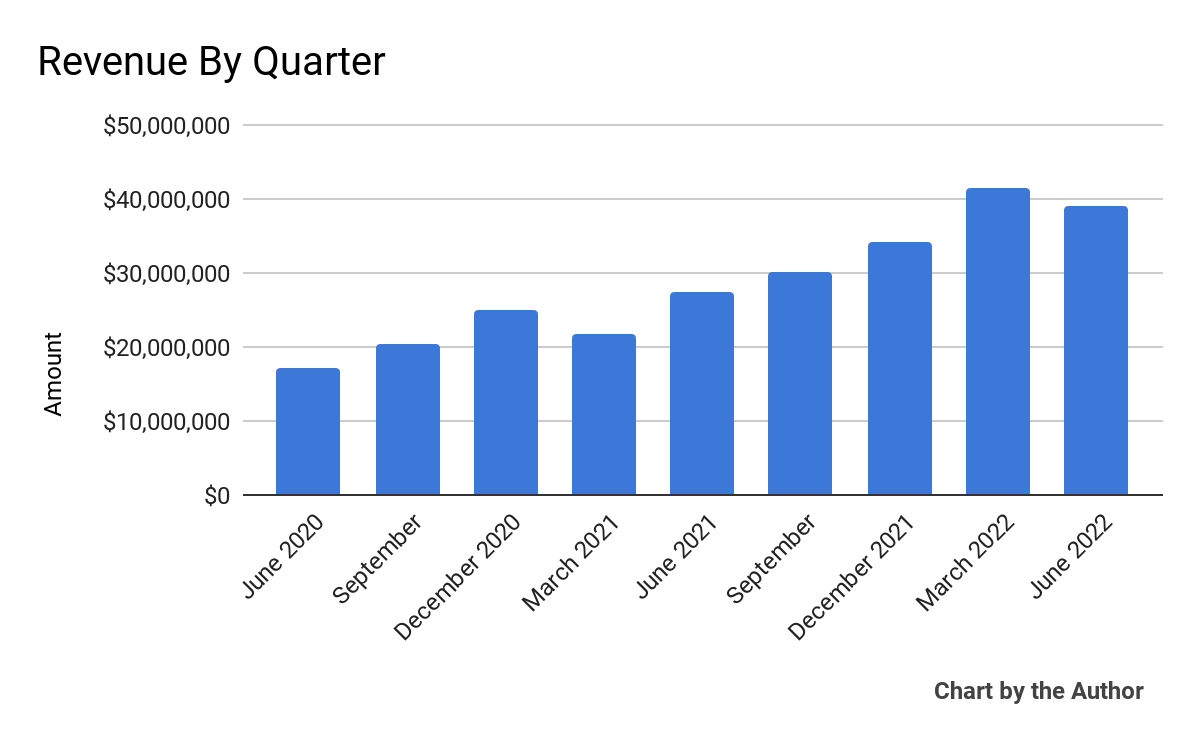
Gross profit by quarter has also grown accordingly:
9 Quarter Gross Profit (Seeking Alpha)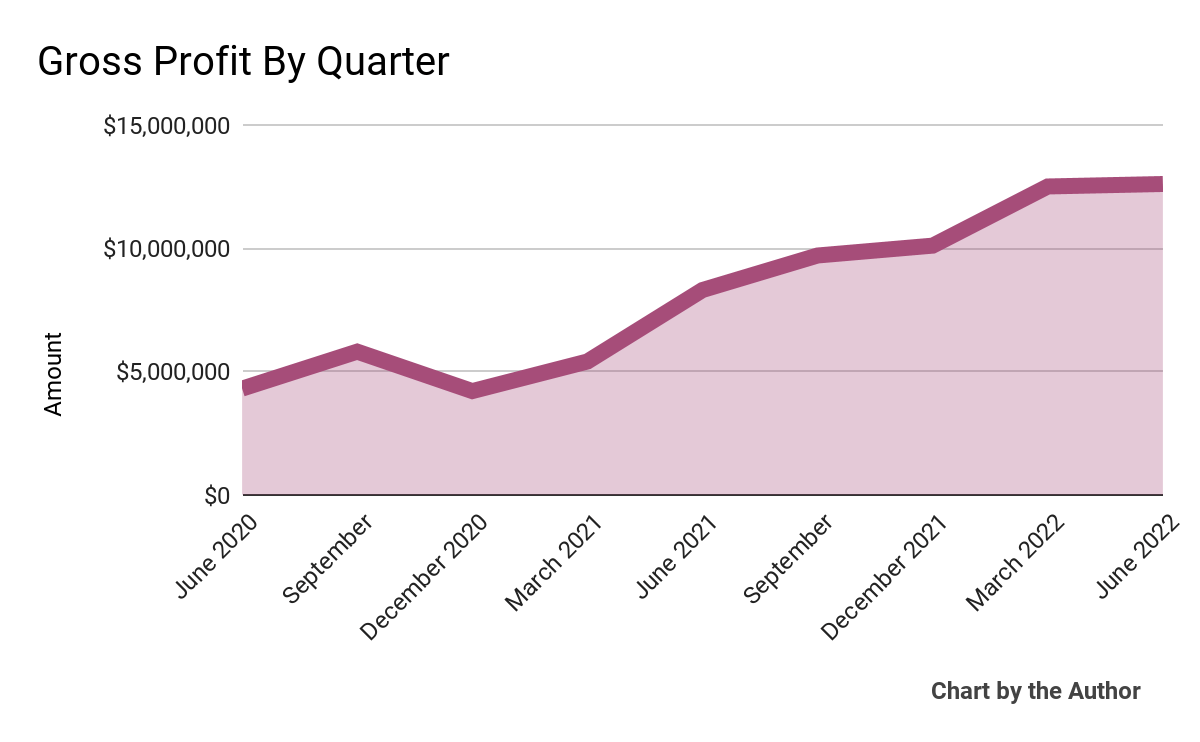
Selling, G&A expenses as a percentage of total revenue by quarter have trended upward in recent quarters:
9 Quarter Selling, G&A % Of Revenue (Seeking Alpha)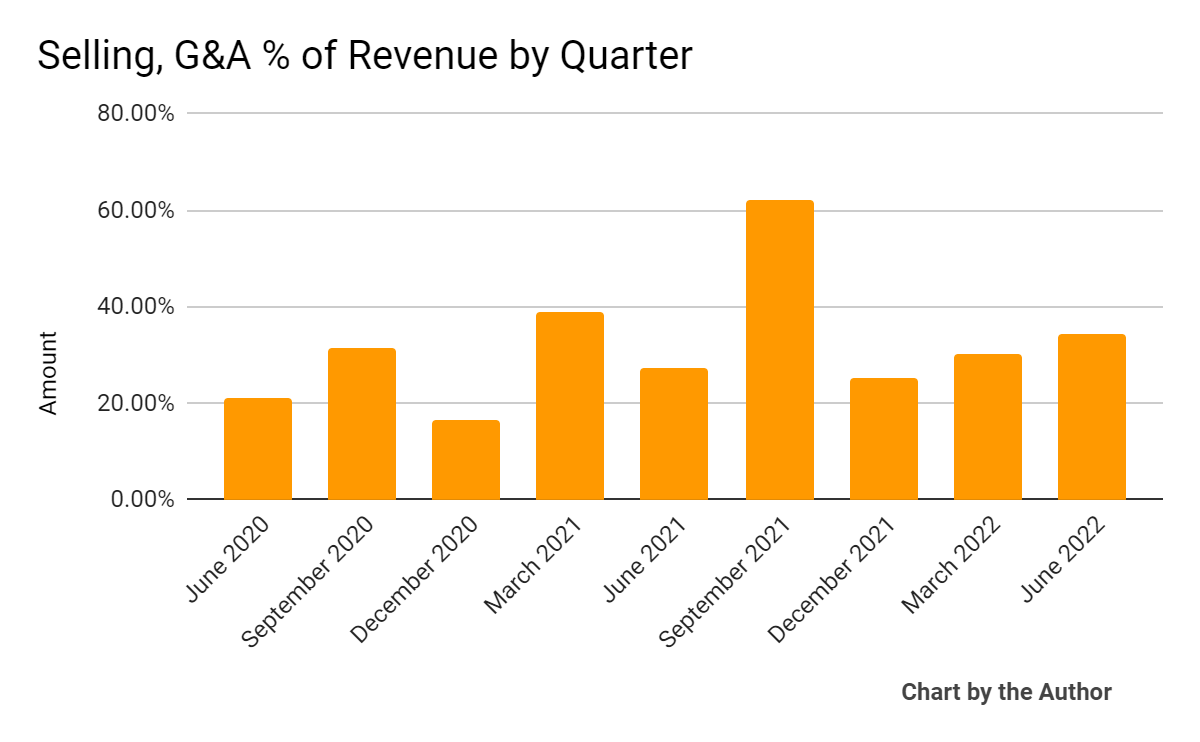
Operating income by quarter has remained negative and generally worsened in recent quarters:
9 Quarter Operating Income (Seeking Alpha)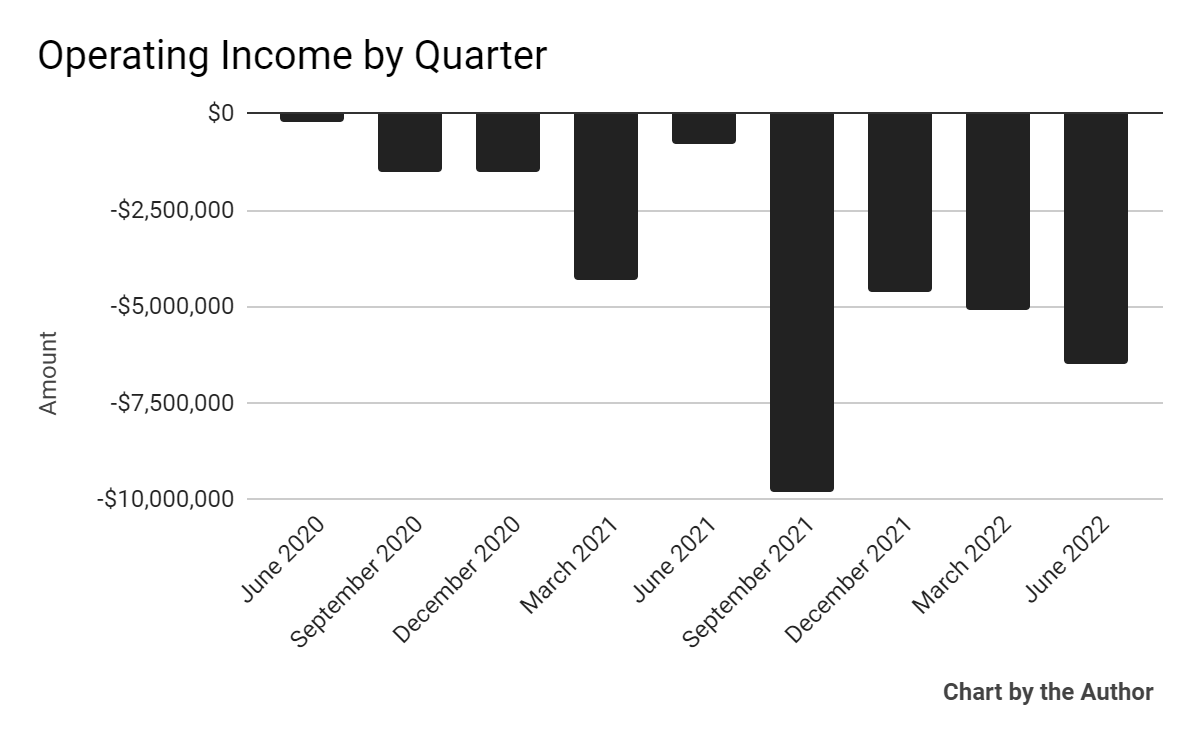
Earnings per share (Diluted) have remained negative over the past 9 quarters, with one exception:
9 Quarter Earnings Per Share (Seeking Alpha)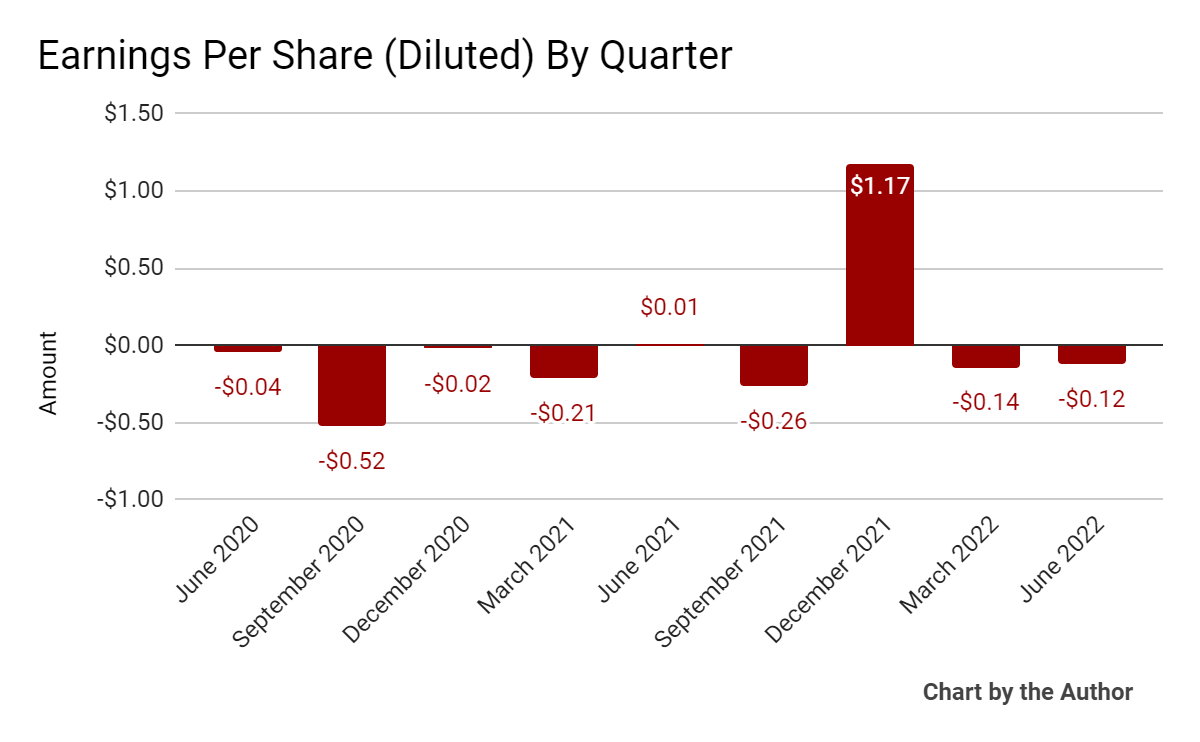
(All data in above charts is GAAP)
Since its IPO, ZENV’s stock price has fallen 89.3% vs. the U.S. S&P 500 index’s drop of around 11.9%, as the chart below indicates:
52 Week Stock Price (Seeking Alpha)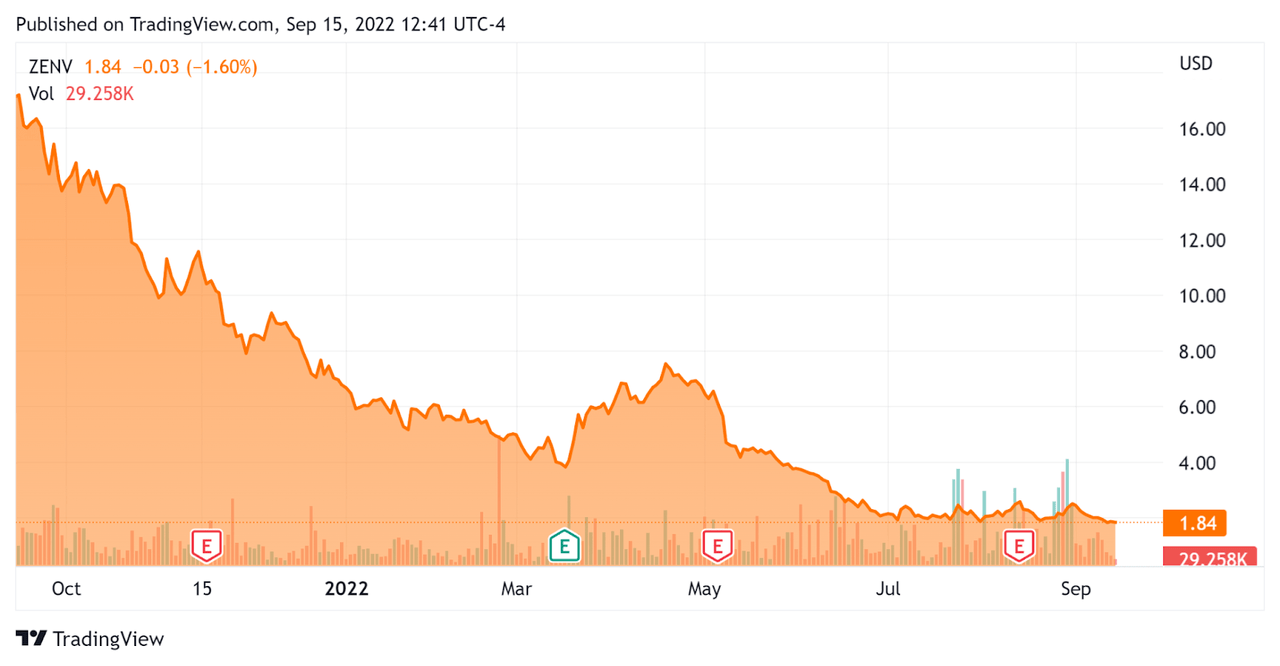
Valuation And Other Metrics For Zenvia
Below is a table of relevant capitalization and valuation figures for the company:
|
Measure [TTM] |
Amount |
|
Enterprise Value / Sales |
0.65 |
|
Revenue Growth Rate |
50.4% |
|
Net Income Margin |
-9.3% |
|
GAAP EBITDA % |
-14.0% |
|
Market Capitalization |
$78,070,000 |
|
Enterprise Value |
$94,020,000 |
|
Operating Cash Flow |
-$11,140,000 |
|
Earnings Per Share (Fully Diluted) |
$0.65 |
(Source – Seeking Alpha)
As a reference, a relevant partial public comparable would be Sprinklr (CXM); shown below is a comparison of their primary valuation metrics:
|
Metric |
Sprinklr |
Zenvia |
Variance |
|
Enterprise Value / Sales |
4.16 |
0.65 |
-84.4% |
|
Revenue Growth Rate |
29.8% |
50.4% |
69.1% |
|
Net Income Margin |
-20.4% |
-9.3% |
-54.4% |
|
Operating Cash Flow |
-$13,090,000 |
-$11,140,000 |
-14.9% |
(Source – Seeking Alpha)
A full comparison of the two companies’ performance metrics may be viewed here.
The Rule of 40 is a software industry rule of thumb that says that as long as the combined revenue growth rate and EBITDA percentage rate equal or exceed 40%, the firm is on an acceptable growth/EBITDA trajectory.
ZENV’s most recent GAAP Rule of 40 calculation was 36.4% as of Q2 2022, so the firm has performed reasonably well in this regard, per the table below:
|
Rule of 40 – GAAP |
Calculation |
|
Recent Rev. Growth % |
50.4% |
|
GAAP EBITDA % |
-14.0% |
|
Total |
36.4% |
(Source – Seeking Alpha)
Commentary On Zenvia
In its last earnings call (Source – Seeking Alpha), covering Q2 2022’s results, management highlighted that the allocation of its IPO resources was toward M&A and R&D efforts.
The firm produced strong client base expansion of 37% year-over-year as the firm accelerated its transition to a SaaS company.
Management believes this is ‘just a fraction of the total addressable market for SaaS services in Latin America,’ where the company has achieved a 2% market share in the past year, per company leadership.
As to its financial results, revenue rose 50% year-over-year, while gross margin was 38%, an increase of 5% year-over-year.
Half of the revenue growth came from M&A deals and the other half from organic growth.
I could not find a reference to the company’s net dollar retention rate, which is an important metric in gaining visibility into its product/market fit and sales & marketing efficiency.
The company’s Rule of 40 results have been reasonably good.
However, SG&A as a percentage of total revenue has continued to rise, as have operating losses and net losses.
For the balance sheet, the firm finished the quarter with cash and equivalents of $23 million and debt of $24.7 million, while it generated $5.3 million in free cash flow.
Looking ahead, management expects to ‘generate positive EBITDA during the second half of the year, while our operating cash flow should be at breakeven in the next six months.’
Regarding valuation, the market is valuing ZENV at an EV/Sales multiple of around 0.65xx.
The SaaS Capital Index of publicly held SaaS software companies showed an average forward EV/Revenue multiple of around 6.8x at August 31, 2022, as the chart shows here:
SaaS Capital Index (SaaS Capital)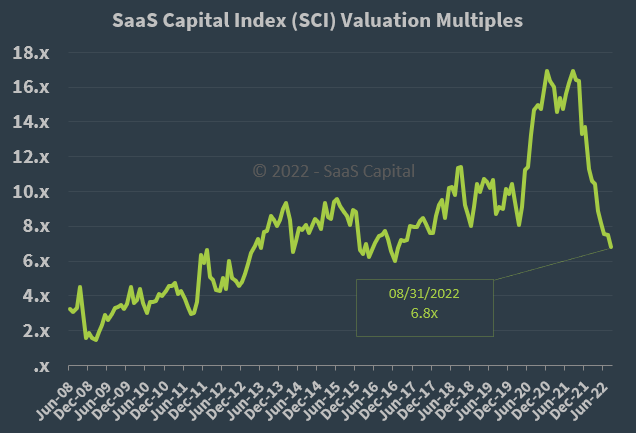
So, by comparison, ZENV is currently valued by the market at a significant discount to the broader SaaS Capital Index, at least as of August 31, 2022.
The primary risk to the company’s outlook is an increasingly likely macroeconomic slowdown or recession, which may slow sales cycles and reduce its revenue growth trajectory.
Zenvia is turning toward a cloud-centric approach and appears to be making good progress in that regard.
A potential upside catalyst to the stock could include a pause in the rise in the cost of capital, although I would discount that possibility in the near term.
While value investors may find Zenvia’s valuation enticing, management has changed its focus to greater profitability, possibly at the expense of topline growth.
I agree with that approach, but it hasn’t appeared in the financial results of the company yet, as it continues to make increasing operating losses and higher SG&A as a percentage of revenue.
For the near term, then, I’m on Hold for ZENV until management can show a meaningful turn toward operating breakeven while continuing to produce 30% or more growth.
Be the first to comment