

Solskin
SPDR S&P Pharmaceuticals ETF (NYSEARCA:XPH) is an exchange-traded fund that invests in small-, mid- and large-cap stocks in the U.S. pharmaceuticals sector. The fund is concentrated in 44 holdings (as of November 10, 2022), with net assets under management of $224 million, making the fund niche and not especially popular. The expense ratio is 0.35%. This follows net fund flows of about $9 million over the past year; a modest increase.
ETFDB.com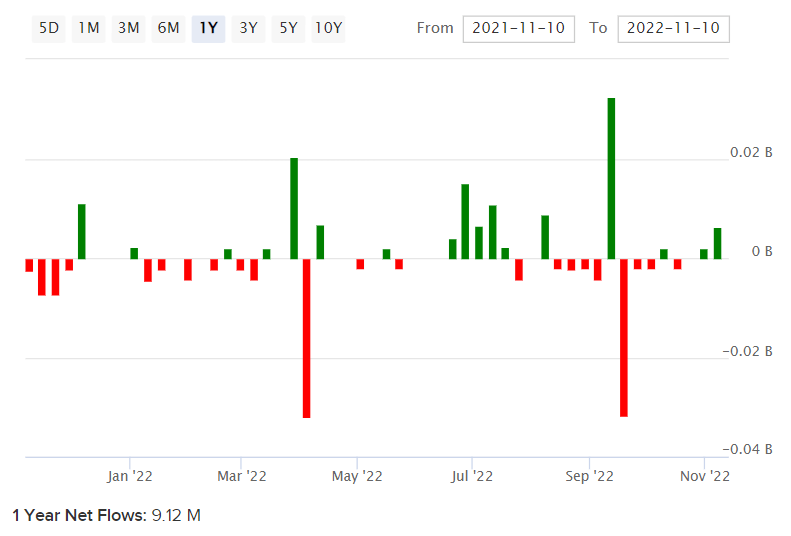
XPH has fallen by -7.94% year-to-date on a price-only basis, versus the S&P 500 U.S. equity index’s fall of -16.75% to the time of writing. XPH has therefore outperformed. The level of decline here is about 47% (or 0.47x) of the S&P 500’s fall (price/level only), which is actually a strong performance given XPH’s five-year historical beta of 0.74x. This might be a sign of bullishness on XPH through 2022. The dividend yield is 1.67% as calculated by SPDR on a 30-day SEC yield basis. So, the fund is not beating broader equity indices because of a high dividend yield.
Bear in mind that health care, which pharmaceuticals would fall into, tends to out-perform as a sector into recessions (see research below from Fidelity).
Fidelity.com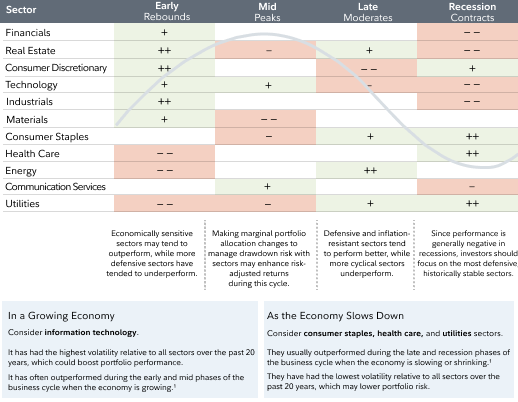
Based on other research from Fidelity, the United States has indeed been heading into a recessionary period (most probably) from the start of 2022 into Q4 2022 (the last update as per the chart below).
Fidelity.com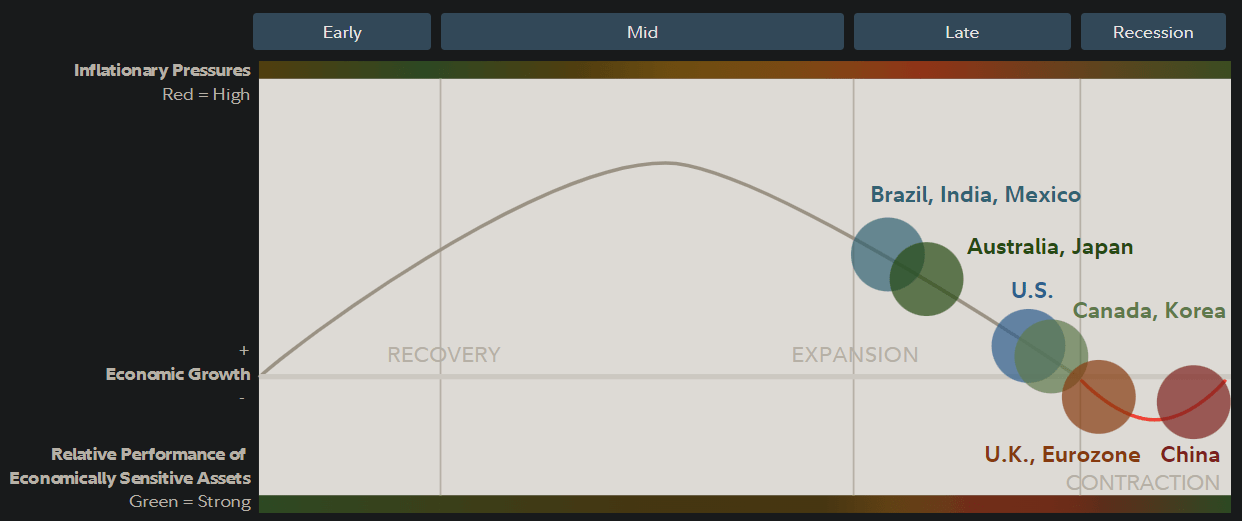
The problem now becomes the fact that recessions on average last about a year, actually a little less, while markets lead the real economy by 6-12 months or so. Therefore, now that a recessionary period is coming up, and XPH has already been out-performing broader equity indices, it makes sense that such out-performance will now begin to tail off. The ratio of XPH/SPX (SPX being the S&P 500) is shown below.
TradingView.com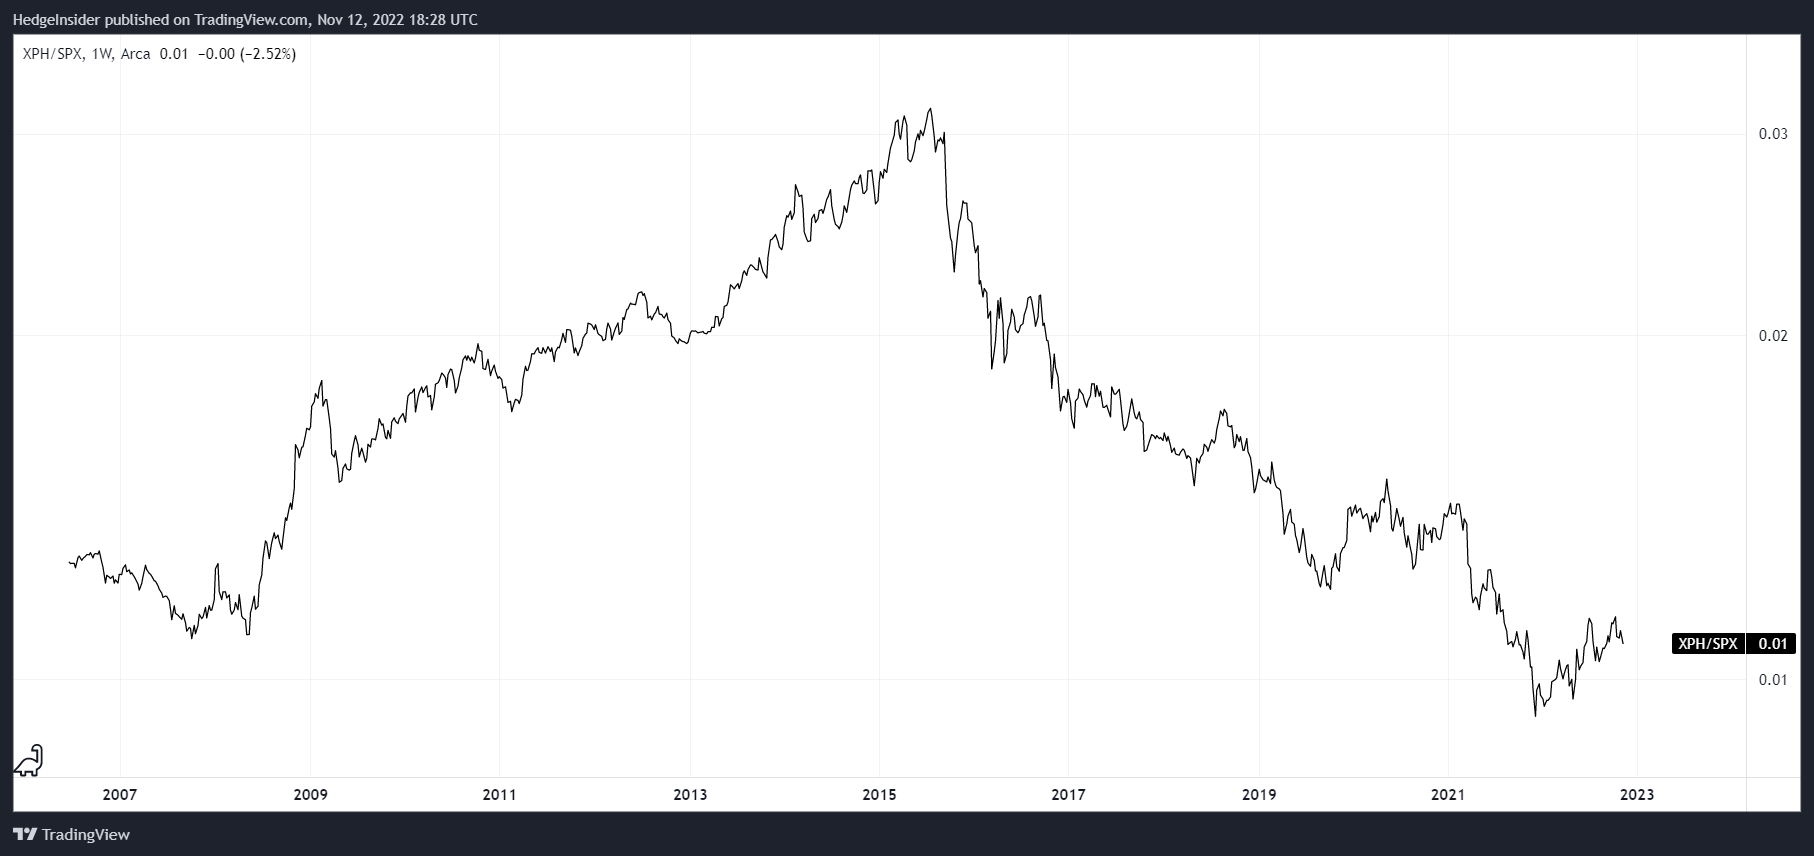
While it is possible that XPH will out-perform on a longer-term basis, it would be unsurprising to see the long-term downward trend (since mid-2015) continue. Nevertheless, valuation can help to buffer or even stave off relative downside, so it is worth reviewing XPH’s current value.
The most recent factsheet for XPH’s benchmark is dated as of October 31, 2022, reporting trailing and forward price/earnings ratios of -50.96x (i.e., negative earnings and 69.64x (a very low earnings yield), respectively. The price/book ratio is 3.11x. The indicative dividend yield was 0.96%. Given that the aggregate financial accounts of XPH’s portfolio evidently result in very low operating/net income figures per XPH’s benchmark index’s figures, in this case I will instead make reference to Morningstar‘s figure for forward earnings (10.39x) and a trailing ratio from ycharts.com of 18.42 as of November 11, 2022. Both these numbers are evidently making adjustments for various items to get a “better” (read: more generous) reflection of underlying earnings.
For the sake of getting a sensible idea of perceivable value in XPH’s portfolio from an investor’s perspective, I will use the adjusted price/earnings ratios above, together with Morningstar’s price/book ratio of 2.74x for consistency. However, this is not an ideal scenario, and therefore I would in my mind consider any final model output with greater scepticism. In any case, these adjusted ratios imply a forward return on equity of 26.4%, and a forward earnings yield of 9.62%. This wide range, mostly above 10%, suggests that XPH is potentially a high-return fund, but caveats abound (including most importantly the above considerations, perhaps as well as the low indicative dividend yield).
Assuming no buybacks, the potential headline IRR is high. This is supported by a possibly very generous forward price/earnings ratio offered by Morningstar, as well as a 10-12% medium-term average earnings growth trajectory that I have based on a slowing return on equity to 20% over six years. Morningstar’s average earnings growth figure is 9.45% for this period.
Author’s Calculations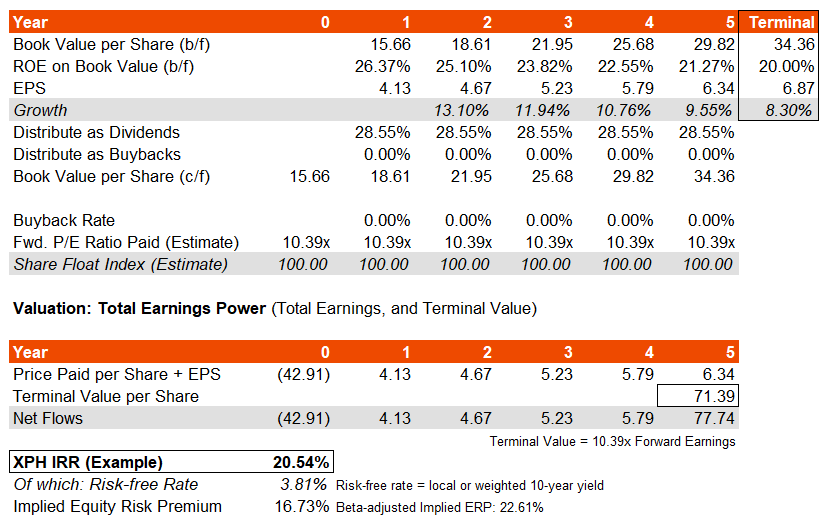
If I drop my forward return on equity assumption such that average earnings growth beyond the first year is closer to Morningstar’s consensus view, the IRR still remains high at just under 18% (as compared to my 21% figure above).
You could argue that either the market is deeply discounting XPH, or that the market is rightly ascertaining a low quality of earnings for XPH’s portfolio. I would suggest the latter is more likely. The problem is that this is not clear-cut: the very high price/earnings ratio of 69.64x offered by S&P Dow Jones Indices for XPH’s benchmark at the end of October suggests clearly that the market is not just looking at bottom-line profits. The market is giving XPH some benefit of the doubt, but not all of it.
Another approach would be as follows: if I take the less forgiving data from S&P themselves, but assume that the market will hold constant the generous forward earnings multiple of 69.64x (because clearly the market is valuing XPH’s earnings in a different way), and assume that earnings growth a steady 10% after year one, the IRR settles back down to 11.12%. Assuming 8% growth instead of 10% would take the IRR lower, to 9.13%. This gives us a probably more accurate range for the underlying intrinsic value of XPH; offering a net IRR at the present share price of 9-11% per year. The equity risk premium is 5-7% on a headline basis, or 7-10% on a beta-adjusted basis (the latter being higher due to XPH’s historically lower beta).
On balance, it is fair to say that XPH is a more difficult fund to value than most other sector-oriented funds. Given this uncertainty, coupled with poor cyclical attractiveness (as discussed), coupled with a low underlying dividend yield, would lead me to take a neutral view on XPH at present. Further out-performance is possible, but I think I would rather be exposed to sectors with greater cyclical favorability and more transparent underlying earnings.
Be the first to comment