

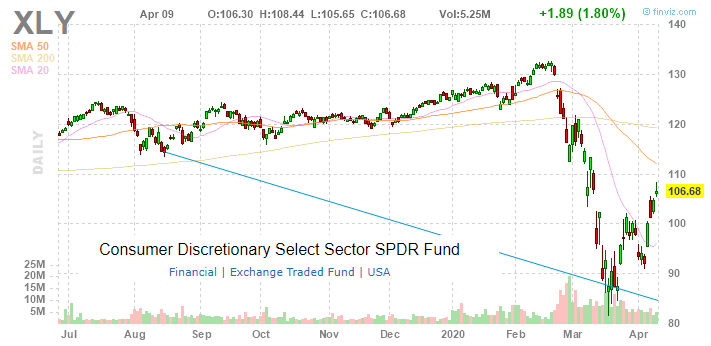
The Consumer Discretionary Select Sector Fund (NYSEARCA:XLY) tracks the performance of the sector components within the S&P 500 Index (SPY). This market segment has benefited in recent years given what was previously strong trends in the labor market and economic growth in the U.S. The emergence of the coronavirus pandemic has pulled back some of that momentum given the major disruption to consumer spending due to the ongoing nationwide lockdown measures. While aggressive monetary easing and government relief efforts are seen mitigating some of the near-term consequences, we take a more bearish view on the sector and XLY given significant headwinds including a rise in unemployment and uncertain economic recovery process.
(Source: Finviz.com)
Performance
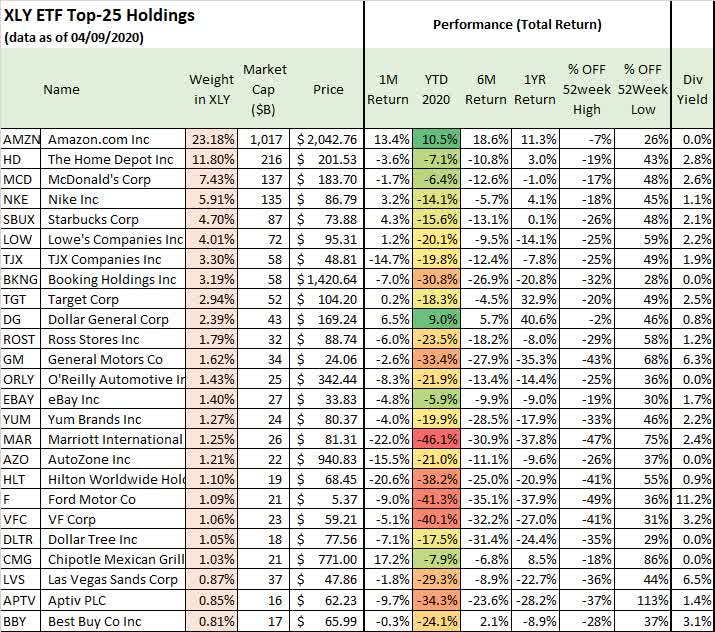
XLY is down by 15% year to date, roughly matching the performance of the S&P 500 with a decline of 14%. This measure may be misleading since the fund has a high concentration in Amazon.com, Inc. (AMZN) with a 23.2% weighting in the fund given the market cap methodology. AMZN’s 11% gain in this year has largely carried the overall consumer discretionary sector and the XLY ETF. Our data shows the medium year-to-date return across all 63 holdings in XLY is a decline of 31%. Only Amazon and Dollar General (DG) have managed to post a positive gain in 2020 each up 11% and 9% respectively.
 (Source: Data by YCharts/ graph by author)
Amazon as an e-commerce giant has benefited from consumers relying more on online shopping during this crisis. Dollar General as a discount brick-and-mortar merchandiser has repeatedly seen a surge in shoppers with most of the company’s locations still open and selling household essentials.
At the other end of the spectrum, the major cruise line companies between Carnival Corp. (CCL), Royal Caribbean Cruises Ltd (RCL), and Norwegian Cruise Lines Holdings Ltd (NCLH) are the worst-performing stocks in XLY and among the hardest hit in all of the S&P 500.
With cruise operations completely shut down, there is an expectation that the industry will have the greatest difficulties in attempting to return to normal as a consequence of this public health crisis. Carnival Corp. whose stock is down by 75% year to date has already canceled some sailings through 2020. NCLH is down by 78% as the weakest in the group while RCL has declined by 70%. The consideration here is that even when given an authorization by the CDC to resume service, travelers may be hesitant to take a cruise vacation and the business could face impacts beyond 2021.
The extremely volatile market environment has led to a wide range of returns among the underlying holdings of XLY. The table below presents the returns data for the top 25 holdings in XLY including the year to date, one-month, six-month, one-year performance along with the percentage off the respective 52-week low and high.
 (Source: Data by YCharts/ table by author)
If we consider that the market has rebounded since the lows in March with SPY up nearly 28%, many stocks have already significantly pared losses. The column in the table with a percentage off the 52-week low shows major moves higher occurring in the past few weeks. Stocks like Lowe’s Companies Inc (LOW), Ross Stores (ROST), and Marriott International (MAR), and Chipotle Mexican Grill (CMG), for example, are each up over 59%, 75%, and 86% from their recent lows highlighting extreme volatility while still being down in 2020.
Valuation
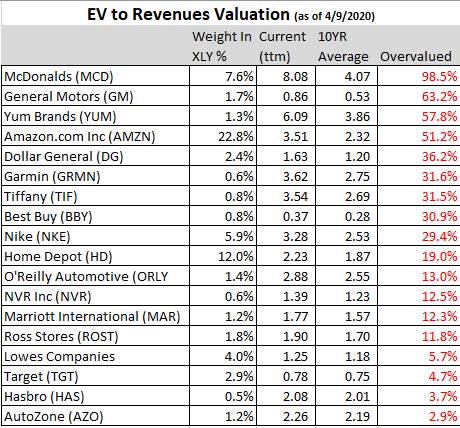
We are also looking at valuation metrics across the underlying holdings of XLY. The challenge here is that without a clear timetable for when the coronavirus outbreak will be contained, there simply isn’t any visibility on the full-year earnings outlook for most companies. Investors are left looking back at the earnings environment before this development and hoping that conditions will normalize through 2021.
One of the issues is that many stocks were trading with rich valuation premiums coming into 2020. Even with the medium stock in XLY is down by 31% year to date, some remain elevated relative to their long-term average valuation multiples.
(source: Data by YCharts/ table author)
We find that 18 stocks in XLY are currently priced at a premium to their respective EV to Revenue 10-year averages. Often there are valid justifications for why stocks can command a higher multiple including an acceleration in growth, higher margins, and an improved earnings outlook. Indeed, some of these companies have become more profitable over the past decade implying each dollar of revenue is more valuable.
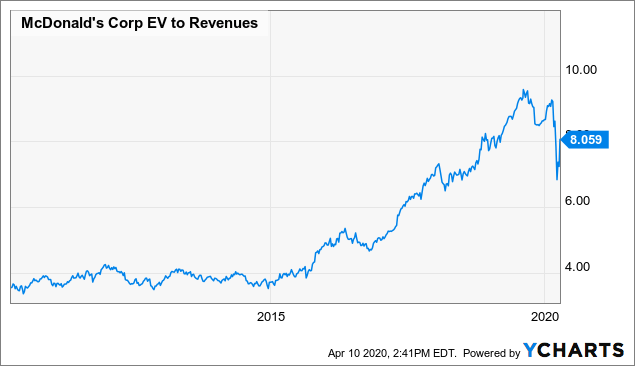
Even excluding Amazon which represents 23% of the fund, the other 17 stocks listed above collectively comprise 47% of total XLY holdings and are all on average 30% above their long-term EV to revenue multiple. Visually, McDonald’s Corp. (MCD) provides a good representation of its relatively high premium. The stock currently trades at 8.1x EV to revenue, nearly double the level from 2015.
 Data by YCharts
We’re not suggesting every company here is a short opportunity, but many appear to remain richly priced despite the growth headwinds going forward. We argue that most companies on average should trade at a narrower spread or a discount to these averages given an outlook for weaker growth and higher uncertainties. Several of the stocks here are also trading at a premium to other valuation multiples. Our point is to highlight that despite the unprecedented economic disruption and extreme market volatility, some stocks are still relatively expensive.
Analysis and Forward-Looking Commentary
The challenge here continues to be the ongoing coronavirus pandemic. Significant uncertainties remain regarding the timetable for the restart of the economy and logistical challenges to resume normal operations of various industries. Current estimates expect the unemployment rate to reach upwards of 32% this quarter. While many jobs will come back when businesses can reopen, it’s also likely not all jobs will return.
The silver lining is that the government is offering a generous relief package through the $2.2 Trillion Coronavirus Cares Act with direct payments to consumers along with additional unemployment benefits. While this should cover living expenses for many individuals, we expect continued weakness in terms of “discretionary spending”.
Looking ahead, the risks are for a longer-than-expected recession with stubbornly high unemployment that lasts through 2021. In this scenario, consumer spending will be pressured highlighting the challenge for companies to reclaim their previous growth trajectory. For retailers, in particular, the key monitoring point will be two-year stacked same-store sales and comparable growth in 2021 compared to 2019 which may now represent the high watermark.
Too Much AMZN
Beyond our market views, the main criticism we have towards XLY is its highly concentrated exposure to Amazon which we believe should be classified within the technology sector. The Amazon Web Services Business segment, “AWS,” comprises over 60% of the company’s total operating income implying the market capitalization associated with the retail business and trends in consumer spending should have lower representation in the sector ETF.
The issue here is that Amazon’s performance has muddled the underlying outlook for the broader consumer discretionary sector as the ETF would be down by more in percentage terms. While most investors won’t complain about the stock’s inclusion given its strong performance, we believe it represents a structural weakness in terms of diversification over the long run. Investors who are bullish on shares of Amazon may simply be better served to trade the individual stock.
Verdict
We take a bearish view on the consumer discretionary sector and the XLY fund. The recent rally in equities off the lows from March may have already priced in much of the upside of the expected recovery in economic conditions through the end of the year. We are looking ahead at 2021 where we see risks tilted to the downside.
Would you like to see our top picks within consumer discretionary?

With the Core-Satellite Dossier, we sort through +4,000 ETFs/CEFs along with +16,000 U.S. stocks / ADRs to find the best trade ideas.
Get access to all our exclusive features including:
- Model portfolios built around different strategies.
- A tracked watchlist of our top picks.
- A weekly “dossier” with an updated market outlook.
- Access to analysts with a live chat
- Exclusive research covering all asset classes and market segments.
Click here for a two-week free trial and explore our content.
Disclosure: I/we have no positions in any stocks mentioned, and no plans to initiate any positions within the next 72 hours. I wrote this article myself, and it expresses my own opinions. I am not receiving compensation for it (other than from Seeking Alpha). I have no business relationship with any company whose stock is mentioned in this article.
Be the first to comment