

Evgenii Mitroshin/iStock via Getty Images
The energy sector ETF (NYSEARCA:XLE) has seen dramatic gains in 2022 but has recently shown signs of cracking. The ETF has fallen nearly 18% since early June as fears of Fed policy mistakes and worries over a recession rise.
This is causing fear of demand destruction to be at the center of investors’ minds because oil prices have also fallen sharply. WTI Crude has dropped by around 11% since early June and trades for less than $110 per barrel.
In recent days, the bets have been piling up that the XLE will drop even further, and given the weakening state of oil prices and rising risk of recession, it seems possible that the XLE could see a significant drop.
Fears Of Recession
The United States Recession Probability Forecast has risen to 31.5, which is still reasonably low. But given that forecast was around 15 in the middle of March, that is a significant jump over a short period of time.
Bloomberg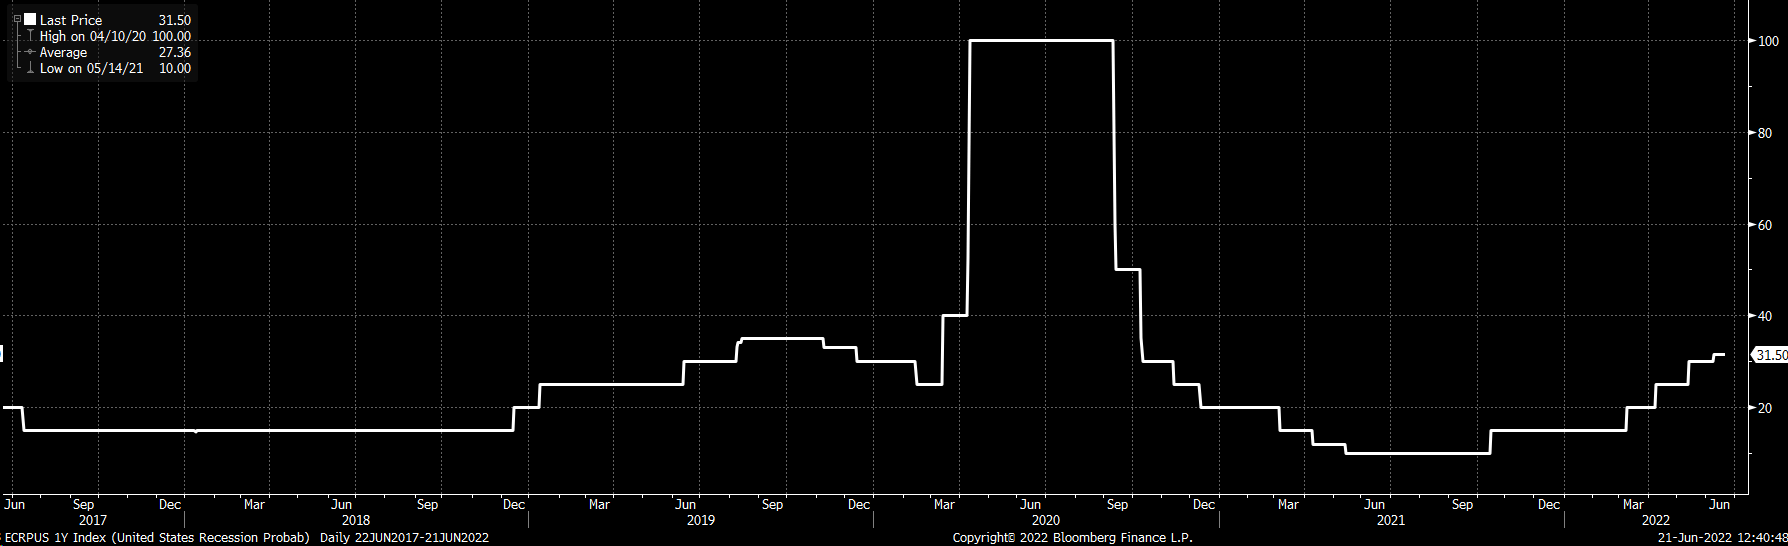
These fears seem to be rising as the Fed embarks on a process of raising interest rates to cool inflation. But as the Fed tightens, investors are becoming more concerned about recession risks due to the Fed making a mistake.
Betting The XLE Drops
Should these recession risks continue to rise, they are likely to weigh heavily on oil prices and the energy sector. These fears could be prompting traders to make a slew of bearish bets on the XLE over the next several weeks. The open interest levels for the September 16 $55 and $65 puts rose by around 16,000 contracts apiece on June 17. The data shows the $55 puts were sold on the BID for about $0.76 per contract. Meanwhile, the $65 puts were bought on the ASK at $2.01 per contract. In total, the trader paid about $1.25 per contract to create the bearish bet and paid around $2 million in premiums. The trader would need the XLE to drop below $63.75 to earn a profit if holding the contracts until the expiration date.
Additionally, the open interest for the October 21, $52, and $62 puts rose by around 16,000 contracts on the same day. The data shows the $52 puts were sold on the BID for approximately $0.84 per contract. Meanwhile, the $62 puts were bought on the ASK for around $2.11 per contract. Again, the trader paid around $1.25 per contract and approximately $2 million in premiums for this bearish bet. In this case, the XLE would need to drop to below $60.75 to start earning a profit if holding the options until the expiration date.
The Technicals Are Breaking Down
The technical chart looks very weak for the XLE and shows that the ETF has recently fallen below a series of uptrends. While one could argue for the XLE to rebound and fill a technical gap around $81, the trends do not favor a sustained advance. The sharp drop through multiple uptrends suggests that the current uptrend has broken, and a new downtrend is likely taking shape.
The relative strength index is flashing a bearish divergence, after making a lower higher in early June, despite the ETF’s new high. The deviation indicates that ETF is losing significant momentum and that a change in trend may be forming over the longer term.
For now, the $73 region is helping to support the ETF. Once that breaks, the next level of support comes around $70 and then down at $65.50.
TradingView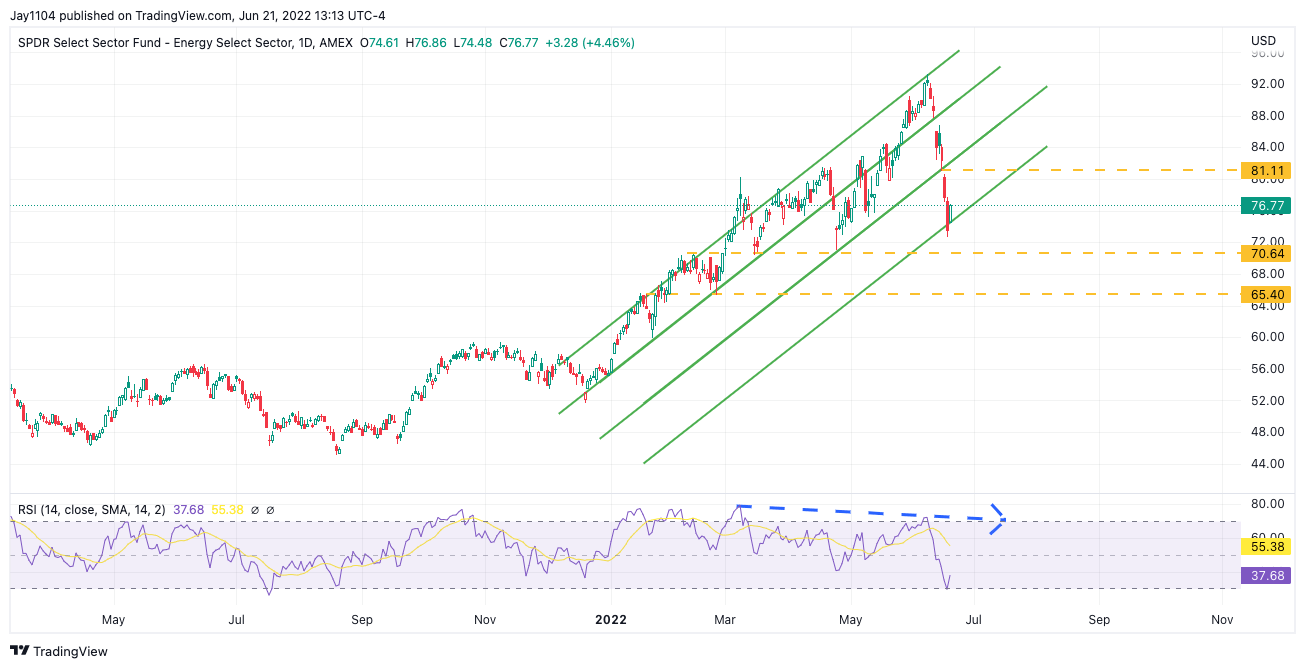
The move higher in the energy sector in 2022 has been incredible. But if talks of a Fed policy mistake or recession continue to build for the US, the odds seem to favor oil prices dropping. If that happens, the XLE will likely suffer just as severely, if not worse, than a drop in oil prices.
Join Reading The Markets Risk-Free With A Two-Week Trial!
Investing today is more complex than ever. With stocks rising and falling on very little news while doing the opposite of what seems logical. Reading the Markets helps readers cut through all the noise delivering stock ideas and market updates, looking for opportunities.
We use a repeated and detailed process of watching the fundamental trends, technical charts, and options trading data. The process helps isolate and determine where a stock, sector, or market may be heading over various time frames.
To Find Out More Visit Our Home Page

Be the first to comment