

Darren415/iStock via Getty Images
Written by Nick Ackerman, co-produced by Stanford Chemist. This article was originally published to members of the CEF/ETF Income Laboratory on April 4th, 2022.
XAI Octagon Floating Rate & Alternative Income Term Trust (NYSE:XFLT) has been quite volatile as of late. Since we last covered the fund, the premium has expanded a bit further. However, based on the 1-year z-score, we are almost flat at -0.10, which indicates it isn’t necessarily overly expensive either.
We have also been seeing some weakness at the NAV level. That, of course, is the net asset value, what everything would be worth if the fund were liquidated today. XFLT is the only CLO fund that provides a daily NAV to help value the fund. However, it isn’t a pure-play CLO and holds a sleeve of senior loans too. Which essentially is what CLOs are themselves. They are mostly packaged up loans and then divided into different tranches. We touched on that with a diagram in our previous article.
Thanks to the daily reporting of the NAV, though, we can see that it has been declining. It would appear that geopolitical risks have been hitting this fund harder. I suspect that the other CLO funds that provide an estimated monthly NAV will also be lower when they report. Since senior loans are taken out from below-investment-grade rated companies, they are more susceptible to global economic weakness. Not to mention that with rates rising, some investors are getting nervous that a recession could be on the horizon. Recessions and junk-rated companies don’t often mix well.
Due to the significant volatility, an investor likely wouldn’t have to wait long to invest in XFLT at a better price. So for those patient investors out there, they might not have to jump on this fund at today’s price. On the other hand, going back to the interest rate rising discussion, XFLT could be better positioned to take advantage of that event. This is because the underlying portfolio of senior loans and CLOs are predominately floating rate-based. Meaning that the fund could see higher income generation as rates rise.
The Basics
- 1-Year Z-score: -0.10
- Premium: 10.43%
- Distribution Yield: 10.34%
- Expense Ratio: 3.86%
- Leverage: 39.82%
- Managed Assets: $411.96 million
- Structure: Term (anticipated liquidation date December 31st, 2029)
XFLT’s objective is to “seek attractive total return with an emphasis on income generation across multiple stages of the credit cycle.”
They will do this through “a dynamically managed portfolio of floating-rate credit instruments and other structured credit investments within the private markets. Under normal market conditions, the Trust will invest at least 80% of managed assets in senior secured loans, CLO debt and CLO equity.”
Since our previous article, they have provided a prospectus supplement. This was due to an at-the-market offering that they have set up to “offer and sell up to 18,300,000 common shares.” This might cause concern to some investors since that could lead to “dilution.” Except for in CEFs, when funds can sell shares at a premium, that’s generally the best course of action.
Sure, your voting rights will be diluted – but the positives outweigh the negatives. If we are being honest, most of us won’t be holding enough shares to really swing a vote anyway. In this case, we still benefit from shares being sold at a premium that is accretive to NAV and can translate into higher earnings.
Another benefit is that the fund also grows larger, which could mean increased trading volume.
These ATM offerings are in addition to the fund pulling secondary offerings in the past. An ATM offering works a bit similar but is made throughout the trading day. The secondary offerings are announced, and shares generally drop instantly. So in that way, at-the-market offerings are nearly as disruptive.
The fund’s expense ratio relative to other CEFs seems preposterous. However, it’s the best deal you’ll get in the CLO space. They don’t have any incentive fees, which keeps their expense ratio lower than the other CLO pure-play funds. Without leverage expenses, the fund’s expense ratio comes to 3.94%. When including leverage, it comes to 5.86%.
They have leverage in the form of a preferred offering, 6.50% Series 2026 Term Preferred Shares (XFLT.PA). This is quite a high expense for leverage but also won’t be impacted by higher rates. Though they also have borrowings through a credit facility too. That is subject to higher rates when interest rates rise since it is based on one-month LIBOR plus 1.25%. That facility maturity date is March 22nd, 2023. So we still have around a year before that is renegotiated.
Performance – Premium Inched Higher
When we last covered the fund, it stood at a 6.88% premium. Now we are seeing a 10.43% premium. As mentioned above, though, the fund has been quite volatile. That has translated into the fund’s premium also moving around quite aggressively.
Ycharts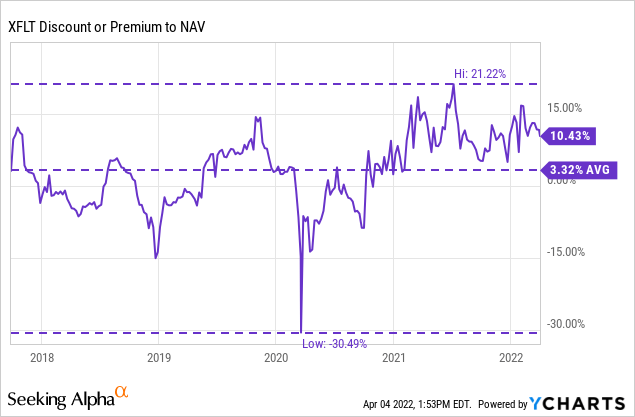
Going back to the fund’s inception, we can see that a premium price isn’t too uncommon for the shares. It has spent some time trading at discounts, but these were relatively brief. In 2020, we see the most noteworthy discount as the fund plunged to an over 30% discount. That type of deal didn’t stick around long, though. We also can see that since then, the fund’s premium has remained elevated once it recovered from those lows. That’s why even at a 10%+ premium, it doesn’t seem to be presenting a time that one needs to sell immediately either.
The fund can have some massive drawdowns in times of volatility. That’s exactly what we can see with the discount/premium level of the fund. Below is a chart from inception to now on the fund’s performance. On a price and NAV basis only, the fund has declined. When including the distributions for looking at total return figures, we see a different story.
Ycharts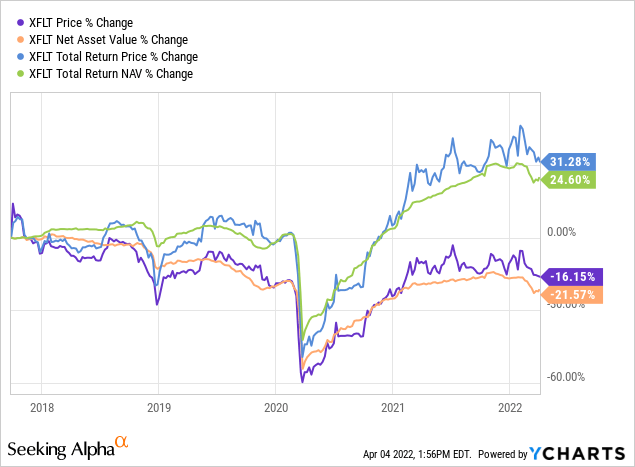
Most investors looking to invest in XFLT will be more focused on the distribution and not the gains or losses anyway. Though at some point, too many losses on the NAV level could mean lower distributions for shareholders.
Distribution – Attractive Monthly Payout
At this time, despite the decline in the NAV since inception, XFLT is paying the same amount that it reached during the pre-COVID crash. Throughout 2020, they didn’t cut their distribution, but once they raised again, it was back to the prior level. For some investors, that rules this fund out. However, I believe it was necessary for this fund to be in a better position after.
XFLT Distribution History (CEFConnect)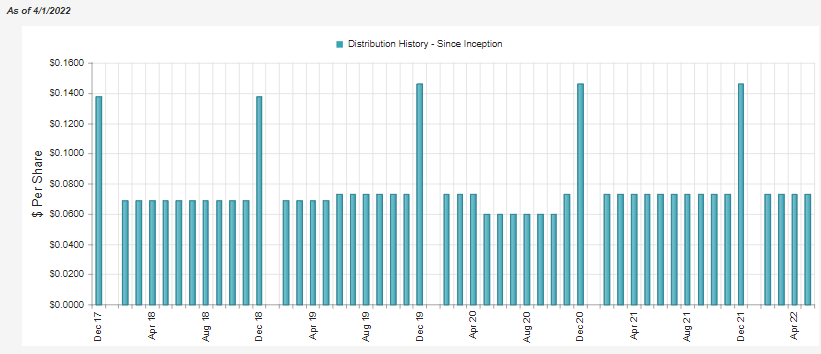
At this time, the distribution rate is 10.34%. On a NAV basis, it works out to 11.42%. Which is generally above my normal caution area of a 10% level. However, their coverage has also been rather strong.
Since they’ve been growing with ATM and secondary offerings, then the preferred shares they issued, it can be a bit harder to follow the earnings. That being said, at the end of their prior fiscal year, they had net investment income coverage of nearly 88%.
XFLT Annual Report (XA Investments)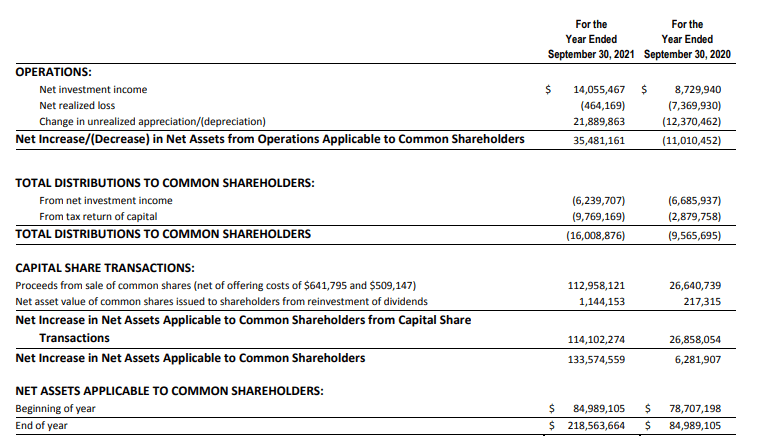
Ideally, for a more fixed-income type of fund, we would want to see NII coverage at over 100%.
They provided a quarterly update for the three months ended December 31st, 2021. At that time, we see that NII coverage has dipped to around 68%. It can be helpful for a quarterly update on funds. However, a full year or at least even six months is a better gauge of coverage.
XFLT Quarterly Update (XA Investments)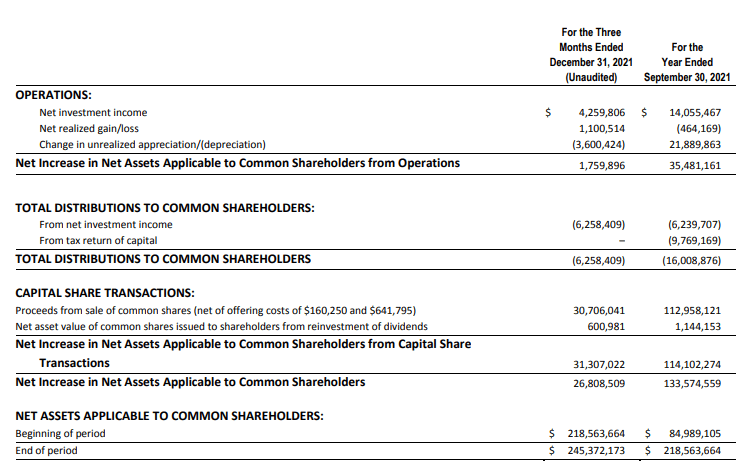
XFLT would probably be a better fit for a tax-sheltered account for tax purposes. Most of the interest they generate from their underlying portfolio is going to be identified as ordinary income. That being said, 2021 showed a significant portion of the distribution identified as return of capital. That could have come from the material amount of losses realized from the previous year. Going forward, that shouldn’t be a regular event.
XFLT’s Portfolio
The fund was very busy in its first couple of years. Since then, their turnover rate has been more subdued, relatively speaking. With their quarterly update, they noted an 8% rate. For the fiscal year 2018, it was as high as 119%. That was then followed up in 2019 by a 94% turnover rate.
Taking a look at the end of February 2022, we see that senior secured first-lien loans make up the bulk of their portfolio. CLO equity also makes up a meaningful allocation, which is followed up by CLO debt.
XFLT Asset Allocation (XA Investments)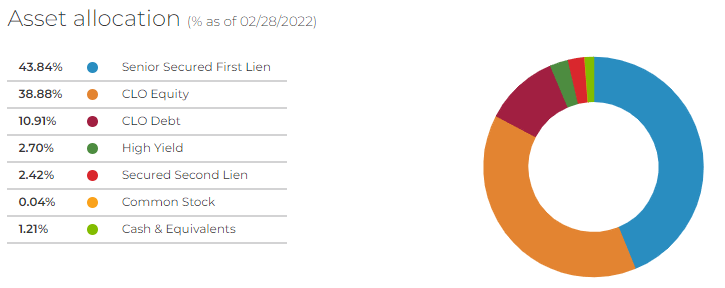
Overall, these top allocations haven’t seen a drastic change from the previous update at the end of October 2021. What has been notable was that cash and equivalents made up around 10.25% of the fund previously. That has now been drained down to a more reduced level. This allocation went across the board, as all the other asset allocations bumped up a bit.
The fund reports that at the end of February 2022, they have a total of 448 positions. That’s down only a touch from the 460 previously. In addition to that, the average bond price as a percentage of par comes to 92.34%. That’s down from 94.80%. That tells us that some of the NAV declines in their portfolio have simply been the discounts widening out in the underlying loans.
They also put the effective maturity at 8.51 years. That is extended from the 7.48 years the fund had previously. Again, as mentioned above, the underlying is predominantly in floating rate-oriented loans and CLOs that hold senior loans. Therefore, the maturity of the portfolio isn’t going to be too detrimental in terms of the duration of the fund. Here is from their last Annual Report:
The Trust remains conservatively positioned in terms of duration; the vast majority of the Trust’s portfolio is invested in floating‐rate or adjustable securities based on changes in LIBOR…
XFLT Maturity Breakdown (XA Investments)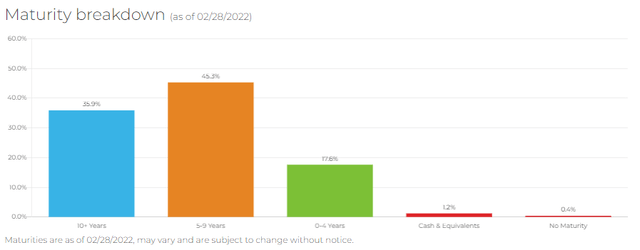
Conclusion
XFLT is a bit elevated based on its longer-term history. However, the fund also isn’t screaming to sell yet, at least in my opinion. The more recent trading range has put XFLT at a fairly substantial premium quite consistently. Investors seem to appreciate the higher income that the fund can generate from their underlying CLO and senior loan portfolio. However, coverage isn’t quite 100%, so this will be something to continue to monitor as new data becomes available.
Be the first to comment