

Recommended by Zain Vawda
Understanding the Core Fundamentals of Oil Trading
WTI Fundamental Outlook
Crude Oil is on the march higher this morning following yesterday’s less than stellar start to the week. Losses incurred yesterday were not enough to prevent WTI posting its first month of gains since May. Today’s rally coincided with better-than-expected Caixin Manufacturing PMI numbers out of China, potentially renewing hope around persistent demand concerns.
In a further boost from China in regard to its “Zero-Covid” policy, Chinese city Zhengzhou which plays host to Foxxconn’s iPhone factory announced the loosening of some covid controls from 6AM this morning. There still remains skepticism around demand from China as crude imports in the first three quarters of the year declined for the first time since 2014. YoY imports declining around 4.3%. This is undoubtedly an area of concern as WTI prices look to make their way higher.
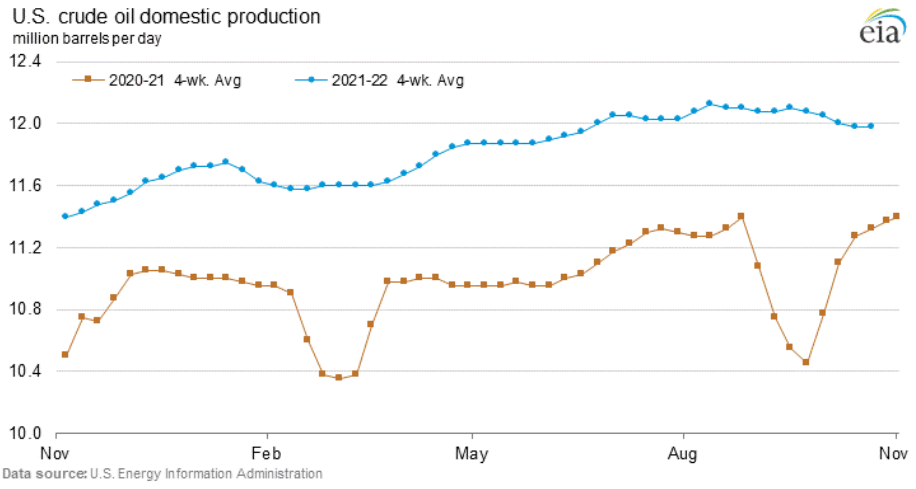
WTI Crude Oil-US Domestic Production
The continued back and forth between OPEC+ and the United States continues following the announced production cuts on October 5th. The US responded in kind with a 1.9 million barrels release from the strategic petroleum reserve (SPR) last week which did not seem to have the desired effect on oil prices. This comes as US crude production rose 0.9% in August to 11.98 million barrels a day, its highest since the beginning of the pandemic. OPEC+ for its part looks likely to announce further cuts to production moving forward as it expects a slowdown in demand from the Eurozone as a recession looms and winter approaches.
Trade Smarter – Sign up for the DailyFX Newsletter
Receive timely and compelling market commentary from the DailyFX team
Subscribe to Newsletter
The remainder of the week brings a lot of promise in terms of volatility as well as in regard to WTI’s next move. We first have crude oil inventory data from EIA on Wednesday followed by the Federal Reserve meeting expected to provide clues as to the tightening cycle and US outlook for the rest of the year. Any hint of dovishness from Fed policymakers could propel WTI higher.
WTI Crude Oil Daily Chart – November 1, 2022
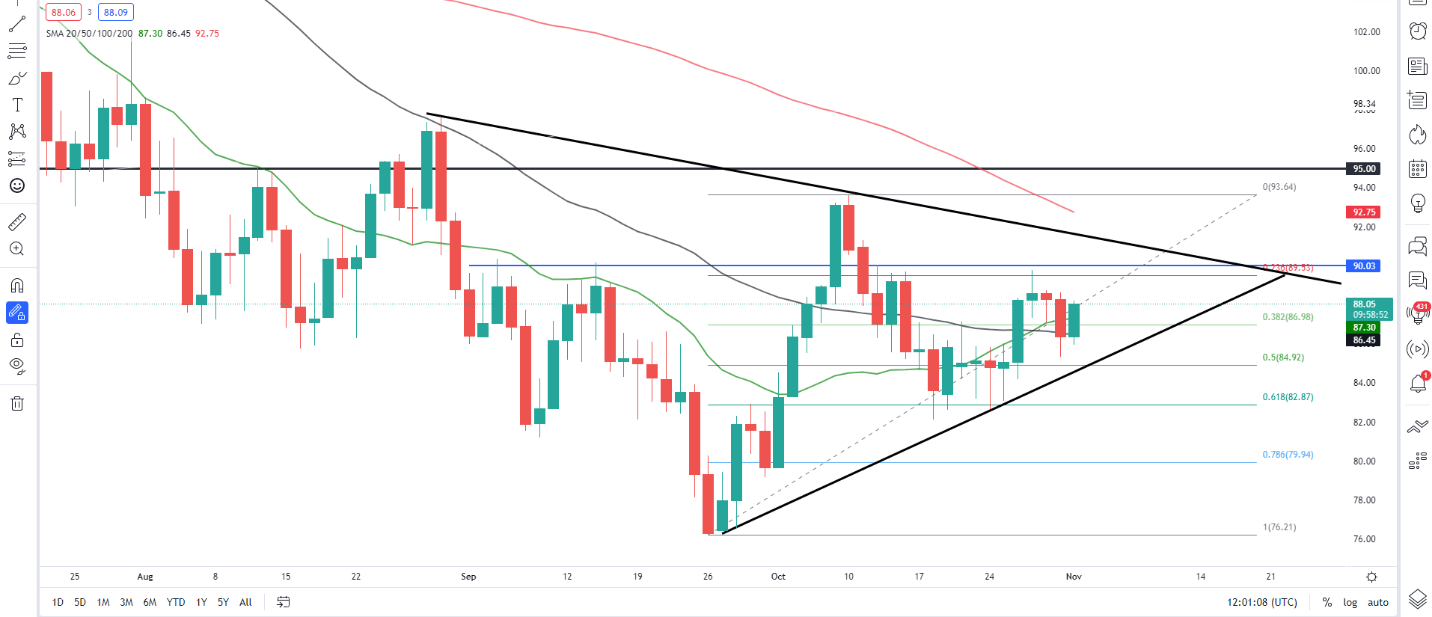
Source: TradingView
From a technical perspective, WTI arrested its slide on the monthly timeframe with its first month of gains since May. The positive month propelled the price back above the 20-SMA having dipped below it in September. The weekly reinforced the idea of higher prices with a bullish engulfing candle close above the 38.2% fib level.
The daily timeframe gives us a good view of the triangle pattern in play. A breakout could occur as early as this week given the host of data events expected. A bullish daily candle close should see price remain above the 20 and 50-SMA while maintaining momentum with the $90.00 psychological level back in play.
Introduction to Technical Analysis
Technical Analysis Chart Patterns
Recommended by Zain Vawda
Resources for Traders
Whether you are a new or experienced trader, we have several resources available to help you; indicators for tracking trader sentiment, quarterly trading forecasts, analytical and educational webinars held daily, trading guides to help you improve trading performance, and one specifically for those who are new to forex.
Written by: Zain Vawda, Market Writer for DailyFX.com
Contact and follow Zain on Twitter: @zvawda
Be the first to comment