

S&P 500, US Bond Yields Analysis and Talking Points
- S&P 500 Posts Worst H1 Return Since 1970, Will H2 Be Any Better?
- Markets Transitioning From Inflation Scare to Recession Risks, Good News For Bonds
The S&P 500 has posted its worst H1 return since 1970. For many investors, they will be glad to see the back of H1. The question now is whether H2 will be any better?. However, unless you are nostradamus, it is a known unknown how equity markets will perform in the next six months. What we can do is take a look at the top 10 worst H1 performances for stocks, which 2022 now slots into at number four (Figure 1.), and see how equities performed in H2. Of course, I am aware that past performance does not equal future results, but, we can take lessons from the past and use it as a loose guide.
Figure 1. Top Worst H1 Performances in the S&P 500 Since 1928
Source: Refinitiv, DailyFX
As shown in the table above, the S&P 500 has generally had a modest bounce back in Q3, averaging 7.7%, following an average H1 drawdown of over 20%. From current levels a 7% rise in the index takes us back just above 4000. Now while this is not an unreasonable target, it is important to note that this does not change my current bias, which remains to fade rallies. This bias will remain until the Fed pivots away from its aggressively hawkish stance, and while we have seen some encouraging inflation data with Core PCE edging lower again, alongside the continued softness in commodities. For now, the Fed remains laser focused on headline CPI, which remains the most important monthly economic data.
Elsewhere, we do appear to be transitioning from one regime of inflation scare to another regime of rising recession risks, which in turn is starting to see bonds finally work as an equity drawdown hedge. In turn, this makes the outlook for bonds more attractive, particularly now that we are seeing market based inflation expectations drift lower. Looking ahead, eyes will be on the ISM Manufacturing PMI survey as market participants attempt to gauge the extent of the current slowdown in activity.
US 10Y Yield: Weekly Time Frame
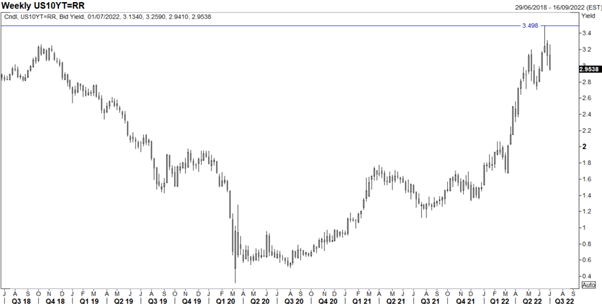
Source: Refinitiv
S&P 500 Chart: Daily Time Frame
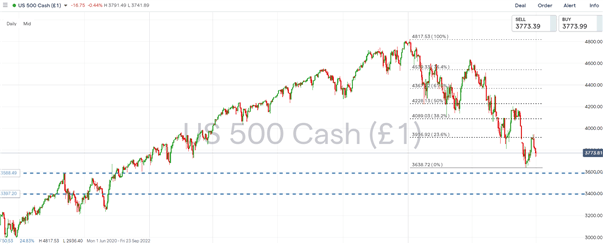
Source: Refinitiv
Be the first to comment