

Spencer Platt/Getty Images News
Several months ago, I wrote a piece suggesting the S&P 500 (NYSEARCA:SPY) was in a three wave bearish structure towards 3380 commencing with the break of major support at 4105. Despite numerous attempts to climb higher and form a macro bullish wave pattern, the reality is that the macroeconomic news simply won’t allow anything bullish to hold as the market has had no other option than to keep dropping as the pessimistic data keeps coming.
Recently, the Jackson Hole speech sent this market into a tailspin as the Fed must pull the plug on its previous tactic of printing money as a way of growing the economy through cheap lending since the financial crisis. As inflation gets out of control, the Fed must significantly raise interest rates in order to tame a problem that, if anything, seems to be getting worse.
After months of bumper jobs data sparking concerns of a wage spiral, October’s sobering non-farm payroll announcement was likened to turning the lights up full at a late night party. CPI data released last week confirmed this isn’t a flash in the pan either with a hotter than expected number while lingering in the background are macroeconomic issues like the question whether Oil has settled medium- to long-term around the $80 region or possibly lower and tensions between Ukraine and Russia potentially moving into a different dimension.
In fact, this week the S&P 500 came within 100 points of completing its bearish third wave target and the coming weeks will make for interesting viewing of whether it will actually hit that number and, more importantly, what it will do next should it do so.
Now we will analyze firstly the monthly chart before moving to the weekly to see if we can gauge this market’s next move.
Below we can see the bearish wave one 4482-4105 with the Fibonacci 161 lying at 3663 and the numerical copy of wave one being the target 3389.
SPY monthly (C Trader)
The market has seemingly not chosen to bounce off the 161 area although it did make a bullish play from that region, the CPI data released that week has seen a drop with the intent of eradicating the bullish sentiment.
Significantly, the weekly bearish wave pattern we are about to examine is actually the first direct lower low since the original bearish weekly wave pattern from the high of 4482. The other weekly wave patterns since the market topped have all been with bullish intent and this structure was actually formed with bearish intent.
SPY weekly (C Trader)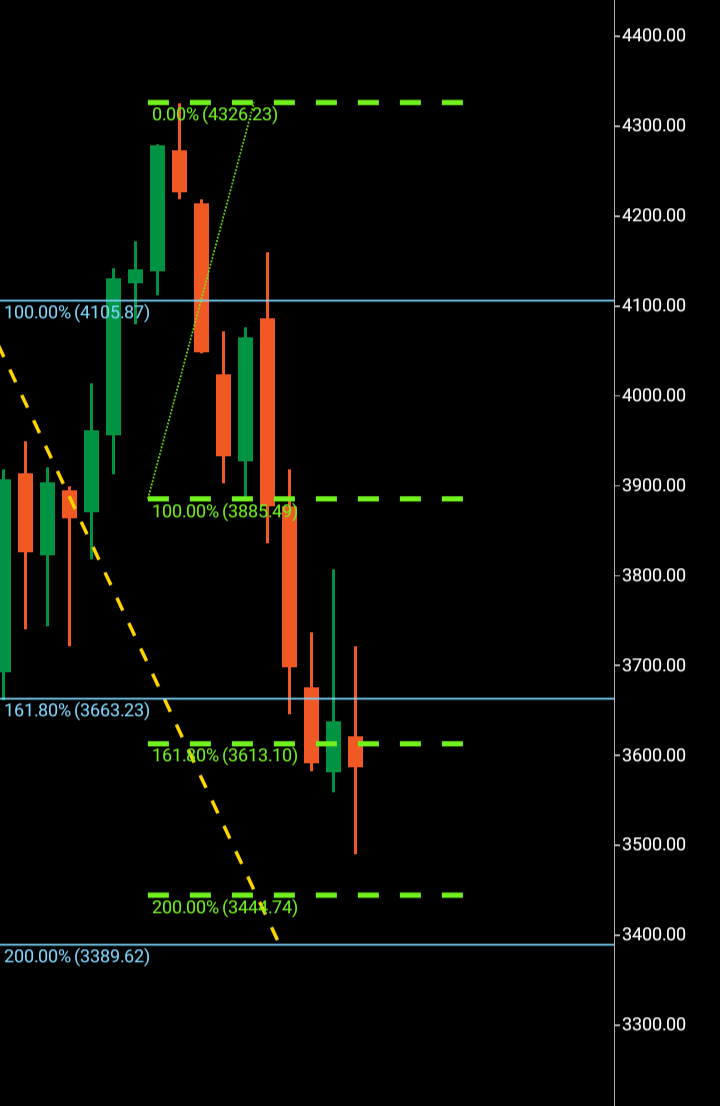
We can see the weekly wave one 4326-3885 with a full bodied bullish candle paving the way for the third wave at 3385. A bullish candle without a bottom wick in a bearish structure signals that price floated higher rather than was driven higher with buying orders. It is often the case a financial market will form a bullish candle in this fashion allowing for a further drop south.
Confluence in this case isn’t exact with the monthly chart with a third wave completion for this weekly pattern at 3444, which is roughly 60 points away from the monthly target.
To summarize, until the market shows signs of a bullish turnaround that can actually hold, I would expect the S&P 500 to complete its macro third wave at 3389 in the near future if it is going to do so. Given that I initiated a sell rating months ago at the break of major support, I am issuing again a hold given how near target the market is to its third wave completion. I will be looking for both bullish signals should the market make target and alternatively charting an additional bearish scenario if there are shallow bullish signals at the 3380 area. Given the nature of the bearish weekly pattern the S&P 500 has just formed, it is possible things could get worse for this market.
About the Three Wave Theory
The three wave theory was designed to be able to identify exact probable price action of a financial instrument. A financial market cannot navigate its way significantly higher or lower without making waves. Waves are essentially a mismatch between buyers and sellers and print a picture of a probable direction and target for a financial instrument. When waves one and two have been formed, it is the point of higher high/lower low that gives the technical indication of the future direction. A wave one will continue from a low to a high point before it finds significant enough rejection to then form the wave two. When a third wave breaks into a higher high/lower low, the only probable numerical target bearing available on a financial chart is the equivalent of the wave one low to high point. It is highly probable that the wave three will look to numerically replicate wave one before it makes its future directional decision. It may continue past its third wave target, but it is only the wave one evidence that a price was able to continue before rejection that is available to look to as a probable target for a third wave.
Be the first to comment