

Galeanu Mihai/iStock via Getty Images
By Zhaoyi Yang, Fixed Income Research, FTSE Russell
Favorable factors such as relatively higher yields vs G7 government bonds and a defensive currency, have helped Chinese government bonds outperform in 2021.
Compared to G4 and global government bonds, Chinese government bonds have registered higher quarterly, and annual, returns for both domestic and dollar-based investors, as Table 1 shows. In particular, they provided a safe haven during the Covid reflation trade in Q1 2021, when the World Government Bond Index (WGBI) registered its worst quarterly returns since Q4 2016. It could also be surprising to note that the Chinese sovereign bonds’ returns almost matched those of US high yield credit bonds for the year (5.1% vs 5.4%),with the strong yuan boosting their returns to 7.9% in US dollar terms. From a risk perspective, the Chinese government bond index has also provided favorable risk-adjusted returns since 2009, as discussed in previous research[1], and also during 2021, with consistently low standard deviations.
FTSE Russell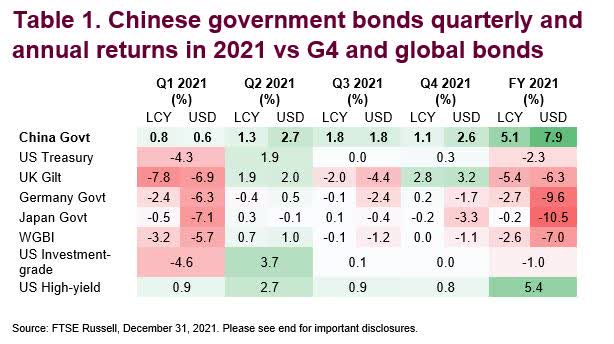
Chinese sovereign yield spreads remain under the spotlight, with a dovish PBoC vs a hawkish Fed, continuing into 2022
Chinese government yield spreads vs other major bond markets fell sharply in 2021, as shown in Chart 1, particularly so, in Q1 2021, when G7 yield curves steepened in the reflation trade, while the PBoC stayed firmly on hold through the year. Despite spreads returning to pre-Covid levels as G7 bond yields surged (Chart 1), Chinese yield premia over G7 yields remained substantial, i.e., Chinese government yield spreads vs US Treasuries mean-reverted to about 140 basis points, from a high level relative to history.
The unexpected move by the PBoC in its January 2022 open market operations, when it lowered both the Medium-term Lending Facility rate, or MLF, and the 7-day reverse repurchase rate by 10 basis points, highlighted the dovish tone by the central bank, which promised to support the real economy facing strong economic headwinds. As in other sovereign bond markets, Chinese bond yields have historically tracked the monetary policy interest rates. Therefore, easier monetary policies have led to an expectation of the yield spread narrowing further in the year ahead, given the anticipated interest rates hike by hawkish Fed. Chinese 7-10 year yield spreads over US Treasuries 7-10 year reached a 32-month low in January 2022, at 99 basis points, following the rate cut.
FTSE Russell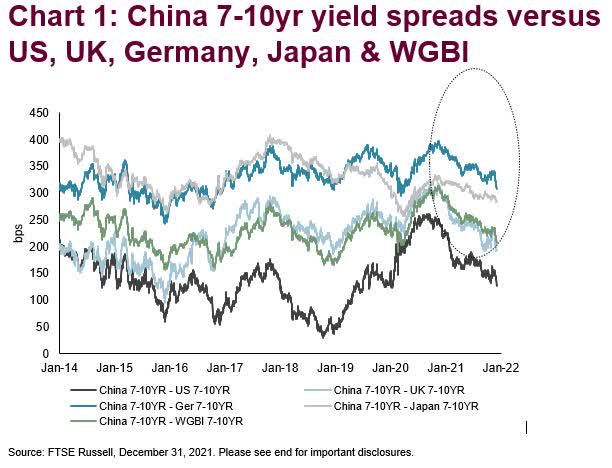
Currency risk persists for foreign investors, although renminbi has demonstrated some resilience in 2021 vs the US dollar, compared to vulnerable EM currencies
Investors of renminbi-denominated bonds are exposed to currency risks, if based in other currencies, and currency hedging costs vary according to the home currency of investors. As substantial trade surplus, large currency reserve and capital inflows may continue to support the renminbi, the Fed’s tightening policy to counter rising inflation could boost the US dollar, to some extent, through higher interest rates. One may argue that narrower bond yield spreads between China and the US have been mostly accompanied by a stronger US dollar historically. Therefore, the renminbi is likely to depreciate in 2022 should history repeat itself, given that the divergence in monetary policy between central banks is expected to further close the yield gap. However, recent history since January 2021, as shown in Chart 2, seems to suggest the opposite, with renminbi holding up well following tighter spreads. This inconsistency, perhaps due to Chinese monetary policy frontrunning that of the Fed (and other major central banks), leaves some uncertainty on the CNY/USD currency movement as economic recoveries remain mixed globally.
More importantly, it is worth bearing in mind that the PBoC will make its efforts in pivoting the renminbi value if it floats outside of its defined ranges, as maintaining stability within the economic growth and the exchange rate is the base line.
FTSE Russell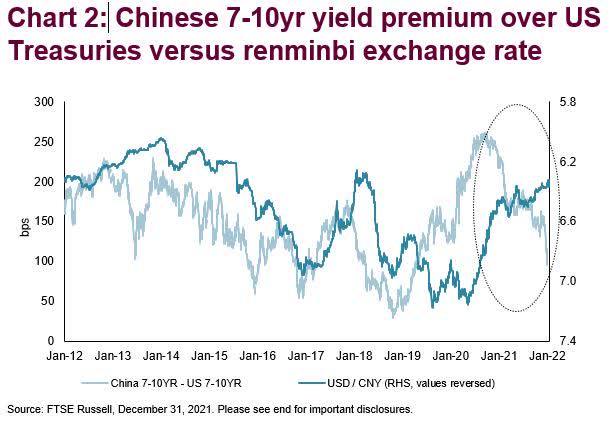
Relatively lower, but steadily growing, foreign participation suggests potential in interests by overseas investors
In addition to its higher yields in the current low-yield world, Chinese government bond yields have a low correlation with those of G7, and thus the portfolio diversification benefits may also have attracted foreign investors into the Chinese government bond market, which is less exposed to the global financial cycle. Independent policy regimes, as again proved during the Covid shock since March 2020, and the lower foreign ownership of Chinese government bonds, at about 10%, could help to explain the limited connectivity between China and other major bond markets. Inclusion of Chinese government bonds in global bond indices is another key driver, as ‘passive’ approaches to portfolio management become more important, in particular when matching the market’s weighting is required.
Regulatory reforms since 2016 have substantially improved foreign access to the Chinese onshore bond market, including improved market facilities for overseas investors to hedge out currency exposure, therefore boosting foreign participation, particularly so in recent years. Also, tax benefits are offered to attract foreign investment to the domestic bond market, such as the extension of tax exemption on bond interests for foreign institutional investors until the end of 2025. Apart from the increasing foreign ownership to above 10% latest, compared to only 2% in 2014, the fact that 80% of net issuance of Chinese government bonds in the primary market were purchased by foreign investors, in the first seven months in 2021 may be another evidence of the active participation by international investors in this market. It is widely believed there is more potential for the market to open to overseas investors in the future, with more measures and enhancements to be introduced into China’s financial market (e.g., if open-ups in the bond derivative or repurchase market are applied).
[1] Chinese bond market: Evolution and characteristics, July 2020.
© 2022 London Stock Exchange Group plc and its applicable group undertakings (the “LSE Group”). The LSE Group includes (1) FTSE International Limited (“FTSE”), (2) Frank Russell Company (“Russell”), (3) FTSE Global Debt Capital Markets Inc. and FTSE Global Debt Capital Markets Limited (together, “FTSE Canada”), (4) MTSNext Limited (“MTSNext”), (5) Mergent, Inc. (“Mergent”), (6) FTSE Fixed Income LLC (“FTSE FI”), (7) The Yield Book Inc (“YB”) and (8) Beyond Ratings S.A.S. (“BR”). All rights reserved.
FTSE Russell® is a trading name of FTSE, Russell, FTSE Canada, MTSNext, Mergent, FTSE FI, YB and BR. “FTSE®”, “Russell®”, “FTSE Russell®”, “MTS®”, “FTSE4Good®”, “ICB®”, “Mergent®”, “The Yield Book®”, “Beyond Ratings®” and all other trademarks and service marks used herein (whether registered or unregistered) are trademarks and/or service marks owned or licensed by the applicable member of the LSE Group or their respective licensors and are owned, or used under licence, by FTSE, Russell, MTSNext, FTSE Canada, Mergent, FTSE FI, YB or BR. FTSE International Limited is authorised and regulated by the Financial Conduct Authority as a benchmark administrator.
All information is provided for information purposes only. All information and data contained in this publication is obtained by the LSE Group, from sources believed by it to be accurate and reliable. Because of the possibility of human and mechanical error as well as other factors, however, such information and data is provided “as is” without warranty of any kind. No member of the LSE Group nor their respective directors, officers, employees, partners or licensors make any claim, prediction, warranty or representation whatsoever, expressly or impliedly, either as to the accuracy, timeliness, completeness, merchantability of any information or of results to be obtained from the use of FTSE Russell products, including but not limited to indexes, data and analytics, or the fitness or suitability of the FTSE Russell products for any particular purpose to which they might be put. Any representation of historical data accessible through FTSE Russell products is provided for information purposes only and is not a reliable indicator of future performance.
No responsibility or liability can be accepted by any member of the LSE Group nor their respective directors, officers, employees, partners or licensors for (a) any loss or damage in whole or in part caused by, resulting from, or relating to any error (negligent or otherwise) or other circumstance involved in procuring, collecting, compiling, interpreting, analysing, editing, transcribing, transmitting, communicating or delivering any such information or data or from use of this document or links to this document or (b) any direct, indirect, special, consequential or incidental damages whatsoever, even if any member of the LSE Group is advised in advance of the possibility of such damages, resulting from the use of, or inability to use, such information.
No member of the LSE Group nor their respective directors, officers, employees, partners or licensors provide investment advice and nothing contained in this document or accessible through FTSE Russell Indexes, including statistical data and industry reports, should be taken as constituting financial or investment advice or a financial promotion.
Past performance is no guarantee of future results. Charts and graphs are provided for illustrative purposes only. Index returns shown may not represent the results of the actual trading of investable assets. Certain returns shown may reflect back-tested performance. All performance presented prior to the index inception date is back-tested performance. Back-tested performance is not actual performance, but is hypothetical. The back-test calculations are based on the same methodology that was in effect when the index was officially launched. However, back- tested data may reflect the application of the index methodology with the benefit of hindsight, and the historic calculations of an index may change from month to month based on revisions to the underlying economic data used in the calculation of the index.
This publication may contain forward-looking assessments. These are based upon a number of assumptions concerning future conditions that ultimately may prove to be inaccurate. Such forward-looking assessments are subject to risks and uncertainties and may be affected by various factors that may cause actual results to differ materially. No member of the LSE Group nor their licensors assume any duty to and do not undertake to update forward-looking assessments.
No part of this information may be reproduced, stored in a retrieval system or transmitted in any form or by any means, electronic, mechanical, photocopying, recording or otherwise, without prior written permission of the applicable member of the LSE Group. Use and distribution of the LSE Group data requires a licence from FTSE, Russell, FTSE Canada, MTSNext, Mergent, FTSE FI, YB and/or their respective licensors.
Editor’s Note: The summary bullets for this article were chosen by Seeking Alpha editors.
Be the first to comment