

herkisi
This article was published on Dividend Kings on Tuesday, December 20th.
—————————————————————————————
Safe dividends are one of my greatest passions. That’s because dividend growth stocks are historically the best way to generate passive income and life-changing wealth.
Legacy Research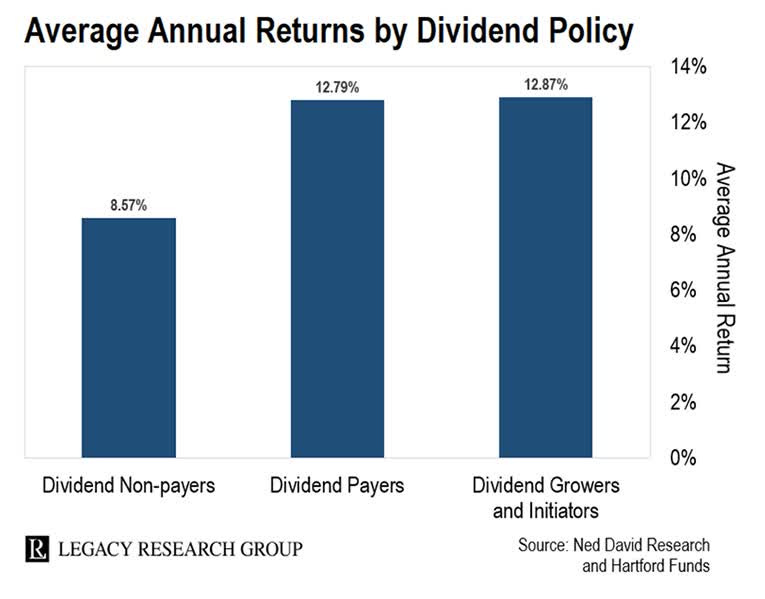
Over the last five years, dividend growth stocks have delivered 7X more inflation-adjusted wealth than non-dividend stocks.
The Dividend Kings 500 Master List includes some of the world’s best companies, including:
- every dividend champion (25+ year dividend growth streaks, including foreign aristocrats)
- every dividend aristocrat
- every dividend king (50+ year dividend growth streaks)
- every Ultra SWAN (as close to perfect quality companies as exist)
- the 20% highest quality REITs according to iREIT
- 40 of the world’s best growth blue-chips.
One of the growth stocks we cover is Tesla, Inc. (NASDAQ:TSLA), which basically kickstarted the electric vehicle (“EV”) revolution by making electric cars cool and desirable.
Several Dividend Kings members asked me for an update on Tesla, which is suffering its worst bear market in history.
Ycharts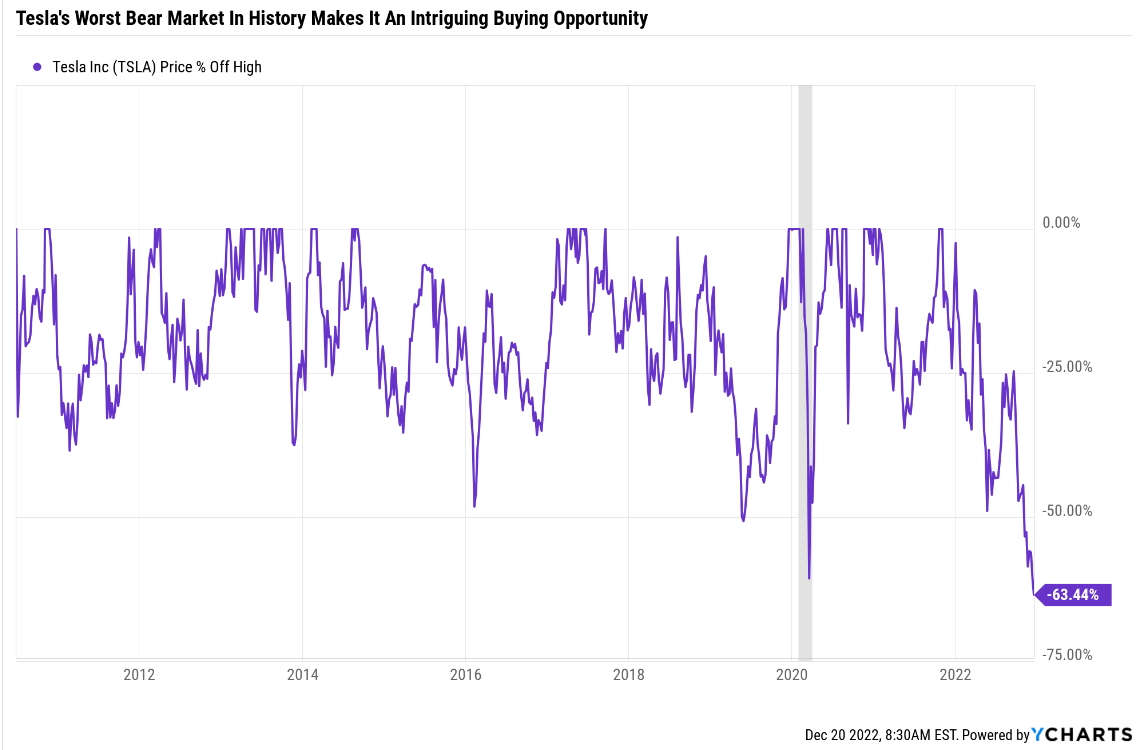
Many reasons have contributed to Tesla’s plunge:
FAST Graphs, FactSet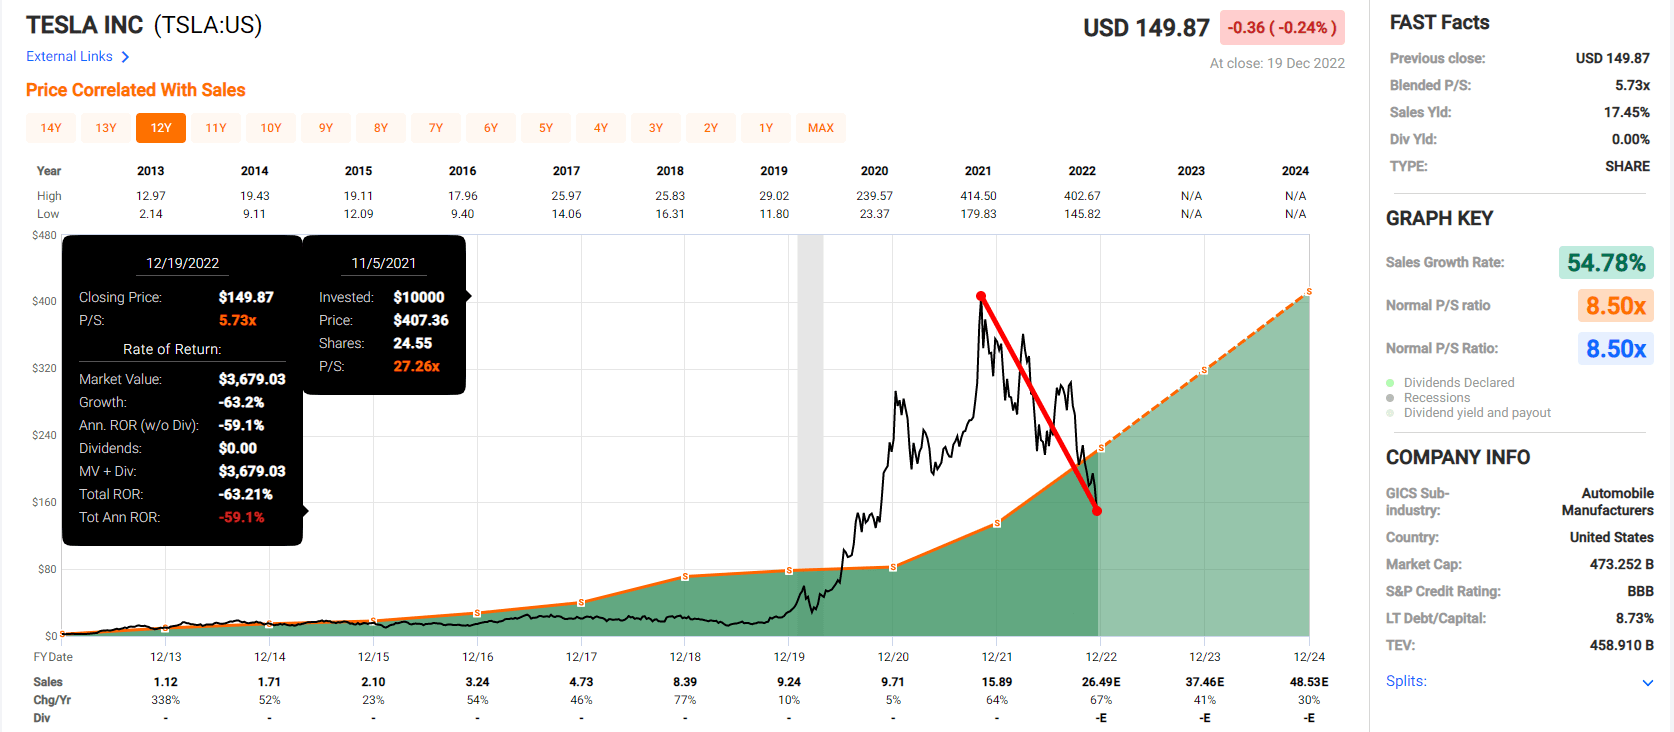
For one thing, during the Pandemic bubble, Tesla’s valuation became absurd, with at 30X sales. Not even God’s own company is worth those kinds of absurd valuations.
Tesla was priced as if nothing ever bad would happen again, and of course, something always does.
- soaring interest rates
- a bear market
- a recession
- Chinese lockdowns hurting demand
- concerns that a recession will reduce global demand
- Elon Musk’s insane misadventures with Twitter forced him to sell $23 billion worth of Tesla stock at crashing prices.
Well, interest rates aren’t coming down, the bear market isn’t over, and the recession isn’t likely to start until Q1 of 2023. But at least one major headwind for Tesla appears to be ending.
On Sunday, Musk posted a poll on Twitter asking if he should step down as CEO and said he’d honor it. After almost 18 million votes, 58% said he should resign.
Whether or not he does is another story, but he now has the cover to potentially stop wasting his valuable time on the biggest mistake of his life.
So does this mean that Tesla has bottomed? If Twitter’s distraction were the only reason for the stock crash, then probably. But Tesla still faces a lot of headwinds, including a rather bleak short-term market outlook.
S&P Potential Bear Market Bottom
| Earnings Decline In 2023 | 2023 S&P Earnings | X 25-Year Average PE Of 16.7 | Decline From Current Level |
| 0% | $218.45 | $3,648.12 | 5.3% |
| 5% | $207.53 | $3,465.71 | 10.0% |
| 10% | $196.61 | $3,283.30 | 14.8% |
| 13% | $190.05 | $3,173.86 | 17.6% |
| 15% | $185.68 | $3,100.90 | 19.5% |
| 20% | $174.76 | $2,918.49 | 24.2% |
(Source: DK S&P Valuation Tool, FactSet, Bloomberg)
Even if economists are right and the coming recession is the mildest in history, and earnings decline by a fraction of their historical norm, stocks are likely to fall before they bottom.
- Tesla’s historical volatility is 177% that of the S&P.
So does that mean anyone buying Tesla today is being foolish? Is Tesla destined to fall by 9% to 43% more before it bottoms for good?
Not necessarily. It’s always a market of stocks, not a stock market. Consider that Amazon (AMZN) bottomed in January 2002, 10 months before the S&P did. In fact, Amazon was up about 70% by October 2002, when the S&P finally stopped crashing.
YCharts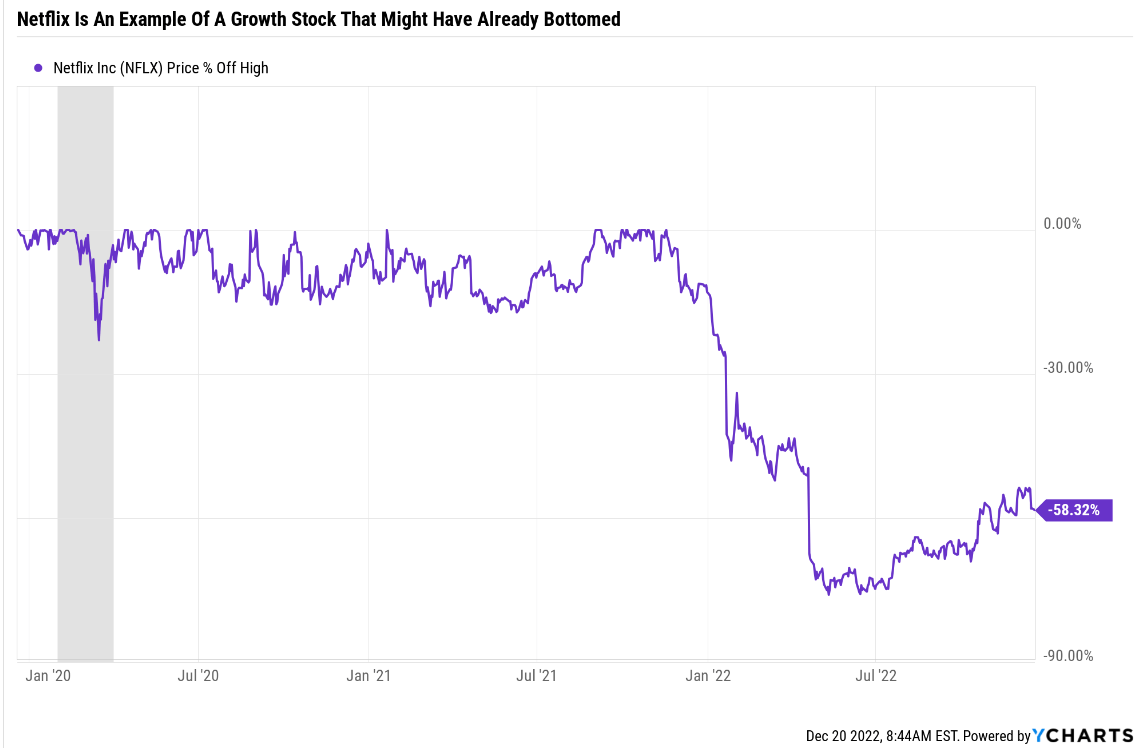
Netflix (NFLX) is an example of a tech stock that might have already bottomed, even with the worst yet to come for the S&P.
It was down 75% off its peak and is up 70% off its mid-2022 lows.
- the October 13th S&P low didn’t cause Netflix to fall to new lows
- neither did news that it had to refund 20% of initial ad sales because its ad-based service isn’t as popular as expected.
Even speculative hyper-growth blue-chips can only get so cheap as long as their core businesses are intact. So let’s take a look at why Tesla is likely a very attractive speculative buy right now. But first, let me show you why even dividend investors should consider buying non-dividend growth stocks like Tesla.
Why Dividend Investors Should Invest In Growth Stocks Too
If you have already retired and expect to die within 10 years, then pure high-yield investing is a perfectly reasonable strategy. Especially right now, in an elevated inflation environment.
Daily Shot 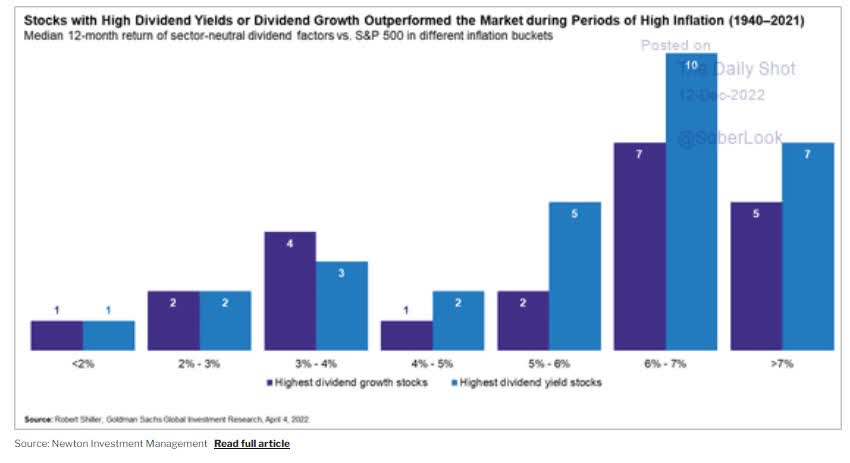
Periods of elevated inflation tend to be when high-yield stocks shine the brightest. How is that possible? Aren’t they “bond alternatives”? Well, actually, no. When inflation and interest rates are high, short-duration assets of all kinds perform best.
Daily Shot 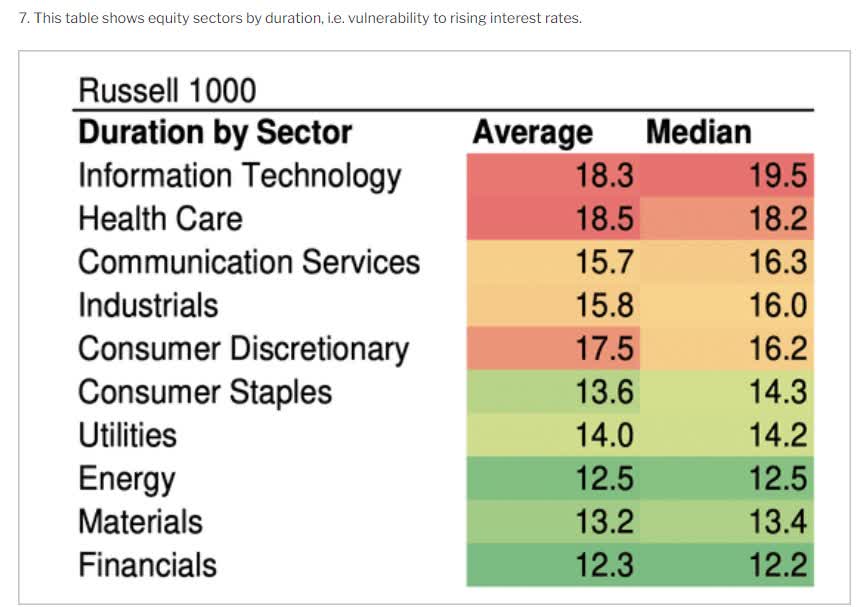
That includes stocks, where the shortest-duration sectors are the ones that generate the most immediate cash flow.
But if your time horizon is 10+ years, including anyone who plans to leave their portfolio to a spouse, children, grandchildren, or charity, then high-yield today isn’t the only portfolio goal you should have.
Maximum SAFE LONG-TERM income is what you should be after and that’s where a diversified high-yield portfolio that includes hyper-growth stocks like Tesla can work wonders.
The odds are 31 percent — almost one in three — that one member of a 65-year-old couple will live to age 95. The odds are one in 10 — 10 percent — that one member of this couple will live to age 100.
But most people aren’t financially prepared to live that long or deal with the uncertainty of their actual lifespan.” – CBS News
The Social Security Administration estimates that 10% of retired couples will have one spouse live to 100. So even if you’re 65 and retired, a 35-year time horizon is part of any reasonable and prudent retirement plan.
Let me show you how Tesla can potentially turbocharge any high-yield portfolio and help you achieve far more retirement income than high-yield blue-chips alone.
Hypothetical High-Yield Zen Portfolio
| Stock | Yield | Growth | Total Return | Weighting | Weighted Yield | Weighted Growth |
Weighted Return |
| SCHD | 3.4% | 7.6% | 11.0% | 50.00% | 1.7% | 3.8% | 5.50% |
| BTI | 7.0% | 10.4% | 17.4% | 16.67% | 1.2% | 1.7% | 2.90% |
| ENB | 6.9% | 4.9% | 11.8% | 16.67% | 1.2% | 0.8% | 1.97% |
| BAM | 4.6% | 14.6% | 19.2% | 16.67% | 0.8% | 2.4% | 3.20% |
| Total | 5.5% | 9.4% | 14.9% | 100.00% | 4.8% | 8.8% | 13.6% |
(Source: DK Research Terminal, FactSet)
Here is a pure high-yield blue-chip portfolio made up of 50% high-yield exchange-traded funds (“ETFs”) and 50% equally weighted into three of the best high-yield blue-chips on earth.
It yields a very safe almost 5% and offers long-term return potential that’s superior to almost any other investing strategy, including the S&P, dividend aristocrats, and even the Nasdaq.
Now consider what happens if we add a modest position in Tesla.
Hypothetical High-Yield Zen Portfolio Including Growth
| Stock | Yield | Growth | Total Return | Weighting | Weighted Yield | Weighted Growth |
Weighted Return |
| SCHD | 3.4% | 7.6% | 11.0% | 25.00% | 0.9% | 1.9% | 2.75% |
| BTI | 7.0% | 10.4% | 17.4% | 15.00% | 1.1% | 1.6% | 2.61% |
| ENB | 6.9% | 4.9% | 11.8% | 15.00% | 1.0% | 0.7% | 1.77% |
| BAM | 4.6% | 14.6% | 19.2% | 15.00% | 0.7% | 2.2% | 2.88% |
| SCHG | 0.5% | 12.5% | 13.0% | 25.00% | 0.1% | 3.1% | 3.25% |
| TSLA | 0.0% | 26.5% | 26.5% | 5.00% | 0.0% | 1.3% | 1.33% |
| Total | 3.7% | 12.8% | 16.5% | 100.00% | 3.8% | 10.8% | 14.6% |
(Source: DK Research Terminal, FactSet)
Now we have a 70% high-yield 30% growth portfolio that still yields 3.8% but has 2% faster growth, offering 1% higher long-term returns.
- over 30 years, that’s potentially 35% higher inflation-adjusted wealth.
But guess what? The extra income this portfolio can generate is a lot more than just an extra 35%.
Historical Returns Since 2011
Portfolio Visualizer Premium 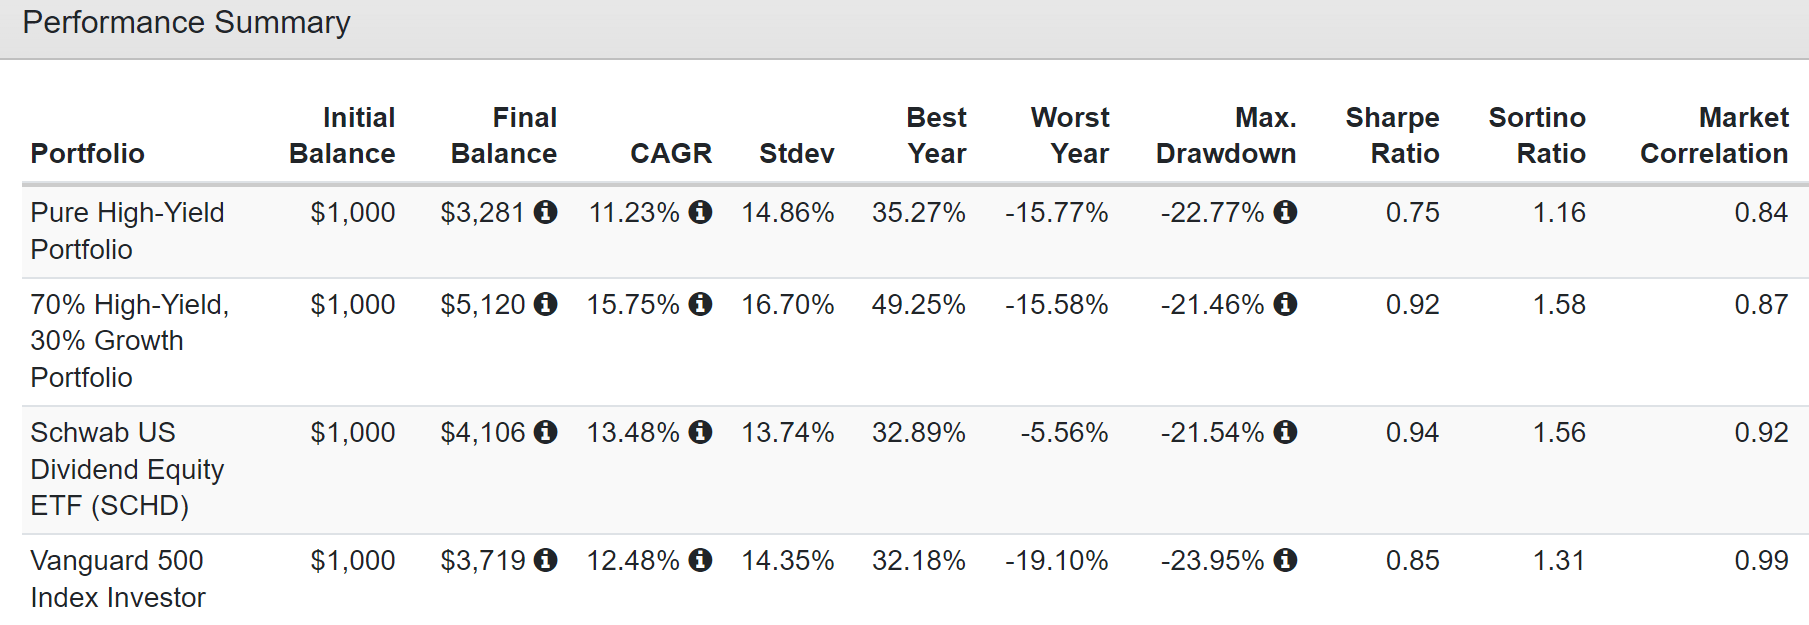
Superior returns to the S&P in one of the best bull markets in history and no worse volatility.
Portfolio Visualizer Premium 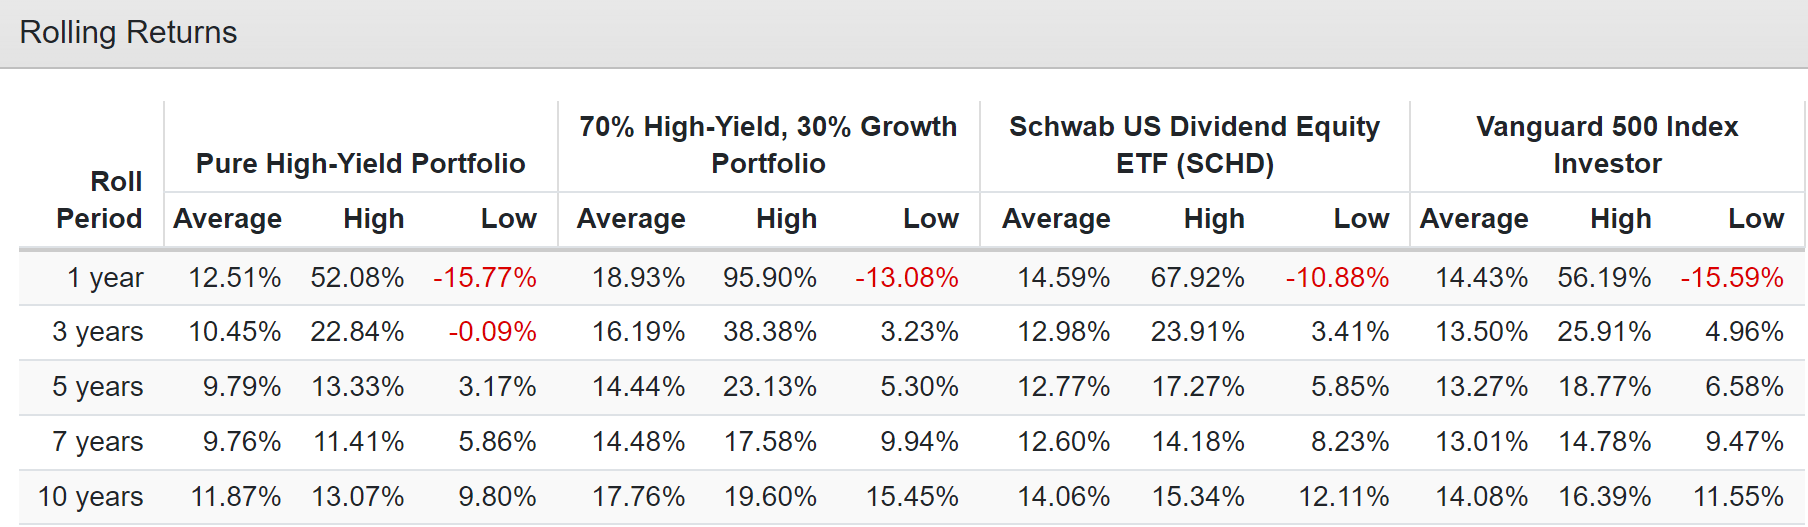
How many high-yield portfolios do you know of that were able to deliver 19% average rolling annual returns over the last 11 years and kept up with the Nasdaq’s 19.7% returns?
But take a look at what happened to the income growth of these two high-yield portfolios.
Portfolio Visualizer Premium 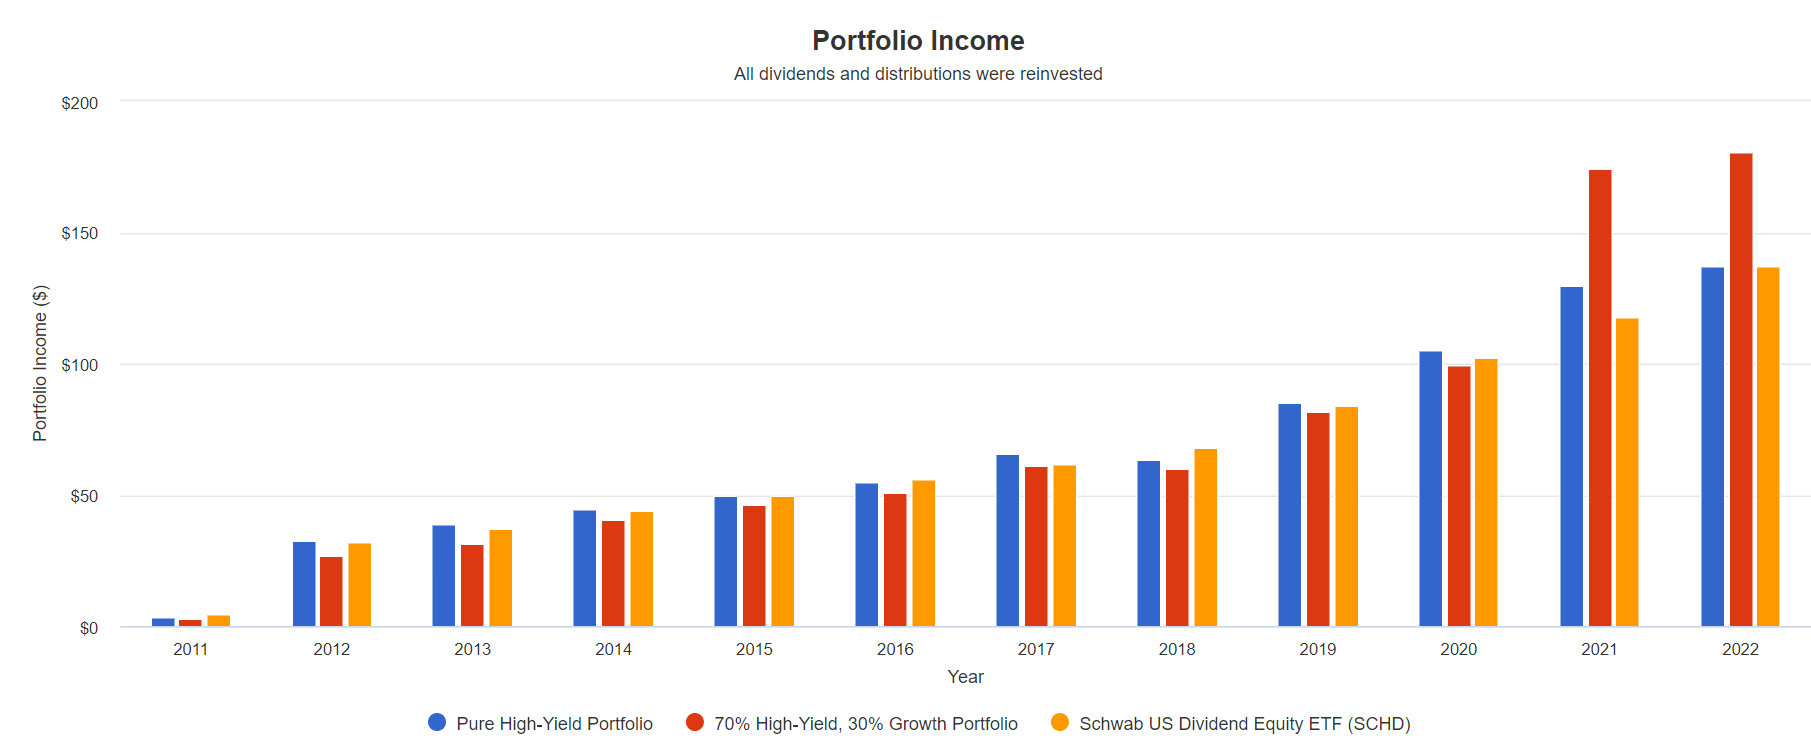
Cumulative Dividend Income Since 2012 Per $1,000 Initial Investment
| Metric | Pure High-Yield | SCHD | 70% Yield/30% Growth |
| Total Dividends | $807 | $789 | $853 |
| Total Inflation-Adjusted Dividends | $616.03 | $602.29 | $651.15 |
| Annualized Income Growth Rate | 15.3% | 15.7% | 21.0% |
| Starting Yield | 3.3% | 3.2% | 2.7% |
| Today’s Annual Dividend Return On Your Starting Investment (Yield On Cost) | 13.7% | 13.7% | 18.1% |
| 2022 Inflation-Adjusted Annual Dividend Return On Your Starting Investment (Inflation-Adjusted Yield On Cost) | 10.5% | 10.5% | 13.8% |
(Source: Portfolio Visualizer Premium)
16% returns turned into 21% annual income growth, far more than the high-yield portfolios themselves.
The inflation-adjusted yield on cost is now 30% larger. The actual income is slightly larger because it takes around 10 years for superior income growth to kick in.
- But most people have 35+ year time horizons.
The 70/30 yield/growth portfolios now going to be minting dividends at a far faster rate. That’s because it benefits from triple compounding.
- the dividend stocks growth their dividends exponentially
- the dividends buy exponentially more shares of dividend stocks
- the hyper-growth stocks buy even more high-yield stocks during annual rebalancing.
That big spike in income for the 70/30 yield/growth portfolio in 2020? That was the year Tesla soared 743%. It then soared another 50% in 2021.
That’s the Tesla bubble and guess what? Thanks to rebalancing it back to 5% each year, you would have sold Tesla at its outrageous bubble valuations to buy more undervalued high-yield blue-chips.
- you were buying safe high-yield with other people’s money
- over time hyper-growth annual rebalancing will buy far more high-yield stocks than you could ever afford on your own.
High-yield on its own can double compound your income, but if you own growth stocks, you get an entire extra layer of compounding.
What 25 Years Of Triple Income Compounding Can Do
| Metric | Altria |
Altria + Amazon |
| Total Dividends | $14,193 | $261,479 |
| Total Inflation-Adjusted Dividends | $7,755.74 | $142,884.70 |
| Annualized Income Growth Rate | 16.0% | 34.3% |
| Total Income/Initial Investment % | 14.19 | 261.48 |
| Inflation-Adjusted Income/Initial Investment % | 7.76 | 142.88 |
| More Inflation-Adjusted Income Than Altria | NA | 18.42 |
| Starting Yield | 4.0% | 4.2% |
| Today’s Annual Dividend Return On Your Starting Investment (Yield On Cost) | 139.9% | 5005.7% |
| 2022 Inflation-Adjusted Annual Dividend Return On Your Starting Investment (Inflation-Adjusted Yield On Cost) | 76.4% | 2,735.4% |
(Source: Portfolio Visualizer Premium)
Here is the ultimate example of the triple income compounding power of yield + growth, using Altria Group (MO) and Amazon, the best dividend growth stock in history and one of the best growth stocks of all time.
After 10 years, the income was roughly the same. But after 25 years, yield + growth delivered 18.4X more inflation-adjusted income. And take a look at the yield on cost. For every $1 invested in MO and AMZN in 1997, you’re now getting $27.35 in inflation-adjusted income per year.
- 36X more annual income than MO alone.
So now that we can see the logic behind dividend investors owning hyper-growth blue-chips, let’s take a look at why Tesla, after its 63% crash, might be a potentially attractive speculative investment.
- 2.5% or less max risk cap rec
- 5% was used merely as an example.
Why Tesla Is Potentially A Great Long-Term Speculative Hyper-Growth Investment
First, let’s start by answering the question all Tesla investors and potential investors are dying to know. Is Tesla’s recent issues in China and with rising competition from other automakers hurting its growth prospects?
Daily Shot 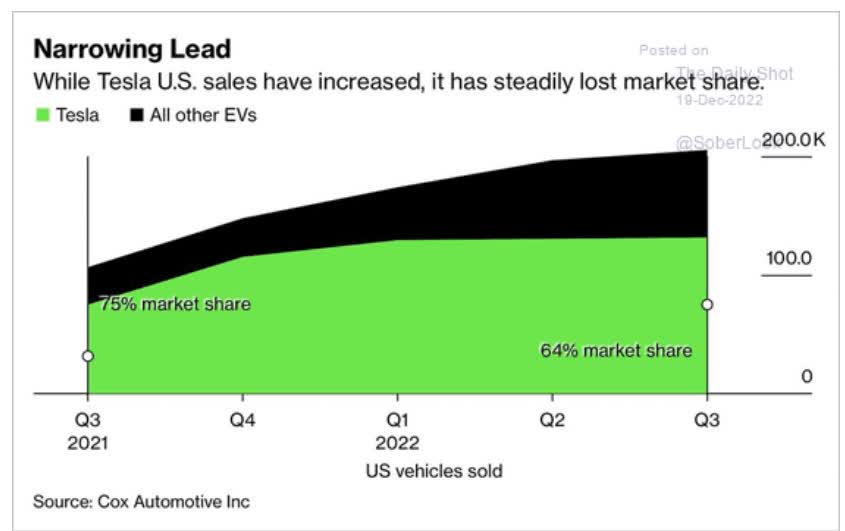
After all, Tesla’s market share is dropping by around 11% per year.
FactSet Research Terminal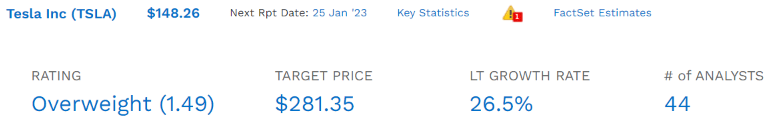
Four months ago, Tesla’s median growth consensus was 24.5%, and it’s gone up 2% since then.
- Growth forecast range: 3.0% to 48.1%.
You might think that Tesla is speculative because of its junk bond credit rating, but that’s not the case. S&P upgraded it to BBB stable back in October 2022 because of its strong balance sheet.
- Ford’s credit rating: BB+ positive (junk bond)
- GM credit rating: BBB stable = same as Tesla’s.
FactSet Research Terminal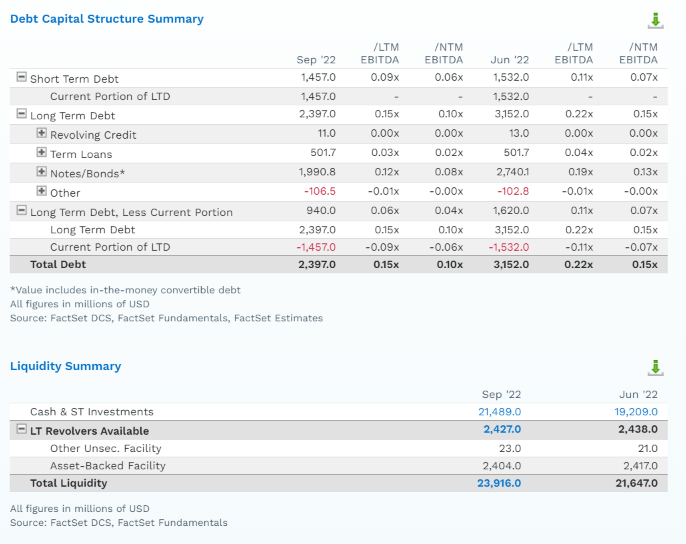
Tesla’s debt/EBITDA, or leverage ratio, is 0.15X and is expected to hit 0.1X in 2023. For context, rating agencies consider 2.5X or less leverage safe for automakers.
Today Tesla has $21.5 billion in cash vs. $2.4 billion in debt. And its short-term liquidity is $24 billion. The days of Tesla’s very survival requiring selling more stock are over.
FactSet Research Terminal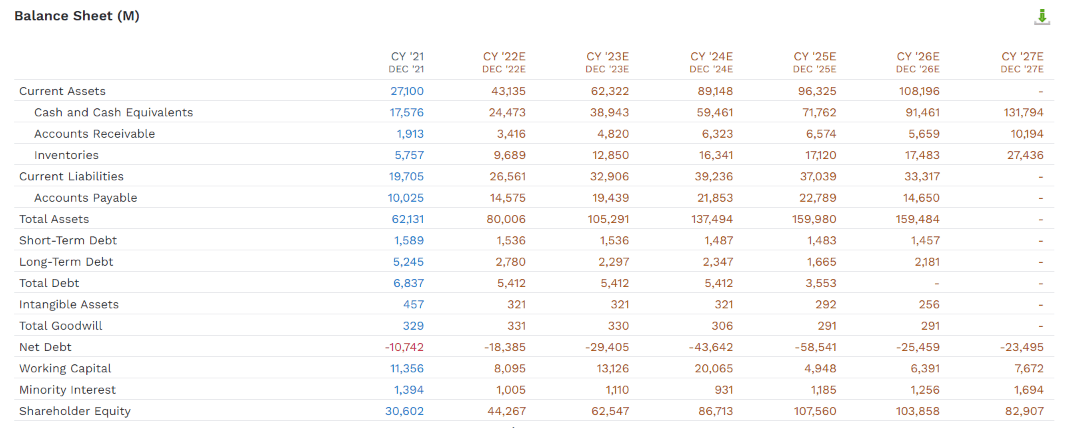
In fact, by 2027, analysts expect TSLA could have $132 billion in cash on its balance sheet.
However, the future growth outlook is very wide, thus Morningstar’s “very high uncertainty” business model score and our speculative rating.
FactSet Research Terminal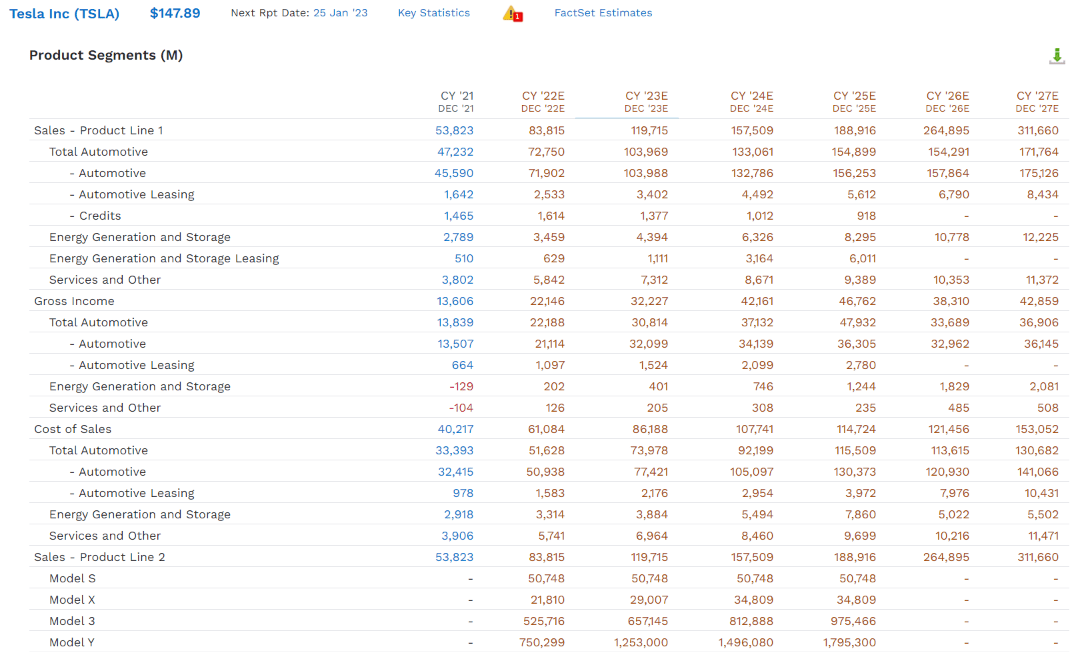
Tesla’s sales continue to be supply constrained, with the company selling all the cars it can build. The days of carbon credits making up most of its profits are long gone, with just $1.6 billion in credits this year, or 2% of sales.
Tesla’s sales are expected to grow 30% annually by 2027. In 2022 alone, it’s expected to become the 9th largest car maker by revenue and generate 5% of all car maker revenue in the world.
Global Auto Sales 2021
FactoryWarrentyList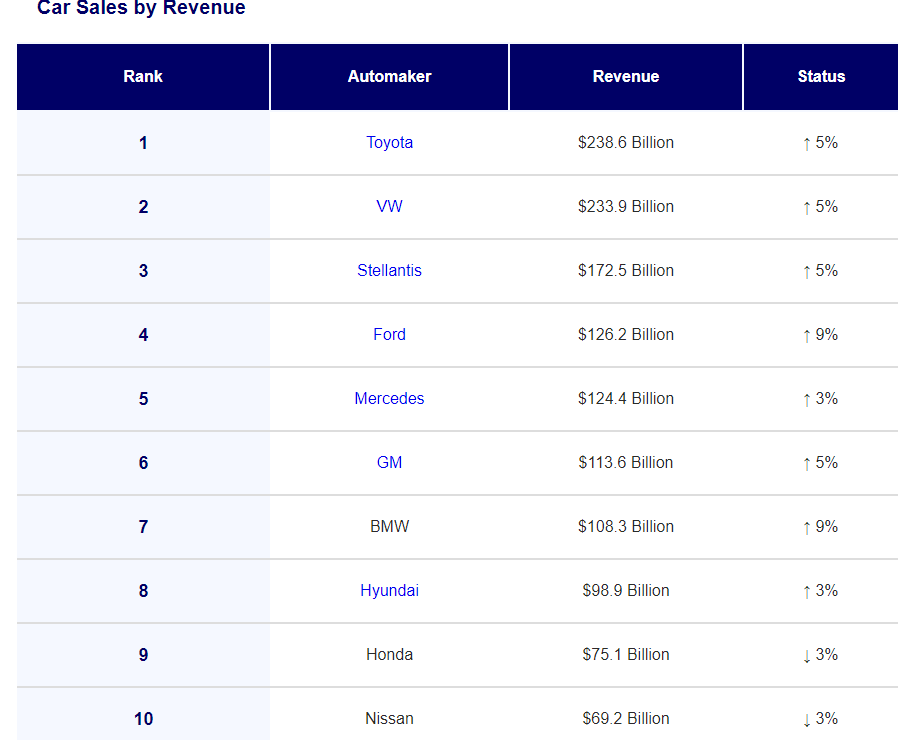
In 2023, Tesla is expected to become the 6th largest automaker.
In 2024, the 4th largest.
In 2025, the 3rd largest.
In 2026, it’s expected to overtake Toyota (TM) for the #1 spot.
And guess what? Tesla’s energy storage business is growing 29% per year, almost as fast as its cars.
Tesla’s services revenue of $5.8 billion in 2022 is expected to more than double to $11.4 billion by 2027.
In total, non-car sales (services and energy) make up $10 billion in 2022 sales or 12% of revenue.
By 2025 non-car sales are expected to reach $23.7 billion, more than Subaru’s (OTCPK:FUJHF) total sales.
- Tesla’s non-car sales in 2025 would be the 18th largest automaker.
Tesla’s non-automative sales are growing at 33%, the fastest part of the business, and are expected to generate 13% of revenue by 2025.
FactSet Research Terminal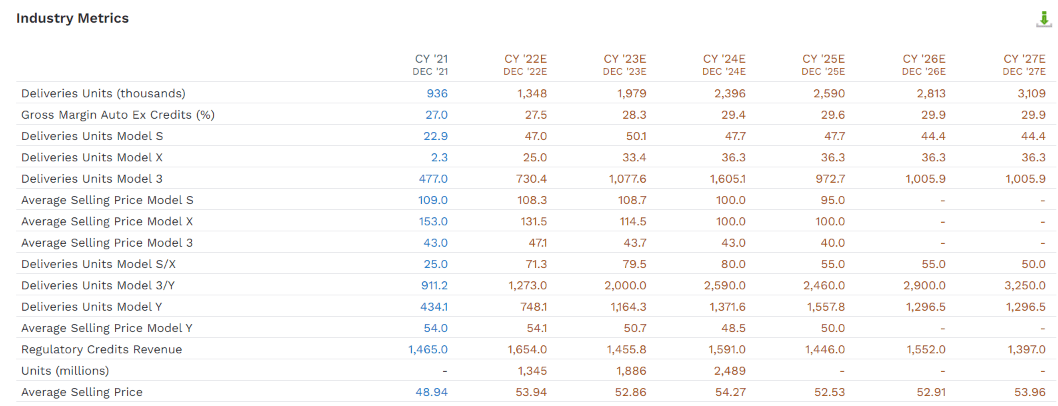
Tesla is expected to sell 1.35 million cars in 2022, 44% more than last year. By 2027, that’s expected to grow to 3.3 million cars, a 20% annual growth rate.
- by 2027 Tesla is expected to be the 9th largest automaker by vehicles sold, ahead of Renault and behind Ford.
Its average selling price, even with the dominant popularity of the Model 3 and Y, is expected to remain stable at $54,000 per vehicle.
- Toyota’s average selling price: $25,324
- VW (VWAGY, VLKAF, VWAPY,): $33,137
- Hyundai: $14,715
- GM: $20,178
- Stellantis (STLA) (old Chrysler: $28,047).
Thanks to a premium brand that requires virtually no advertising, Tesla’s premium price means higher margins even though it’s still a young company that hasn’t achieved economies of scale.
- 2021 gross margin: 27.0%
- 2027 gross margin consensus: 29.9%.
FactSet Research Terminal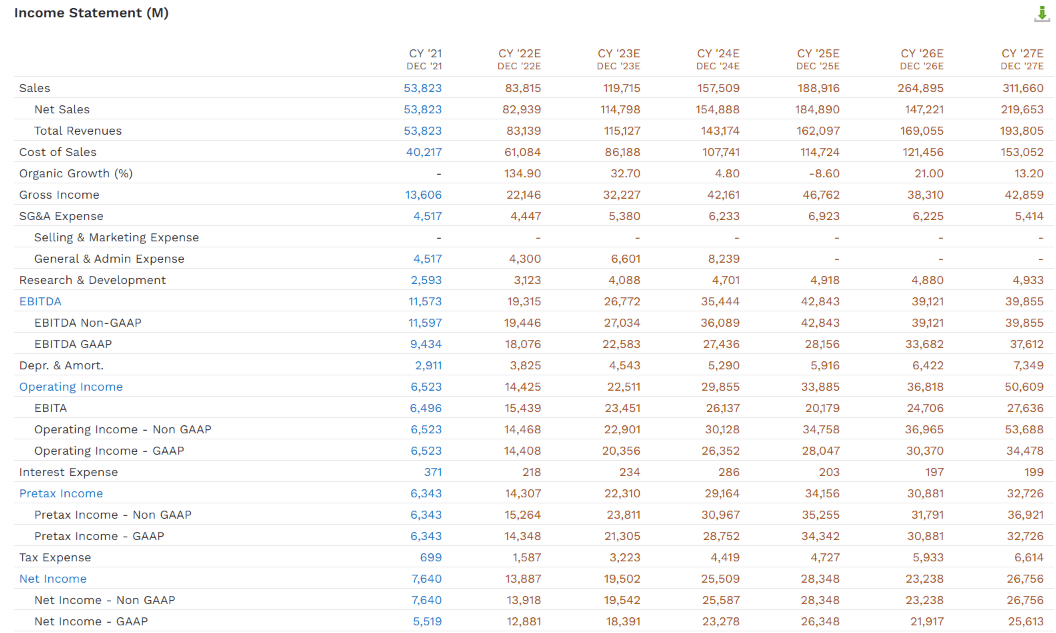
Tesla has become a profit-minting machine, with $7.6 billion in net profit in 2021, and that’s expected to almost double in 2022.
- $1.5 billion of that was carbon credits = 20% of profits
- falling to 12% of profits in 2022.
In 2027 Tesla’s net income is expected to hit almost $27 billion, with virtually none of that carbon credits.
And where Tesla really shines is free cash flow.
FactSet Research Terminal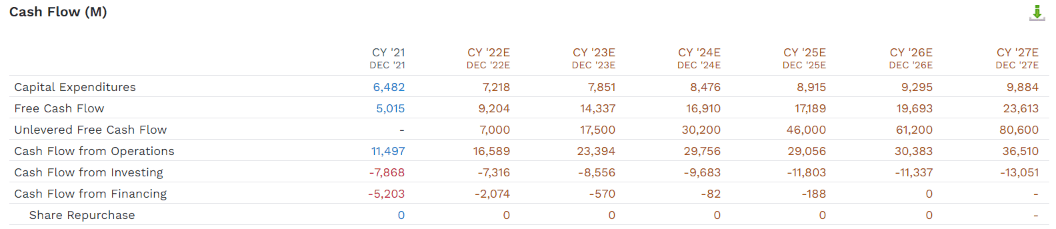
Tesla generated $5 billion in free cash flow in 2021 after spending $6.5 billion on growth. Its growth spending is expected to ramp up to $10 billion by 2027.
How does 2027 growth spending compare to its peers?
- VW consensus capex: $19.8 billion
- Toyota’s consensus capex: $11.3 billion
- Stellantis (old Chrysler): $11.2 billion
- Tesla: $9.9 billion
- GM: $9.3 billion
And despite aggressive increases in growth spending, Tesla’s free cash flow in 2027 is expected to reach $23.6 billion. How does that compare to its biggest peers?
- Tesla’s free cash flow: $23.6 billion
- VW: $12.9 billion
- Stellantis (old Chrysler): $12.3 billion
- Toyota: $7.7 billion
- GM: $6.6 billion
- Ford (F): $3.4 billion
Everyone else is so behind the curve on EVs that they must spend record amounts on developing new EV platforms. That’s why Tesla’s free cash flow in 2027 is expected to be 2.4X that of Ford and GM combined.
And all this from a new car company that is still improving its production process.
- In 2022 Tesla was the 19th most reliable car maker out of 24, according to Consumer Reports.
Yet, despite reliability, that’s 44% worse than Toyota’s, Tesla’s customer satisfaction is impressive.
American Customer Satisfaction Index 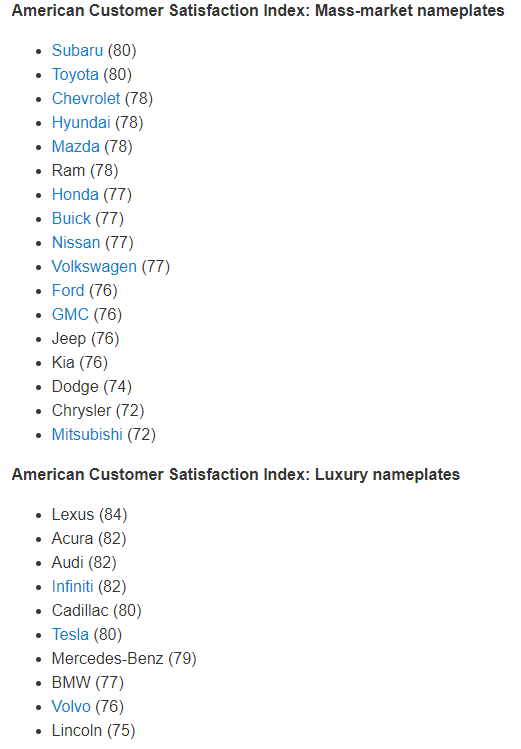
80% of Tesla owners are satisfied with their cars, more than Mercedes, BMC, Volvo, Lincoln, and matching Toyota. In fact, just four car brands have higher satisfaction than Tesla, and by just 5% (Lexus).
Imagine what Tesla’s customer satisfaction could reach once they improve their reliability. It’s very possible that Tesla’s customer satisfaction could become the industry standard within five years.
Bottom line: Tesla is a real company with a strong balance sheet that’s getting steadily stronger. Its brand is exceptional, and it’s one of the fastest-growing car companies on earth for the foreseeable future.
- the fastest-growing automaker on earth with an investment-grade credit rating.
A Wonderful Company At A Wonderful Price
FAST Graphs, FactSet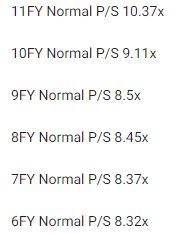
Tesla’s historical price/sales ratio is around 8.5X outside of bear markets and bubbles.
- 90% statistical probability TSLA is worth about 8.5X sales.
Wait a second? 8.5X sales for a car maker? Are you high?!
Toyota’s Historical Fair Value: 0.7X sales
FAST Graphs, FactSet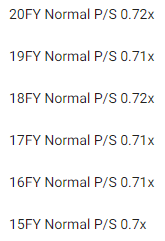
Toyota is the largest automaker on earth and trades at just 0.7X sales historically. But Toyota doesn’t have a brand so strong that it can charge 2X what Toyota does and generate superior margins.
Ferrari’s Historical Fair Value: 8X sales
FAST Graphs, FactSet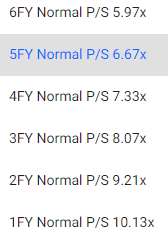
Tesla’s brand is as strong as Ferrari’s (RACE), but it has the ability to sell many times more cars than RACE.
- 2027 RACE consensus sales: $8 billion = 39X that of RACE
| Metric | Historical Fair Value Multiples (12-Years) | 2022 | 2023 | 2024 | 2025 | 12-Month Forward Fair Value |
| P/S | 8.50 | $225.25 | $322.15 | $424.15 | $508.30 | |
| Average | $225.25 | $322.15 | $424.15 | $508.30 | $322.15 | |
| Current Price | $142.61 | |||||
|
Discount To Fair Value |
36.69% | 55.73% | 66.38% | 71.94% | 55.73% | |
|
Upside To Fair Value (including dividend) |
57.95% | 125.90% | 197.42% | 256.43% | 125.90% | |
| 2022 Sales/Share | 2023 Sales/Share | 2023 Weighted Sales/Share | 12-Month Forward Sales/Share | Historical Average Fair Value Price/Sales | Current Forward Price/Sales |
Cash-Adjusted PE |
| $26.50 | $37.90 | $37.90 | $37.90 | 8.5 | 3.8 | 18.3 |
TSLA is trading at 3.8X sales and 18.3X cash-adjusted earnings for a company growing at 27%.
- hyper-growth at a ridiculously wonderful price
- a 56% historical discount
| Rating | Margin Of Safety For Medium-Risk 13/13 Speculative Blue-Chip Quality Companies | 2022 Fair Value Price | 2023 Fair Value Price | 12-Month Forward Fair Value |
| Potentially Reasonable Buy | 0% | $322.15 | $322.15 | $322.15 |
| Potentially Good Buy | 10% | $289.94 | $289.94 | $289.94 |
| Potentially Strong Buy | 20% | $257.72 | $257.72 | $257.72 |
| Potentially Very Strong Buy | 30% | $202.95 | $225.51 | $225.51 |
| Potentially Ultra-Value Buy | 40% | $193.29 | $193.29 | $193.29 |
| Currently | $142.61 | 55.73% | 55.73% | 55.73% |
| Upside To Fair Value (Including Dividends) | 125.90% | 125.90% | 125.90% |
Tesla is a potentially speculative ultra-value buy for anyone comfortable with its risk profile.
Tesla 2024 Consensus Return Potential
FAST Graphs, FactSet 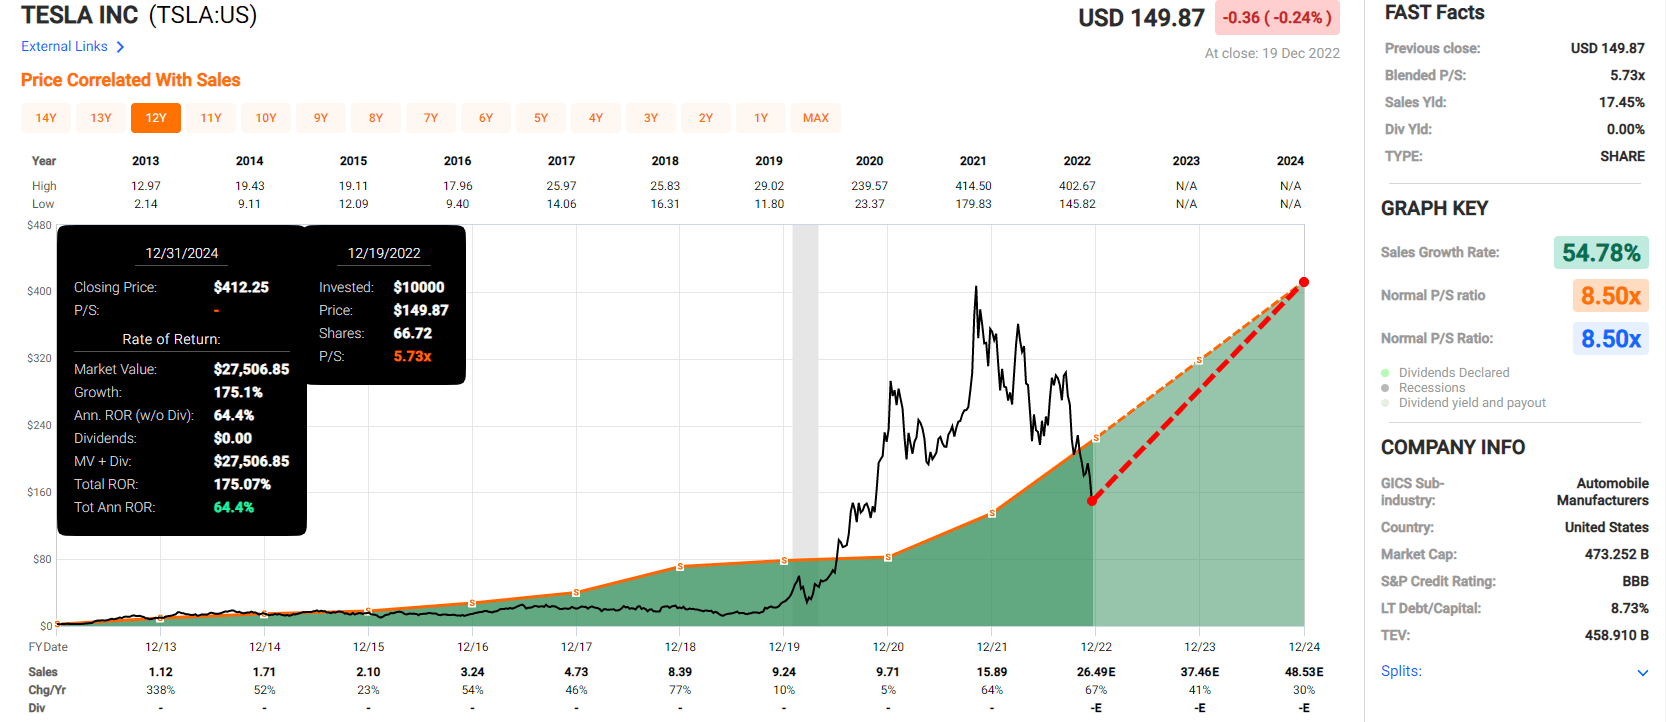
If Tesla grows as expected and returns to historical fair value, it could almost triple in the next two years, delivering 64% annual returns.
- 7X more than the S&P 500 consensus.
Tesla 2028 Consensus Return Potential
FAST Graphs, FactSet 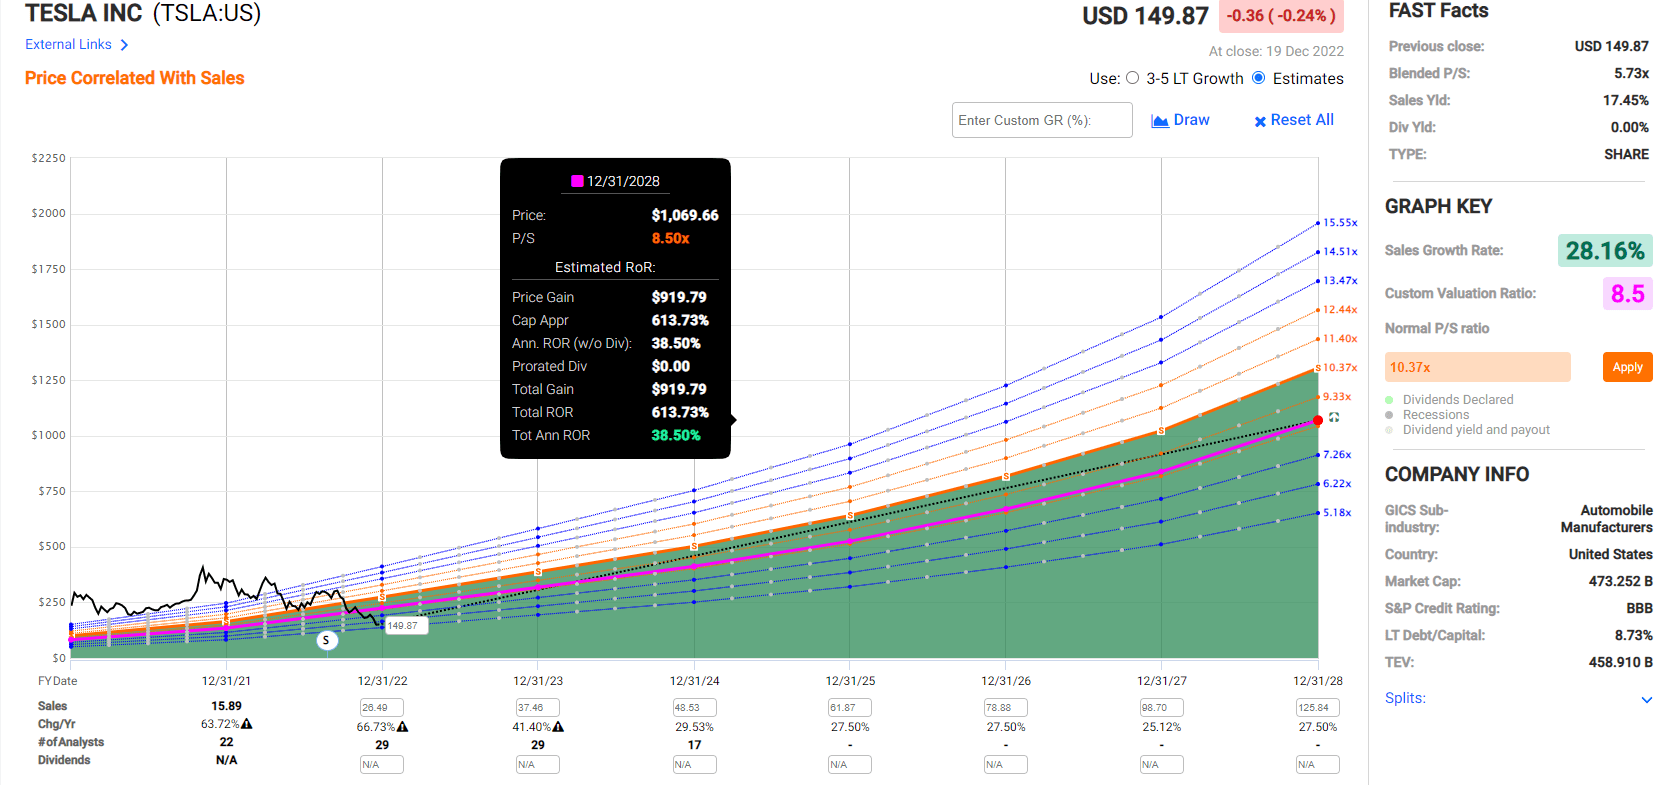
If Tesla grows as expected and returns to historical fair value, it could deliver 614% returns in the next five years or 39% annually.
- 12X more than the S&P 500.
Note that the consensus $1070 share price on TSLA is what it was trading at in 2021, but the difference is that it was 217% historically overvalued at the time.
Tesla Investment Decision Score
Dividend Kings Automated Investment Decision Tool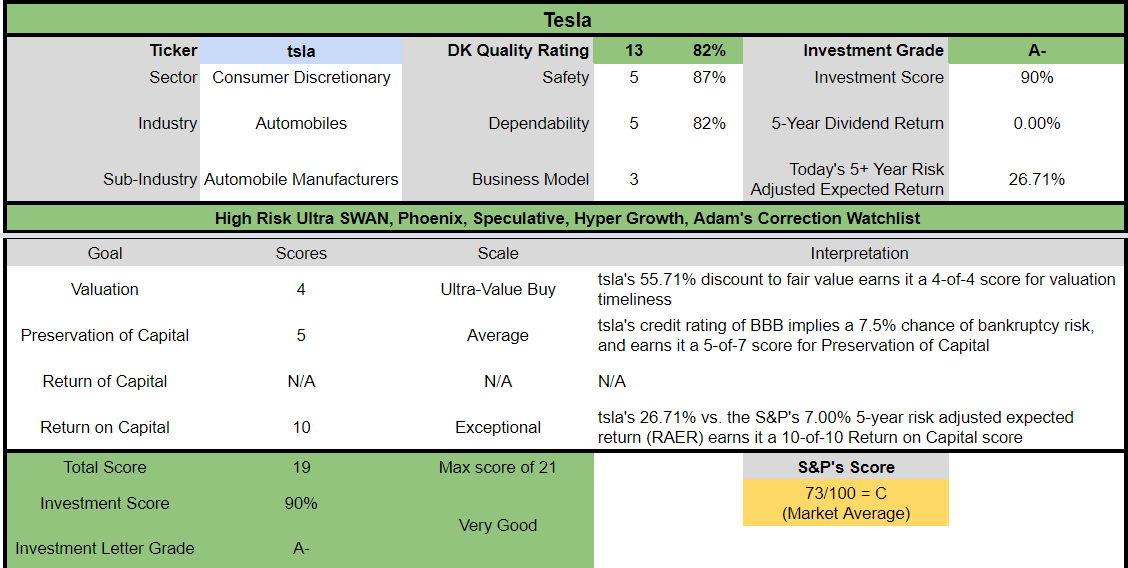
TSLA is a potentially very good speculative hypergrowth opportunity for anyone comfortable with its risk profile. Look at how it compares to the S&P 500.
- 56% discount to fair value vs. 2% discount S&P = 54% better valuation
- approximately 26.5% long-term annual return potential vs. 10.2% CAGR S&P
- about 4X higher risk-adjusted expected returns.
Risk Profile: Why Tesla’s Not Right For Everyone
There are no risk-free companies, and no company is right for everyone. You have to be comfortable with the fundamental risk profile.
TSLA’s Risk Profile Summary
- EV adoption risk (mostly tied to the cost of producing the cars)
- technology disruption risk (minimal since hydrogen isn’t particularly viable)
- market share loss risk: uncertainty surrounding potential market share once no longer supply constrained
- Key Man Risk: Elon Musk owns 20% of the stock and will own more in 2028 after his options vest
- employee retention risk: Musk is an unpopular boss, and it’s the tightening job market in 50 years
- brand risk: Tesla’s margins are almost entirely due to its strong brand
- regulatory risk: as seen by the new IRA tax credits, Tesla won’t receive
- oversees expansion risk: China is Tesla’s biggest market, and the government could crack down on foreign EV makers.
How do we quantify, monitor, and track such a complex risk profile? By doing what big institutions do.
Long-Term Risk Management Analysis: How Large Institutions Measure Total Risk Management
DK uses S&P Global’s global long-term risk-management ratings for our risk rating.
- S&P has spent over 20 years perfecting their risk model
- which is based on over 30 major risk categories, over 130 subcategories, and 1,000 individual metrics
- 50% of metrics are industry specific
- this risk rating has been included in every credit rating for decades.
The DK risk rating is based on the global percentile of how a company’s risk management compares to 8,000 S&P-rated companies covering 90% of the world’s market cap.
TSLA scores 42nd Percentile On Global Long-Term Risk Management
S&P’s risk management scores factor in things like:
- supply chain management
- crisis management
- cyber-security
- privacy protection
- efficiency
- R&D efficiency
- innovation management
- labor relations
- talent retention
- worker training/skills improvement
- occupational health & safety
- customer relationship management
- business ethics
- climate strategy adaptation
- sustainable agricultural practices
- corporate governance
- brand management.
TSLA’s Long-Term Risk Management Is The 364th Best In The Master List 27st Percentile In The Master List)
| Classification | S&P LT Risk-Management Global Percentile |
Risk-Management Interpretation |
Risk-Management Rating |
| BTI, ILMN, SIEGY, SPGI, WM, CI, CSCO, WMB, SAP, CL | 100 | Exceptional (Top 80 companies in the world) | Very Low Risk |
| Strong ESG Stocks | 86 |
Very Good |
Very Low Risk |
| Foreign Dividend Stocks | 77 |
Good, Bordering On Very Good |
Low Risk |
| Ultra SWANs | 74 | Good | Low Risk |
| Dividend Aristocrats | 67 | Above-Average (Bordering On Good) | Low Risk |
| Low Volatility Stocks | 65 | Above-Average | Low Risk |
| Master List average | 61 | Above-Average | Low Risk |
| Dividend Kings | 60 | Above-Average | Low Risk |
| Hyper-Growth stocks | 59 | Average, Bordering On Above-Average | Medium Risk |
| Dividend Champions | 55 | Average | Medium Risk |
| Tesla | 42 | Average | Medium Risk |
| Monthly Dividend Stocks | 41 | Average | Medium Risk |
(Source: DK Research Terminal)
TSLA’s risk-management consensus is in the bottom 27% of the world’s best blue chips and is similar to:
- Kimberly-Clark (KMB): Ultra SWAN dividend king
- Altria: Ultra SWAN dividend king
- Sherwin-Williams (SHW): Super SWAN dividend king
- Exxon Mobil (XOM): Blue-chip dividend aristocrat
- Costco (COST): Super SWAN.
The bottom line is that all companies have risks, and TSLA is average at managing theirs, according to S&P.
How We Monitor TSLA’s Risk Profile
- 44 analysts
- two credit rating agencies
- 46 experts who collectively know this business better than anyone other than management
- the bond market for real-time fundamental risk assessment
When the facts change, I change my mind. What do you do, sir?” – John Maynard Keynes
There are no sacred cows at iREIT or Dividend Kings. Wherever the fundamentals lead, we always follow. That’s the essence of disciplined financial science, the math behind retiring rich and staying rich in retirement.
Bottom Line: Tesla’s Crash Has Made It A Bargain Even Dividend Investors Should Consider Buying
Let me be clear: I’m NOT calling the bottom in TSLA (I’m not a market-timer).
Blue-chip quality does NOT mean “can’t fall hard and fast in a bear market.”
Fundamentals are all that determine safety and quality, and my recommendations.
- over 30+ years, 97% of stock returns are a function of pure fundamentals, not luck
- in the short term; luck is 25X as powerful as fundamentals
- in the long term, fundamentals are 33X as powerful as luck.
While I can’t predict the market in the short term, here’s what I can tell you about TSLA.
- one of the fastest-growing companies on earth
- 26.5% annual long-term total consensus 2X top 2.5X better than the S&P, aristocrats, SCHD, and Nasdaq
- 56% historically undervalued, a potentially speculative Ultra Value buy
- 3.8X sales vs 8X to 10X historical
- 18.3X cash-adjusted earnings = 0.7 PEG = hyper-growth at a wonderful price
- 615% consensus return potential over the next five years, 39% CAGR, 12X better than the S&P 500
- 4X the risk-adjusted expected returns of the S&P 500 over the next five years
Tesla has revolutionized the automotive sector and built a brand that no other large automaker can match. Does it have risks? Of course, just look at the antics of mad king Musk.
But at a 56% historical discount, Tesla is now a potential speculative table-pounding buy that offers 12X better return potential than the S&P 500 (SP500).
And even if you’re a dividend investor, that kind of Buffett-like return potential could turbocharger your long-term income growth and make Tesla a potentially wonderful buy today.
Just remember to size your position appropriately (2.5% or less is our recommendation) within a prudently diversified and risk-managed portfolio.
From everyone at Dividend Kings and iREIT, I want to wish you and yours a safe, healthy, and joyous holiday season:)
Editor’s Note: This article discusses one or more securities that do not trade on a major U.S. exchange. Please be aware of the risks associated with these stocks.
Be the first to comment