

leadlciceraro/iStock via Getty Images
Understanding supply and demand shifts in the market for new houses over the past 50 years offers important insights into how the market could change moving forward. The analysis below indicates that both supply and demand could shift inward in 2023, causing a definite decline in new houses sold and a possible decline in house prices in 2023. In the long run, though, supply should stabilize and demand should continue shifting outward resulting in steadily increasing prices and quantities for new houses. This has important implications for homebuilding companies like D.R. Horton, Inc. (DHI) and other companies related to new home construction like Forestar (FOR), a supplier of developed lots to D.R. Horton.
Shifts in Supply and Demand
As a quick refresher from Econ 101, markets are modeled with supply and demand curves. Changes in price and quantity for a good or service are explained by shifts in supply and demand. Due to convention, an increase in demand or supply is an outward shift, to the right, and decreases are inward or to the left.
Author created illustration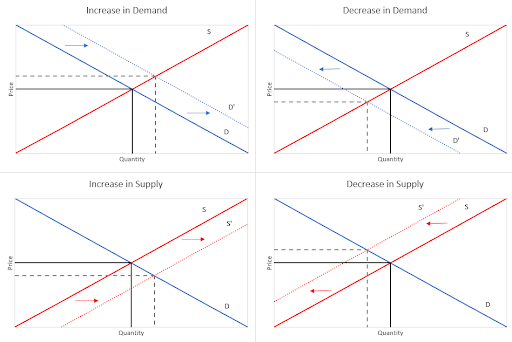
The results of these shifts can be summarized in the table below.
|
↓ Quantity |
↑ Quantity |
|
|
↑ Price |
↓ Supply |
↑ Demand |
|
↓ Price |
↓ Demand |
↑ Supply |
This logic is fundamental to being able to analyze markets generally and will be the basis for my analysis of the U.S. new single-family house market.
Price and Quantity Changes in the Market for New Houses
To analyze shifts in supply and demand for the new construction housing market, I first needed to obtain data on the appropriate quantity and price. For quantity, there is direct data on the new single family houses sold in the U.S.
The St. Louis Fed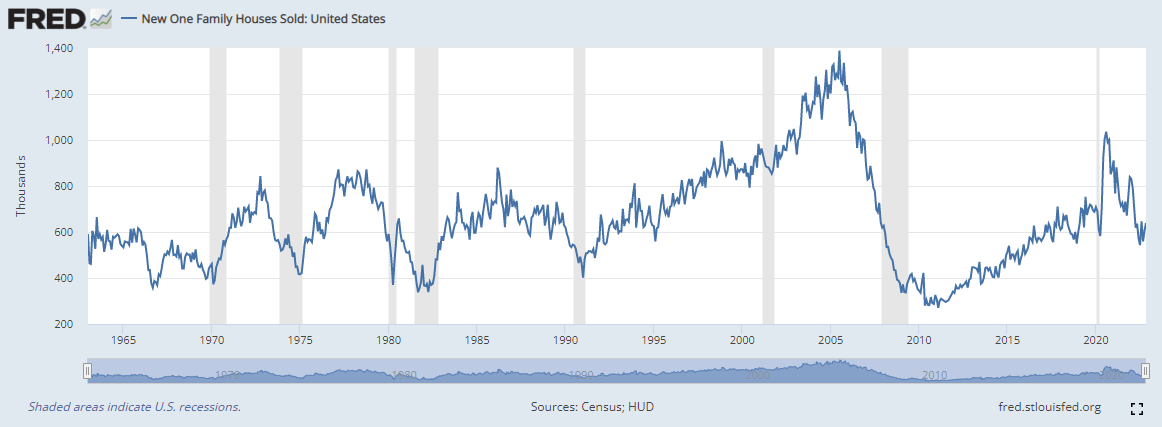
In this chart, the bull era of the ’90s and early 2000s can be seen, followed by the housing market collapse which started in 2005, leading into the 2007-08 financial crisis.
For the price of new houses, though, there are a couple ways to look at it. One way would be to simply look at the median house prices. However, what complicates things is that a large majority of houses are purchased with some form of mortgage. For this analysis, I calculated the monthly mortgage payment as the “true” price of purchasing a new home. The monthly mortgage payments were calculated from 30-year fixed rate mortgage interest rates and median house prices, adjusted for inflation to today’s dollars (taxes and insurance not included). The resulting data from 1971 to the current day can be seen in the chart below.
Created by Author using FRED Economic Data from the St. Louis Fed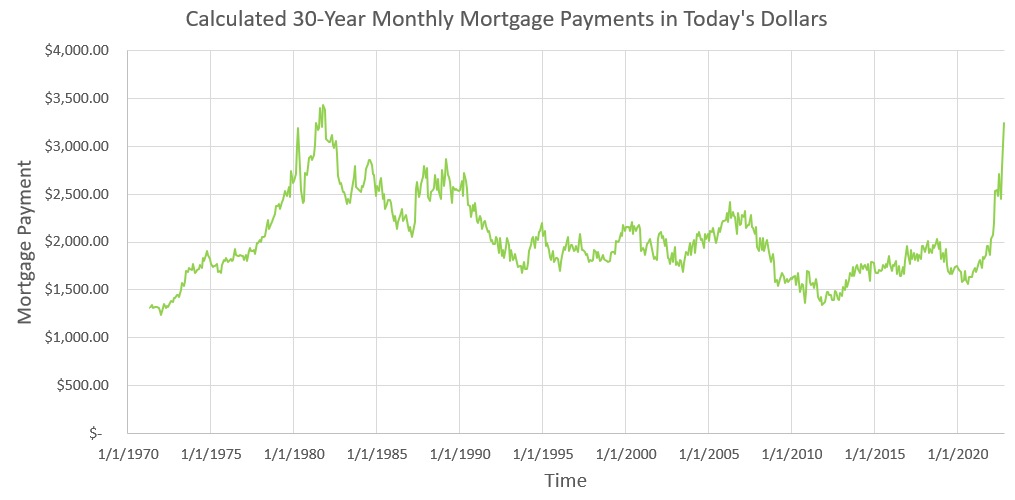
In this chart, the high inflation period of the 1970s and of the past two years show up as sharp upward movements in monthly mortgage payments. Otherwise, monthly mortgage payments seem to bounce around $2,000. Armed now with this data on new house quantity and prices, I was able attempt to decompose the supply and demand shifts.
Separating Supply and Demand Shifts
By looking at the direction of mortgage payment changes and new homes sold month to month and the logic of what indicates a supply or demand shift as outlined above, I separated and estimated the changes in new homes sold due to shifts in demand versus shifts in supply. For instance, if both the calculated monthly mortgage payment and the number of new houses sold went up in a given month, that would indicate an increase in Demand for that month. The chart below shows changes in quantity relative to a starting point of May 1971 when 618,000 new houses were sold. For context, adding the two lines back together gives the total change in quantity; so, although this analysis shows demand has shifted outward by more than 800,000 homes per month, supply has shifted inward an almost equal amount resulting in a net effect of roughly the same number of new houses sold today (632,000 in October 2022) as were sold in May 1971.
Created by Author from FRED Data from the St. Louis Fed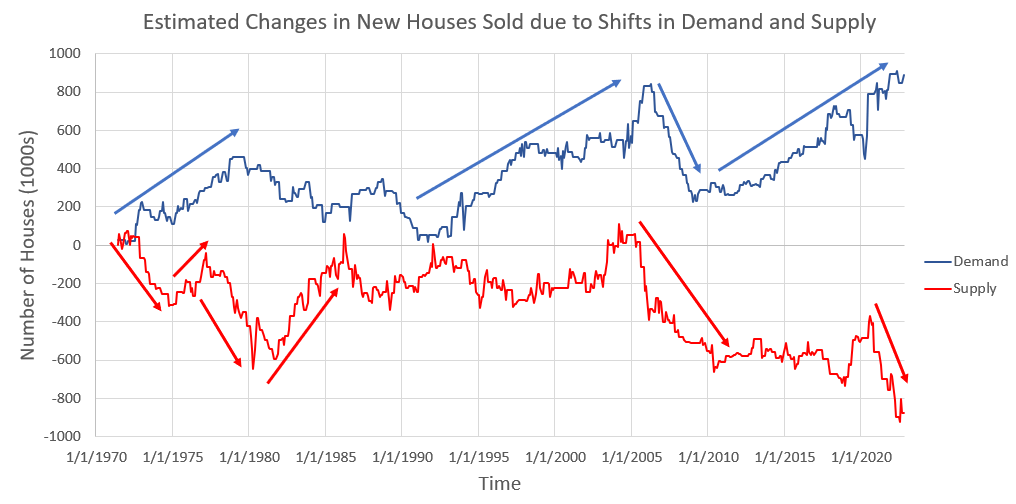
A few trends stand out in the chart above. One is that there are long spans of time when supply tended to stay stable while demand gradually increased such as in 1990-2005 and 2010-20. It is also clear that the housing market collapse starting in 2005 was caused by demand and supply both shifting back rapidly at the same time. Finally, both in the 1970s and in the past couple of years, demand has shifted outward while supply has shifted inward, which resulted in the spikes in price (monthly mortgage payments) shown on the first chart.
What Drives Demand Shifts
The factors that affect demand include “changes in tastes, population, income, prices of substitute or complement goods, and expectations about future conditions and prices.” A few of these factors are key for the housing market, especially income and population. As the U.S. economy grows in the long run, real incomes increase, although there might be short-term fluctuations with the business cycle. Personal income per capita has almost exactly doubled since 1971, going from ~$33,000 in today’s dollars to ~$66,000 in 2022.
Created by Author from FRED Data from the St. Louis Fed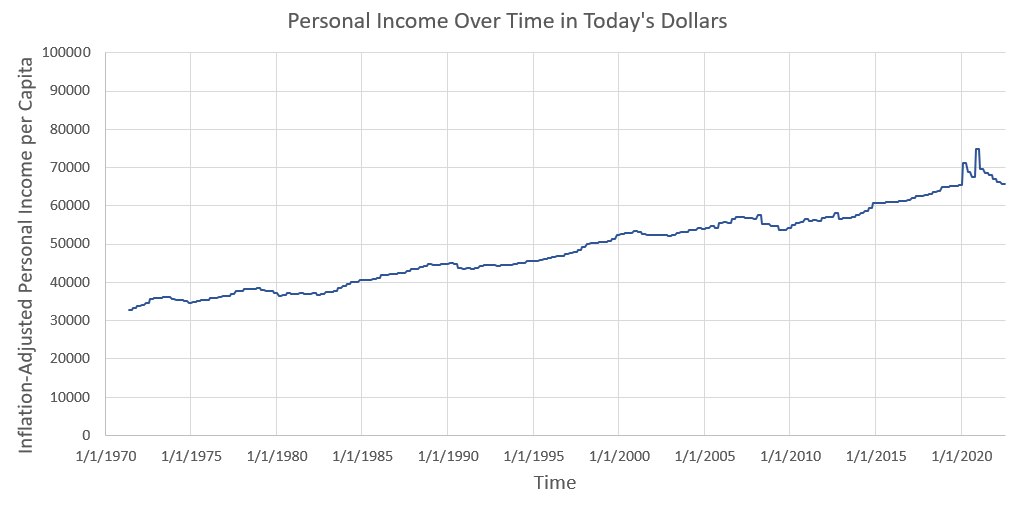
At the same time, the U.S. population has steadily increased. From May 1971 it has gone up 60% from ~207 million to ~333 million today.
The St. Louis Fed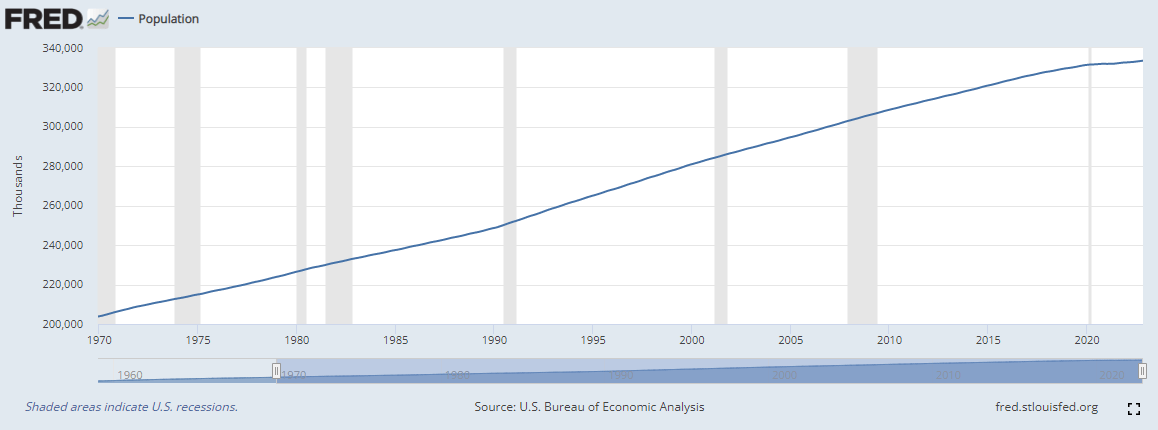
These two factors, increasing real personal income and increasing population, cause demand to generally shift outward, all else being equal. However, there are still clear inward shifts in demand occasionally. From my research into the data, the best explanation seems to be the occurrence of recessions, where a recession is defined as a decline in GDP.
Created by Author from FRED Data from the St. Louis Fed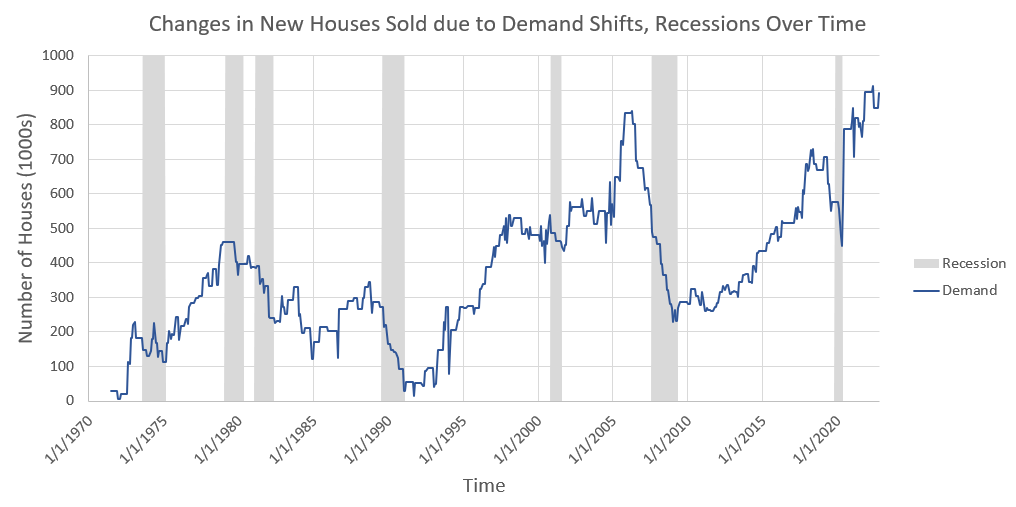
Nearly every major dip in demand occurred during or around recessions, and no recession occurred without a dip, as can be seen in the chart above. Recessions, of course, impact incomes both personally in terms of wages and in the aggregate with the level of unemployment. It makes sense, then, that the demand curve for new houses would shift inward during these times.
What Drives Supply Shifts
On the other side of things, factors that affect the supply curve include “input prices, natural conditions, changes in technology, and government taxes, regulations, or subsidies” (source linked above). Here I would like to especially consider input costs. What is really being considered here is the supply of mortgages and new houses together. The suppliers then are the homebuilder who has construction materials and other input costs and the mortgage lender whose main cost is the federal funds rate. As can be seen in the chart below, the supply shifts largely mirror the federal funds rate; as the rate increases, the costs for the mortgage lender go up and supply shifts inward.
Author created from FRED Data from the St. Louis Fed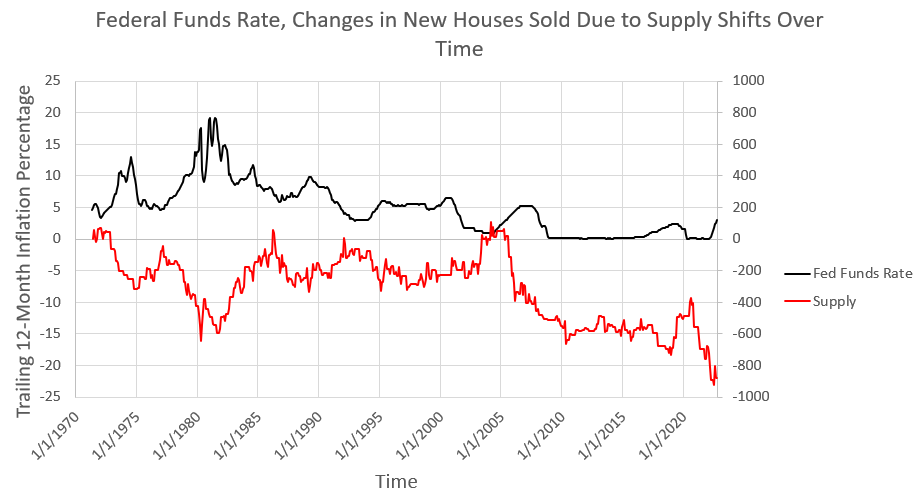
Other shifts can help be explained by building input costs. For instance, starting in the second half of 2020, construction materials prices started to skyrocket, causing an inward shift in supply even while the federal funds rate was still at 0%. The chart below shows the trailing 12-month inflation percentage of construction materials.
Author created from FRED Data from the St. Louis Fed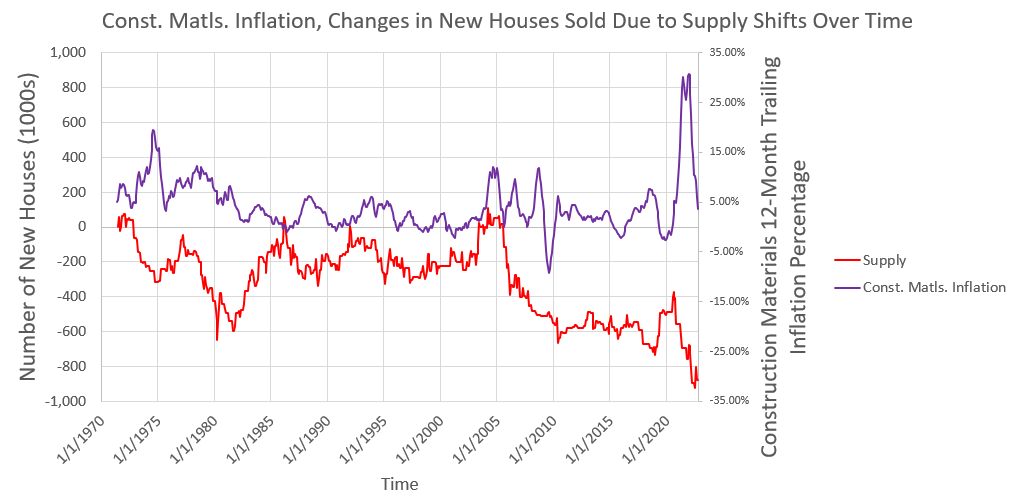
Even though construction materials costs have come back down, supply is continuing to shift inward as the federal funds rate rises. Indeed, most of the time, at least when rates are not 0%, interest rates appear to be the dominant factor.
2023 and Beyond
My big concern for housing demand in 2023 is the possibility of a recession. Despite an increase in GDP in Q3 2022, hikes in the federal funds rate are designed to slow the economy. My expectation is that a slowing economy will cause demand for new houses to shift inward as it has in the past. At the same time, the charts above show that the federal funds rate more directly causes supply to shift inward immediately. Even though construction materials prices have come back down, the supply curve continues to shift inward as the federal funds rate rises, and it could top 5% next year.
If both demand and supply shift inward, the quantity of new single-family homes sold will certainly fall. I cannot say how far quantities would fall, but the market has bottomed out a few times at around 300,000-400,000 houses in ’79, ’81-’82, ’91, and 2009-11, so I would imagine this is the absolute floor. However, the effect on price is theoretically unknown. It depends on whether demand or supply shifts more.
I find it hard to believe, though, that the prices can remain at these record-high monthly mortgage payments for very long. For monthly mortgage payments to fall while supply is decreasing, a larger inward shift in demand is required. Specifically, it also means nominal house prices will have to fall considerably. For instance, with 30-year mortgage rates around 7%, just to get back to the $2,500 monthly mortgage payment (in 2022 dollars) that was common in the 1980s following the high inflation of the 1970s, median house prices would have to fall about 25% to a median price of approximately $375,000 from where they were in October 2022 at $493,000. Indeed, looking at the broader housing market, existing house prices have already started to drop. I will not be surprised if prices for new houses do the same.
The St. Louis Fed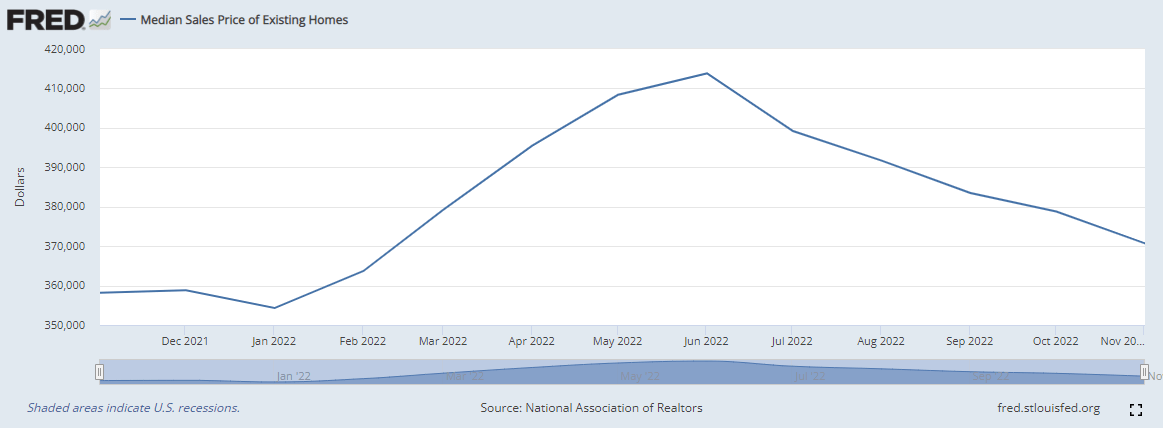
All that said, however, whenever the Federal Reserve stops raising interest rates and whenever the economy does recover from a period of slowdowns, the housing market should continue to do well. On the demand side, while there may be short-term changes in real personal income, there is no reason to expect the longer-term upward trend will change any time soon. GDP growth will continue to push real incomes upward. Likewise, the U.S. population is forecast to continue growing, going from 335 million people to 369 million people over the next 30 years. On the supply side, the federal funds rate should steady or could even come back down eventually and construction costs should go on to fluctuate around normal levels, allowing supply to stabilize. That should lead to gradually increasing house prices again as well as a gradually increasing number of new homes sold in the long run.
Caveats
While I tried to capture the major factors affecting supply and demand for new single-family houses, markets like these are complicated and affected by many factors. The housing market crash in the late 2000s, for instance, was an extremely complicated event involving derivatives and numerous interrelated factors. I also did not cover the full set of input costs such as wages or lot prices and so on. I also did not consider here any substitution effect between existing houses and new houses (mainly because the existing house data does not go back as far).
In addition, housing is inextricably tied up with the rest of the economy. For instance, shelter makes up nearly a third of the CPI measure, which in turn influences actions that the Federal Reserve takes.
Finally, while I was able to separate supply and demand shifts enough to analyze a few trends, it is impossible to separate them out perfectly as the two can shift at the same time and I only have access to monthly or sometimes quarterly data. While I still believe the analysis is directionally correct, these caveats should be taken into account.
For the short term, if the Federal Reserve pauses raising interest rates or if expectations of a recession prove unfounded, either one of those would change my expectations for new house prices and quantities in 2023.
Conclusion
Understanding the fundamentals of supply and demand shifts helps to shed light on historical events and trends in the U.S. new single-family housing market. By looking at month-to-month changes in the quantity of new homes sold and calculated monthly mortgage payments, I was able to separate out and estimate shifts in supply and demand. From there, it appears that demand generally shifts outward with rising incomes and an increasing population, but falls in periods of recession. Supply typically remains stable, all else being equal, but shifts inward with rising input costs, which include the federal funds rate on the mortgage-lender side and construction materials on the homebuilder side.
Given that the U.S. could be entering a period of economic slowdown and that the federal funds rate is still increasing, my expectation is that both supply and demand are shifting inward, which should assuredly cause the quantity of new houses sold to fall. At the same time, given record-high mortgage payments, it seems unlikely that nominal house prices can remain high for very long. For mortgage payments to decline, it would require demand to shift inward even further than supply. While I anticipate that both prices and quantities for new houses will likely fall in 2023, in the long run they should start rising again as supply stabilizes and demand returns to its outward trend.
Be the first to comment