

tdub303/E+ via Getty Images
1. Happy New Month! Back above the 10-month (i.e. ~200 trading days) average as at the end of March… They say nothing good happens below the 200dma. Crisis averted? Albeit, as a side note, interesting to note that the real/CPI-adjusted S&P 500 is still below its 10-month average.
Topdown Charts, Refinitiv Datastream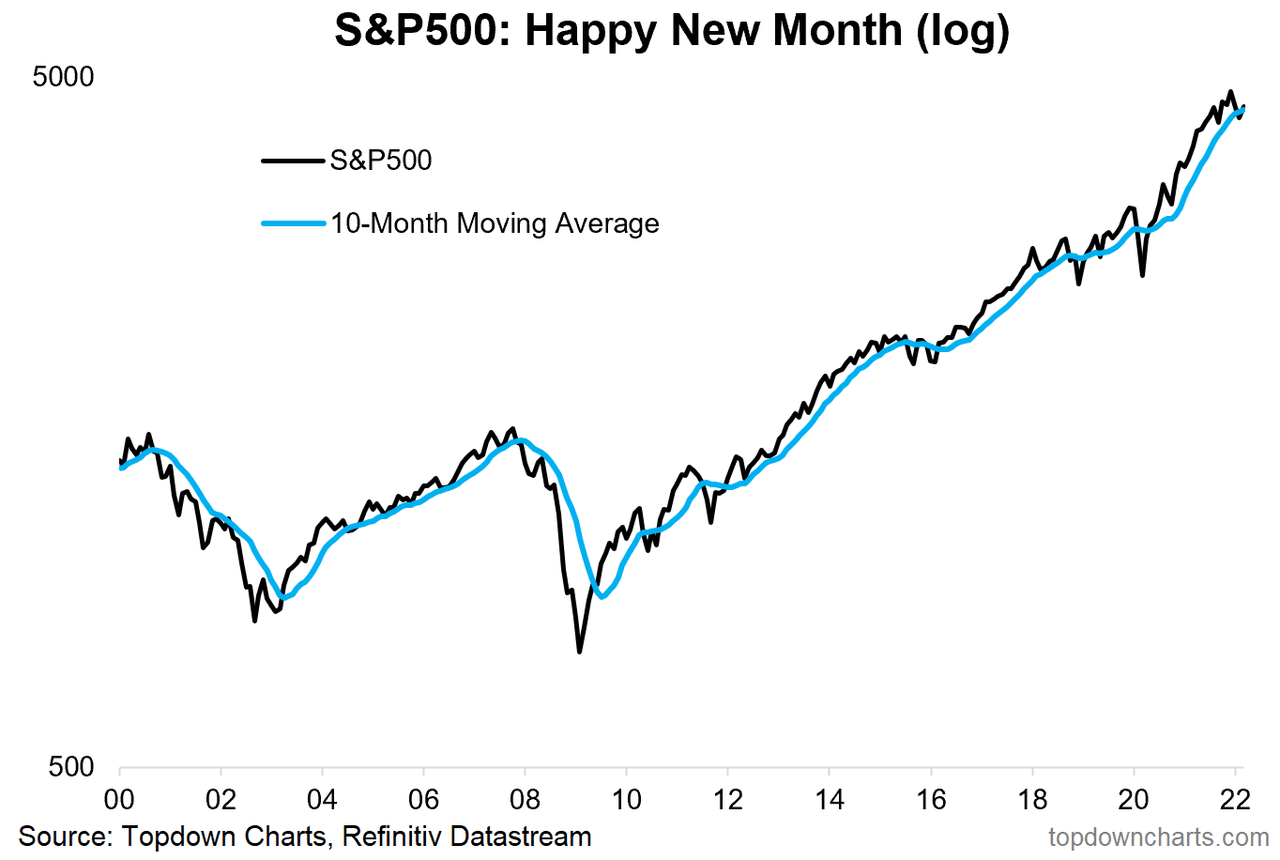
2. Seasonality Statistics: April is historically the best month for the S&P 500 in terms of average return and proportion of times positive.
(albeit it was negative 26% of the time, and worst April was -9% …i.e. note the StdDev)
Topdown Charts, Refinitiv Datastream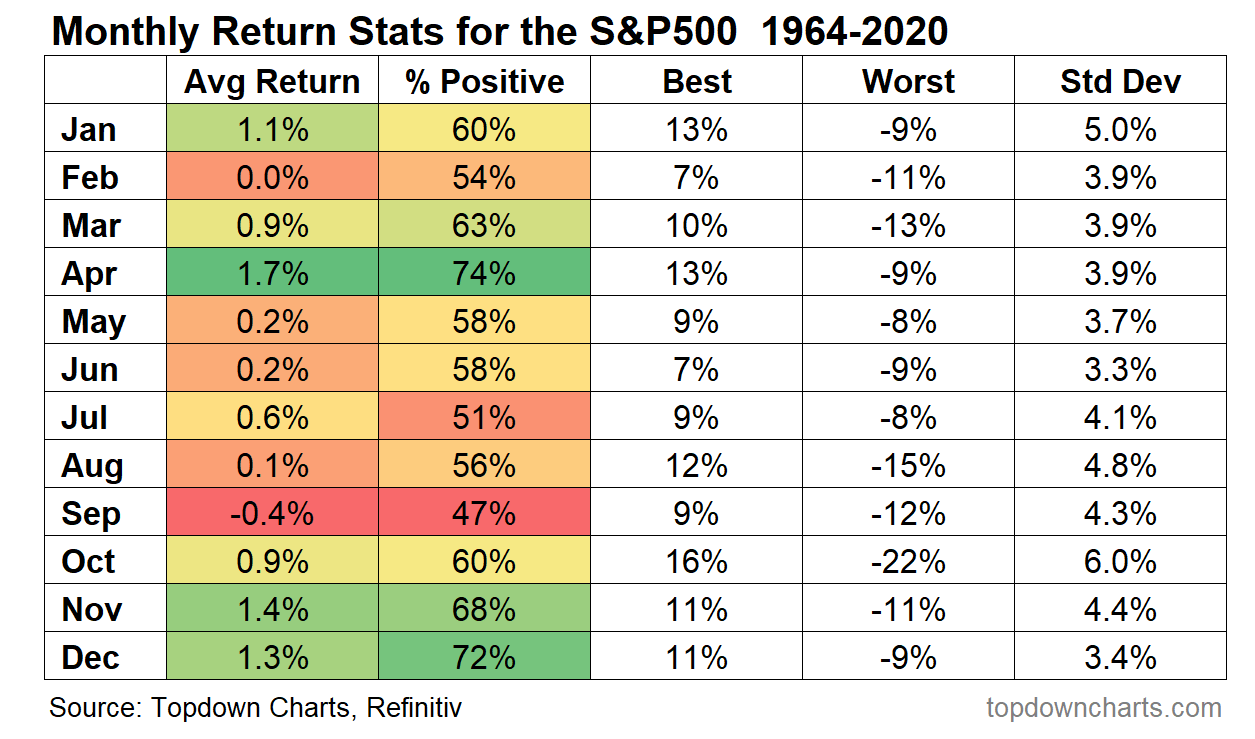
3. March Returns in Focus: US Large Caps March performance in context… Up 3.6% on the month in March, but still down -4.9% YTD. This year the winners have basically been cash and commodities, whereas fixed income was the biggest loser.
Topdown Charts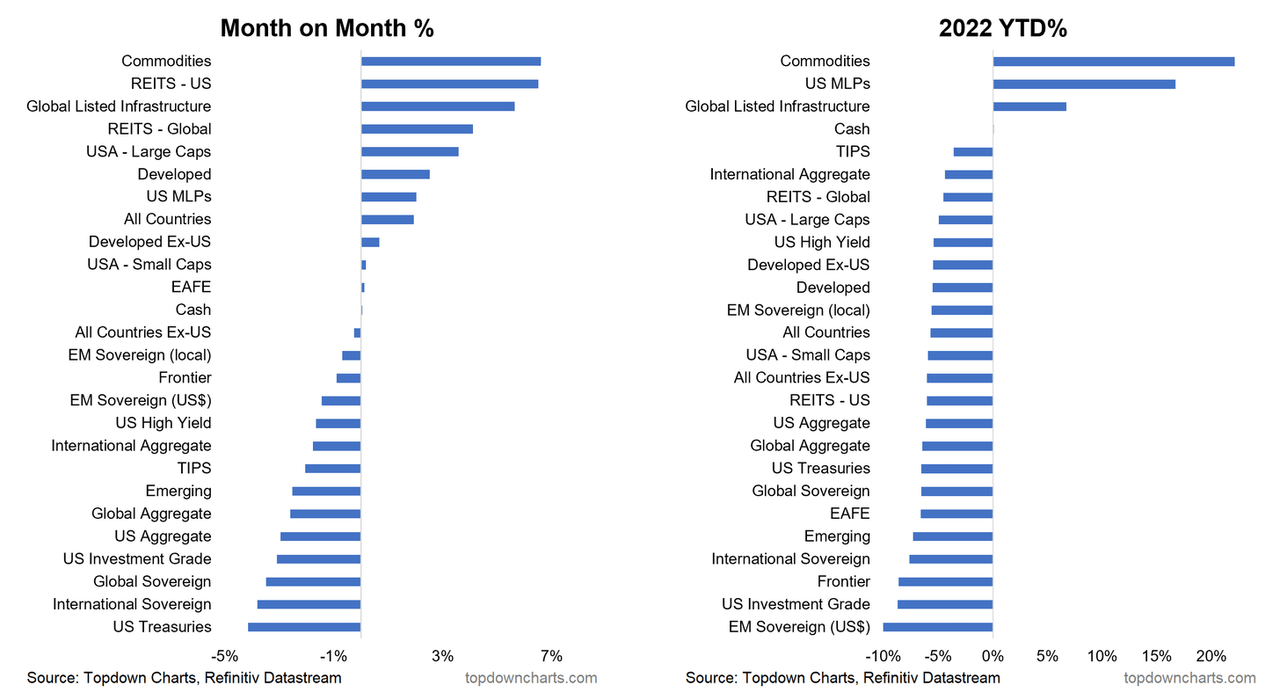
Source: Asset Class Returns
4. Cyclicals vs Defensives: Emerging Markets Cyclicals vs Defensives relative performance line peaked 9 months before the same for the USA did. And troughed in October… bullish or bearish?
Topdown Charts, Refinitiv Datastream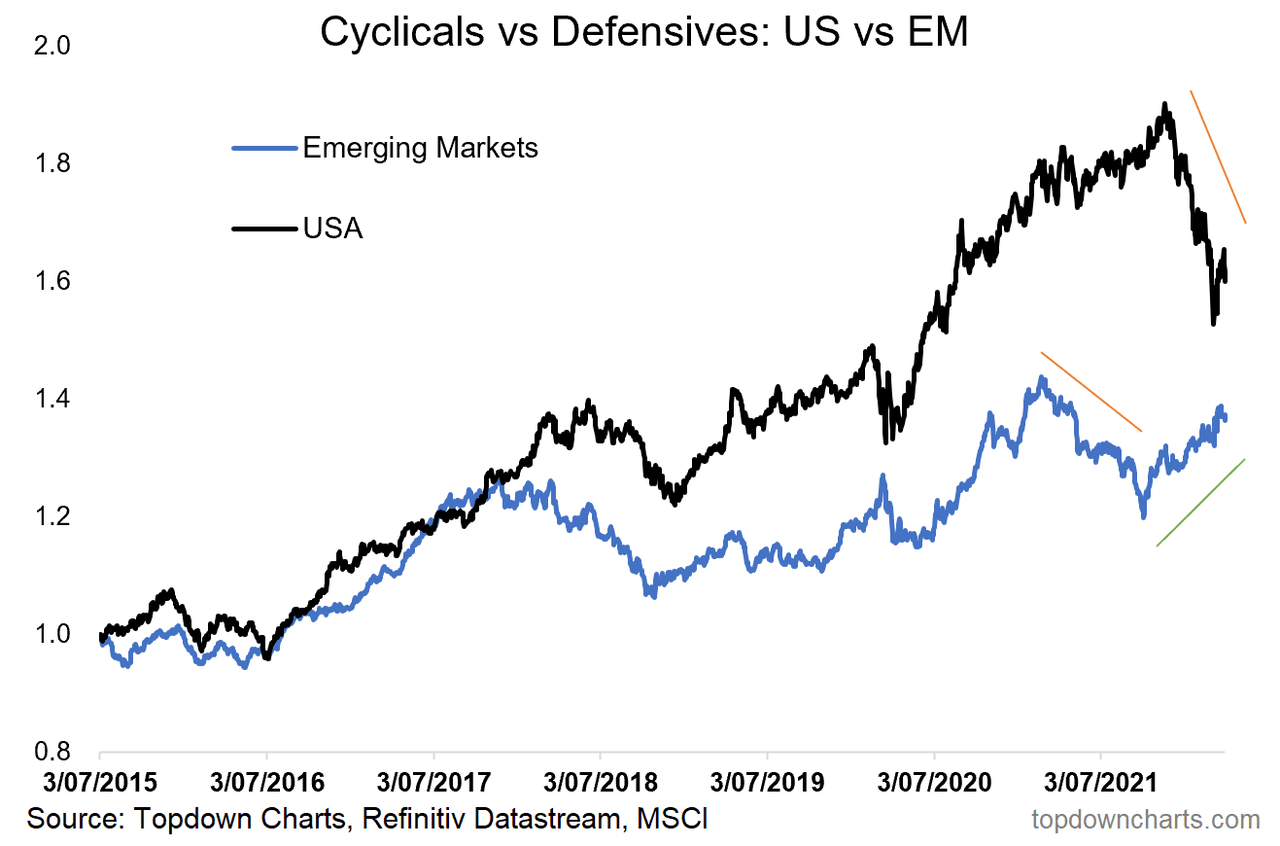
5. Corporate Bond Market: Corporate bond breadth is not confirming the strength in the S&P 500 at this stage. To be fair much of the weakness there is about duration vs credit, but we can’t ignore the impact of higher bond yields in general…
@McClellanOsc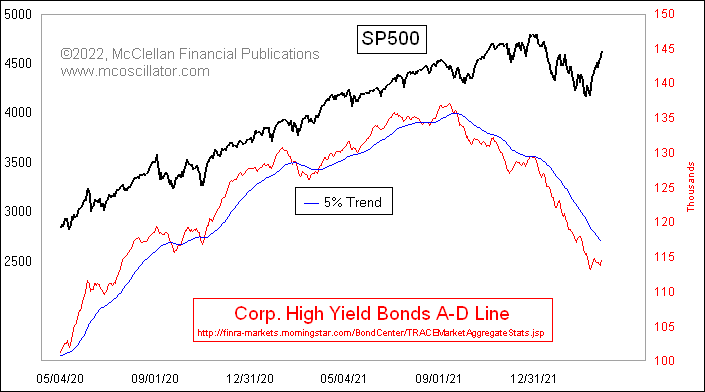
6. Homebuilders vs Mortgage Rates: Higher yields are hazardous…
Don’t underestimate the impact of higher bond yields. On my numbers, the indicative mortgage servicing cost indicator has gone up 94% since the low point (and that may cause issues for the wider growth outlook).
@MrBlonde_macro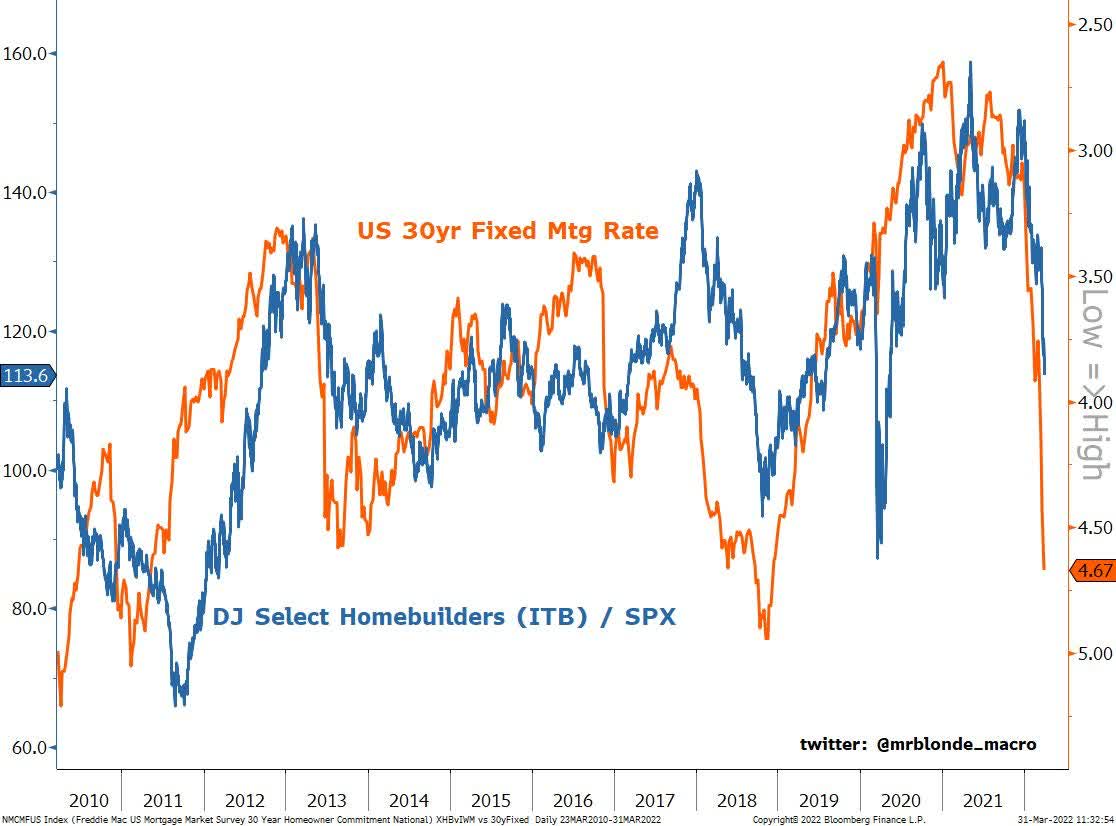
7. Price Targets: Analysts think the techy sectors have the biggest upside.
FactSet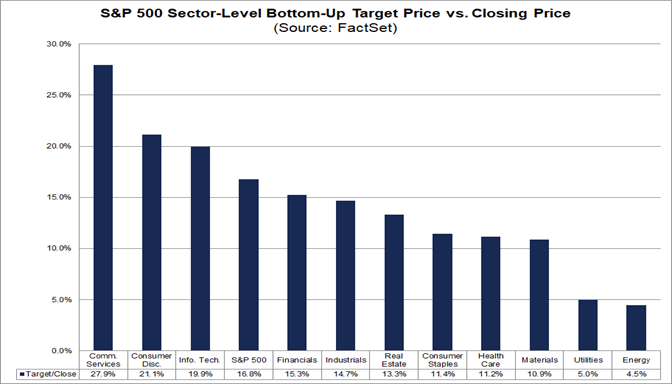
Source: FactSet
8. European Equities: Thanks to heightened risk of WW3, European equities are now trading at a record valuation discount vs USA. Some will note that this didn’t matter throughout the past few years that you could have made similar remarks about the valuation discount, but we are at an extreme here and extreme valuation readings take on much greater weight.
@Ozard_OfWiz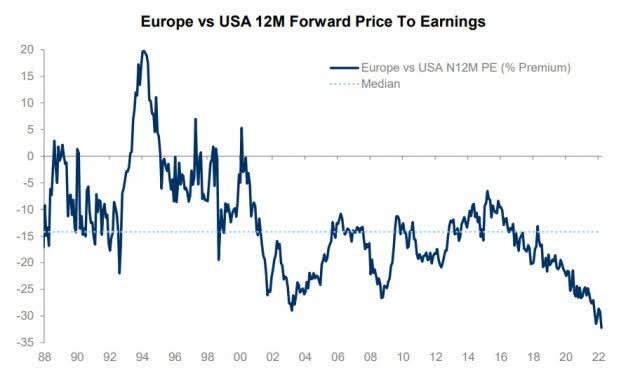
9. Price to Book Valuations: S&P 500 price to book ratios still at eye watering levels.
Correction barely put a dent in valuations: Upper Quartile of industries are trading at price to book ratios *higher* than that seen during the dot com bubble, and this is despite a (minor) reset. Even the Lower Quartile is at the upper end of the range, and last but not least: the Median is well above that ever seen in recent history.
Topdown Charts, Refinitiv Datastream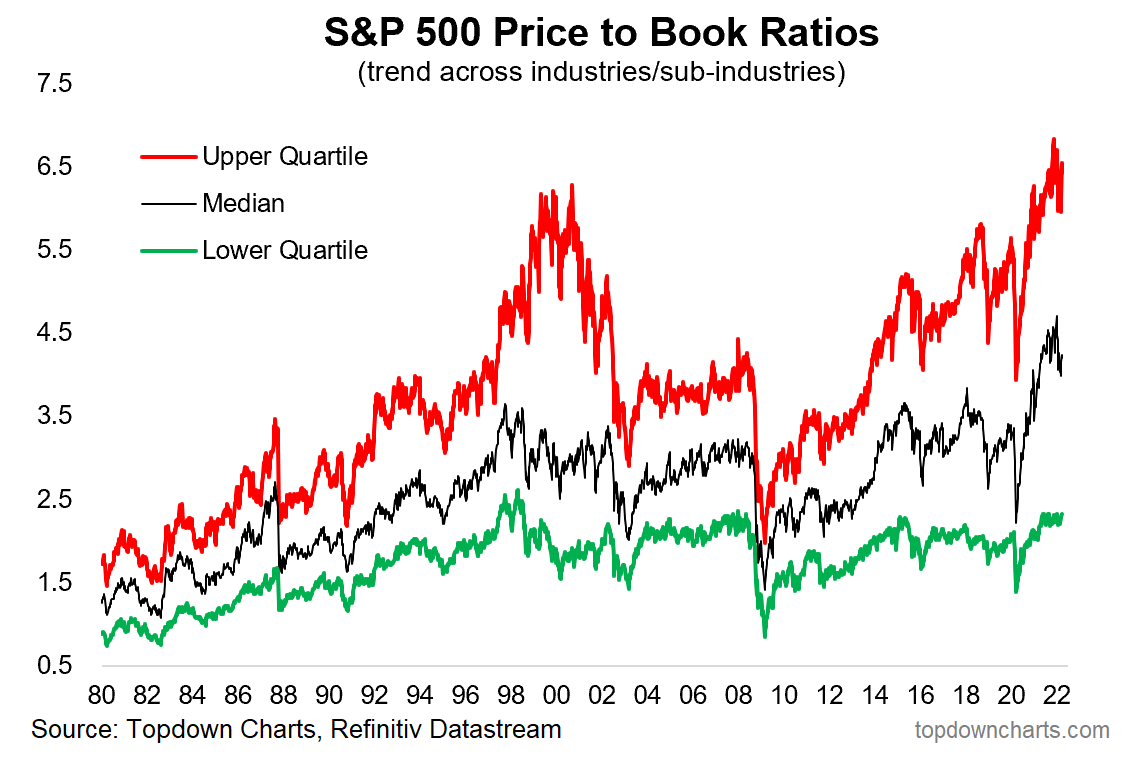
Source: Chart of the Week – Vertiginous Valuations
10. SaaS Valuations: Software valuations on the other hand corrected quite a bit (at least compared to recent history – and of course we do need to assume those “Next Twelve Months’ revenue forecasts” are correct…)
RedPoint Ventures via @SnippetFinance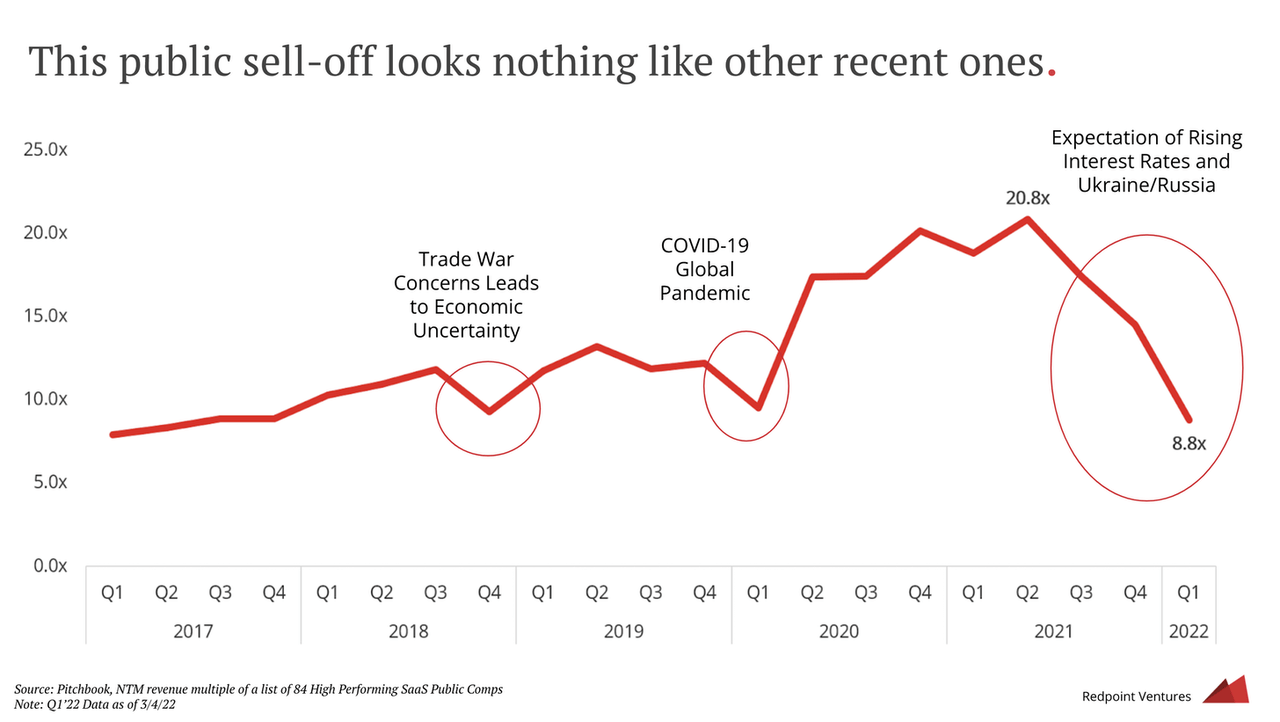
Thanks for following, I appreciate your interest and support!
oh… that’s right, almost forgot!
BONUS CHART >> got to include a goody for the goodies who subscribed.
IPO Market Update: As you might guess, and as usually happens in times of heightened volatility and drops in valuations, the number of IPOs pulled during March spiked to a record high.
Topdown Charts, Refintiv Datastream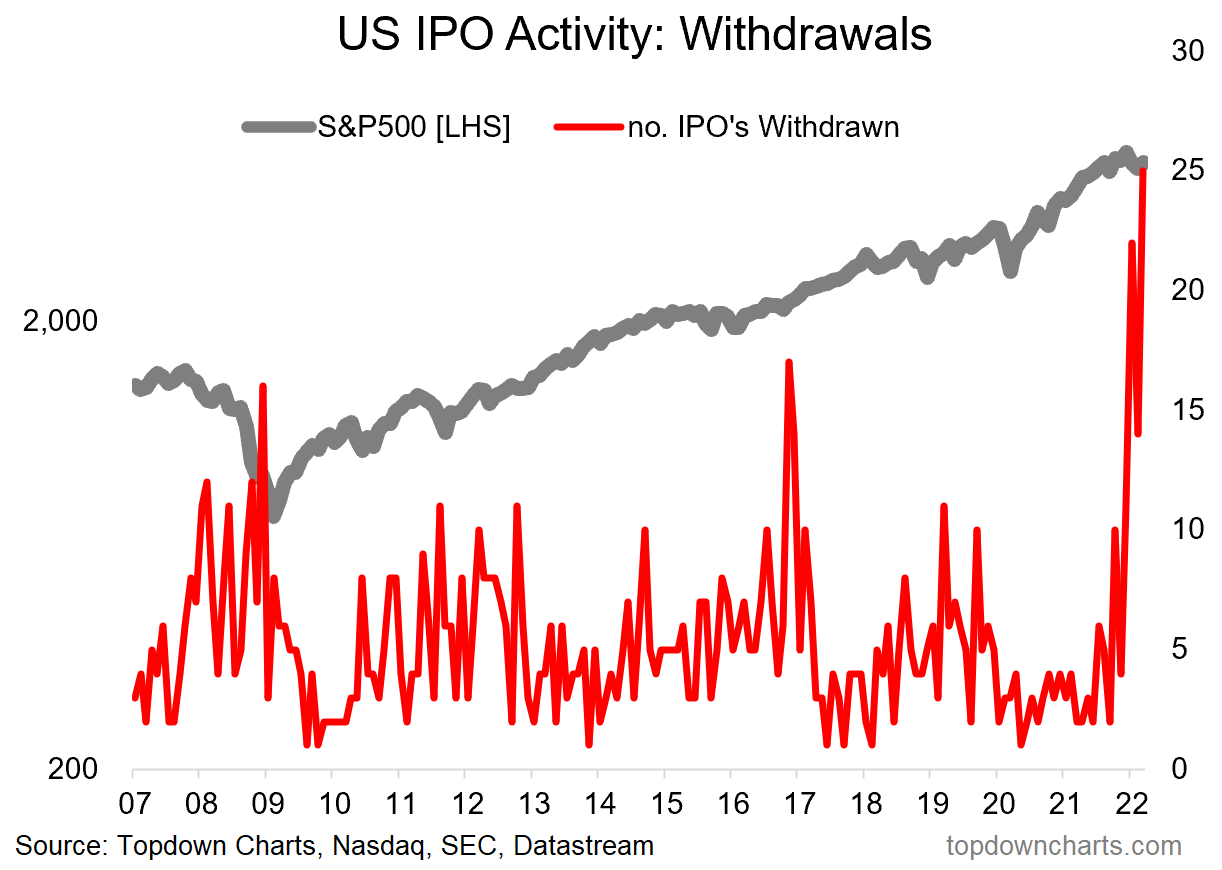
Of course it should be taken in the context of previously booming/bubbling IPO filing activity – which reached a record high earlier last year.
Topdown Charts,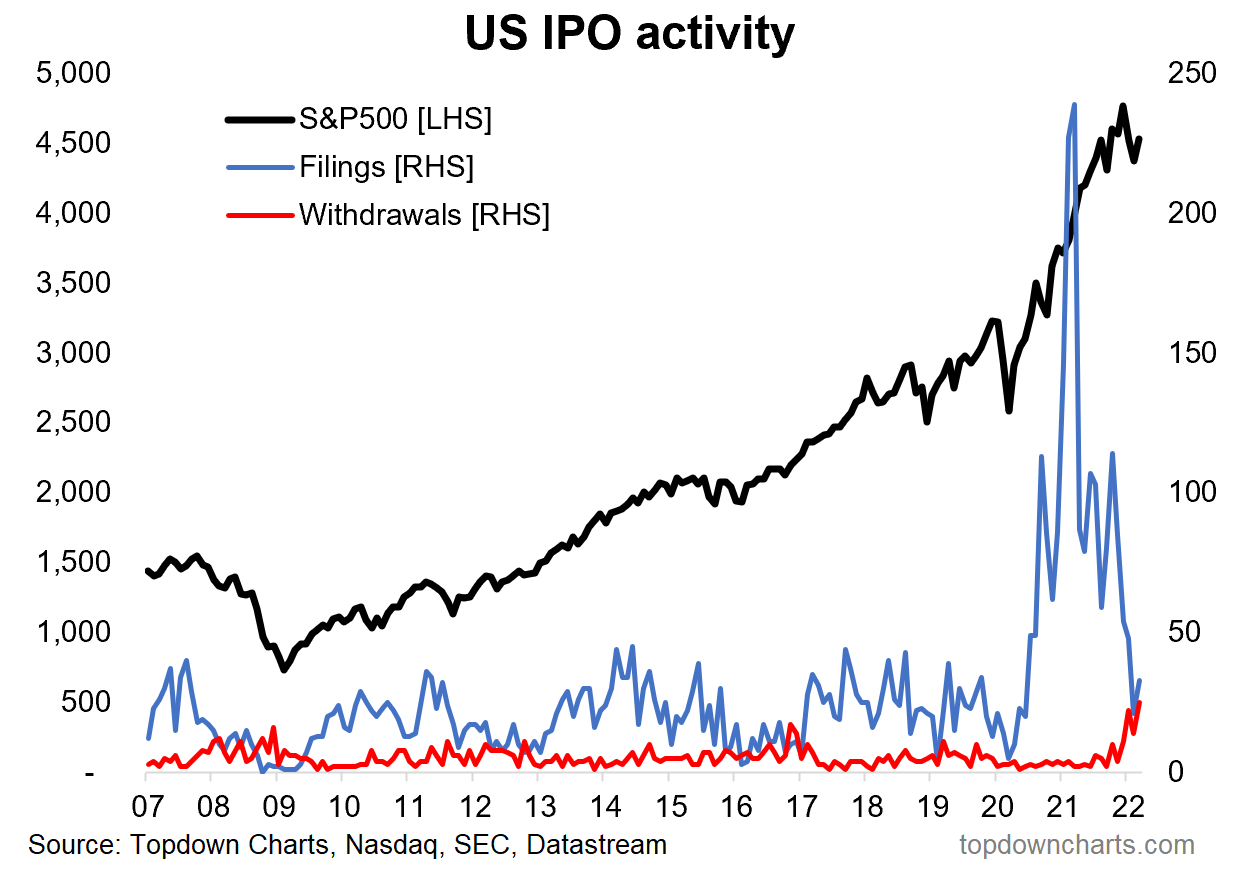
I’ve previously highlighted these and similar charts, and perhaps the biggest takeaway is that the surge IPO withdrawals represents a barometer of sorts of the overall investor sentiment and liquidity backdrop.
Late 2020/early 2021 was perhaps the zenith of the liquidity surge and investor euphoria. But now the liquidity tides are going out (e.g. Fed rate hike kick-off + QT soon), and sentiment is starting to shift…
Be the first to comment