

Tippapatt
Powell’s New, New Mandate: Break the Fed Put
‘Changing the inflation target is not something we are thinking about.
And it’s not something we are going to think about thinking about under any circumstances. Our inflation target is 2%. Full stop.”
Fed Chairman, Jerome Powell. December 2022.
Review and Outlook
|
4Q |
YTD |
1-Year |
3-Year |
Inception |
|
|
Wedgewood SMID Composite Net |
14.8 |
-19.0 |
-19.0 |
11.3 |
11.1 |
|
Russell 2500 Index |
7.4 |
-18.4 |
-18.4 |
5.0 |
5.3 |
Top performance detractors for the year include TREX, Helen of Troy (HELE), FormFactor (FORM), Pool Corp POOL and SAIA.
Top performance contributors for the year include Texas Pacific Land (TPL), Leidos (LDOS), Computer Services, Toro (TTC) and OTC Markets (OTCQX:OTCM).
Top performance detractors for the fourth quarter include most of the detractors for the year, FormFactor, Pool Corp, Broadridge Financial Solutions (BR), Trex and Gildan Activewear (GIL).
Top performance contributors for the fourth quarter include Texas Pacific Land, Burlington Stores (BURL), MAXIMUS (MMS), Leidos and Tractor Supply Company (TSCO).
During the quarter we trimmed Progressive and Texas Pacific Land. We added to Taiwan Semiconductor Manufacturing (TSM) and First Republic Bank (FRC).
During the quarter we were quite active. We trimmed Computer Services, Texas Pacific Land, IAA. We added to Gildan twice, First Republic Bank, Take-Two (TTWO), Toro and Helen of Troy. We added to MAXIMUS early in the quarter, as well as trimmed MAXIMUS late in the quarter. We sold PVH Corp (PVH). We purchased National Research Corporation (NRC).
|
Q4 Top Contributors |
Avg. Wgt. |
Contribution to Return |
|
|
Texas Pacific Land (TPL) |
6.80 |
2.51 |
|
|
Burlington Stores (BURL) |
3.38 |
1.98 |
|
|
MAXIMUS (MMS) |
6.27 |
1.59 |
|
|
Leidos (LDOS) |
5.71 |
1.17 |
|
|
Tractor Supply Company (TSCO) |
4.93 |
1.04 |
|
|
Q4 Bottom Contributors |
|||
|
FormFactor (FORM) |
2.28 |
-0.33 |
|
|
Pool Corp (POOL) |
3.50 |
-0.17 |
|
|
Broadridge Financial Solutions (BR) |
2.07 |
-0.13 |
|
|
TREX) |
2.41 |
-0.05 |
|
|
Gildan Activewear (GIL) |
2.35 |
-0.04 |
|
|
2022 Top Contributors |
Avg. Wgt. |
Contribution to Return |
|
|
Texas Pacific Land (TPL) |
5.21 |
4.31 |
|
|
Leidos (LDOS) |
5.24 |
0.67 |
|
|
Computer Services |
2.89 |
0.51 |
|
|
Toro (TTC) |
1.78 |
0.40 |
|
|
OTC Markets (OTCQX:OTCM) |
2.10 |
0.09 |
|
|
2022 Bottom Contributors |
|||
|
(TREX) |
3.16 |
-3.96 |
|
|
Helen of Troy (HELE) |
3.35 |
-2.67 |
|
|
FormFactor (FORM) |
3.20 |
-2.26 |
|
|
Pool Corp (POOL) |
3.56 |
-2.06 |
|
|
5.33 |
-1.91[1] |
||
FormFactor continued to detract from performance after the Company again disappointed on its revenue and earnings outlook. While the Company likely has overcome its short-term issues with Intel, FormFactor was newly affected by the U.S. Commerce Department’s October announcement of export controls on semiconductor equipment for certain customers located in Mainland China. FormFactor has giving a very conservative outlook for the effects of these export controls and over a multi-year time horizon the Company should be able to work its way around them. Despite what we think are near-term issues, the semiconductor industry’s long-term trend of reinvesting of over 20% of revenues into R&D is still intact. Demand for FormFactor test cards is a function of that new product development and should serve to support attractive growth at FormFactor’s over the next several years.
Pool Corp. detracted from performance despite reporting +10% organic sales growth on difficult year ago comparisons. We think the market is too focused on the effects of interest rates on Pool Corp’s business, often with the stock trading up or down based on whatever the 10-year treasury seems to be doing at the moment. We’ll note that, despite the most prolific and easy monetary policy in decades, especially during 2020 through 2021, new pool installations are only up 6% compared to 2019. The pool care industry has grown a multiple of that, so we think Pool Corp’s future growth is less tied to new pool installation compared to what the market seems to think. Further, overall pool care demand does not vacillate anywhere near as much as long-term interest rates. The Company’s inflation-fueled growth will be stickier compared to what the market currently assumes. The Company’s dominant positioning in the pool care industry is sustainable.
Broadridge detracted from performance despite growing its core recurring revenue at a +9% organic rate. While declines in the equity markets are not new news, Broadridge reported that its capital markets customers continued to show a growing number of total investor positions. Broadridge’s customers include large online brokerage providers that have expanded into the mass market. As more investors carry more positions and instruments, Broadridge’s services are necessary to connect these investors with corporate governance communications from issuers and other service providers. All told, the expansion and technological modernization of capital markets are healthy long-term trends that Broadridge should continue to benefit.
Trex detracted from performance while going through what is now a well-telegraphed correction in channel inventories. Similar to Pool, the market is now disproportionately focused on interest rates and their potential effects on end demand for replacement decking. While near-term declines in revenue look extremely painful compared to 2021, we expect 2023 revenues to still be much higher than 2019 levels, yet the stock is trading not far from where it was pre-Pandemic. The Company maintains dominant market share and is taking share from traditional wood decking, as Trex’s composite products have a lower total cost of ownership. Trex’s competitive positioning is still intact, and the Company should be able to compound at attractive growth rates now that channel inventories have normalized and contractor backlogs are still at healthy levels.
Gildan Activewear detracted from performance during the quarter. The stock is already discounting a 2008-2009 recessionary scenario yet the fundamental backdrop are far from that purported scenario. Revenues and earnings grew at mid-single digit rates, in contrast to the well-publicized inventory adjustments in the mass-market retail channel. The Company’s core activewear segment managed to grow +13%, driven by strong growth in the screen print channel, which has avoided much of the carnage in the mass-market retail channel. The downturn in the mass-market retail channel should serve to winnow even more of Gildan’s competition that wasn’t already driven out during the Pandemic. Meanwhile the Company has been building capacity in attractively located geographies in order to take this share. We took advantage of the overly dour sentiment in Gildan by adding to our position during the quarter.
Texas Pacific Land was a top contributor to performance during the quarter. Revenue grew over +50% as oil and gas royalties were up over +60% driven by higher realized prices on the production of oil and gas on TPL’s acreage, but production of oil and gas also grew +20% over 2021. TPL’s royalty interests span over 880,000 acres in West Texas. Most of this land is located in the highly productive Delaware Basin of the Permian Basin. We expect that development activity will continue to grow at a rapid pace in this region, primarily driven by both domestic and multinational producers looking to maximize returns on increasingly scarce oil and gas capital expenditures.
Burlington Stores posted another difficult quarter of results with comparable store sales (“comps”) declining -17%, yet the stock rallied strongly after the Company noted it began to see improvements late in the quarter. Earlier in 2022, the Company was caught off-guard by dramatic short-term shifts in consumer behavior and found itself in more direct competition with major retailers in the near-term. However, those headwinds are abating as most of the major retailers have worked through excess inventories. Burlington Stores has multiple levers to pull over the next several years that will lead to better growth and returns, regardless of macroeconomic pressures.
MAXIMUS also contributed to portfolio performance as they reported adjusted 18% organic revenue growth during the quarter. While investors continued to fixate on the near-term effects of the Biden Administration’s prolongation of the 2020 Covid-19 Public Health Emergency, the Company continues to win business elsewhere, with a 2.3X book to bill ratio and a backlog approaching $20 billion, including a massive $6.6 billion contract win with CMS. Further, Congress legislated the return of Medicaid redeterminations for 2023, which MAXIMUS will help implement and should lead to substantial earnings growth over 2022. We slightly pared our positions in the holding when it eclipsed our maximum weighting limit of 7%.
Leidos was a top contributor to portfolio performance during the 4th quarter. The Company ended the quarter with a strong adjusted book to bill ratio of about 1.4X. While the significant change in the global defense situation to date has caused some near-term pauses and noise around the ramping of different projects and priorities, Leidos is positioned exceedingly well as a defense contractor particularly to the U.S. and its allies, as we expect a significant increase in U.S. government defense and civilian spending during fiscal 2023. This increased spending should in turn flow through to Leidos’ order book, as they focus on modernizing IT environments and cybersecurity. We continue to hold Leidos has a top weighting as it still trades at historically attractive forward earnings multiple against the backdrop of a new “Cold War.”
Tractor Supply Company contributed favorably to performance during the quarter. Demand from the Company’s niche, affluent rural customer base continues to normalize in a post pandemic world with comparable store sales running +46% higher and total sales +65% higher compared to pre-Pandemic (2019) levels. Despite historically high levels of cost inflation and aggressive reinvestment, the Company has also managed to expand margins relative to 2019, helping drive higher and sustained returns on capital. Key to much of this success has been the management’s exceptional job managing inventories in an environment with unprecedented supply-chain disruptions. The vast majority of the Company’s merchandise is sourced from North America, helping avoid the long lead times that have hurt many trans-Pacific supply chains. Tractor Supply is an exceptional retailer, and we continue to hold it as a top position.
Company Commentaries
Gildan Activewear
Gildan is another company with a business model we believe is misunderstood by the market. Like Steven Madden (SHOO), it is also a company whose historical success is based upon its supply chain; in this case, however, Gildan manufactures their own products, whereas Steven Madden sources the vast majority of its products from third-party producers.
Although Gildan spent the first several years of its existence manufacturing textiles and finished fabric, it changed its operating strategy approximately thirty years ago to focus on selling activewear (primarily t-shirts, later fleece and other products) to the North American screen printing market. As you may know, screen printing is the process used to transfer artwork to apparel with end markets anywhere from fashion apparel to t-shirts for your family reunion. The traditional screen printing industry, as Gildan has focused upon it, consists of thousands of generally small individual print shops, which are served primarily by a handful of large screen print distributors. These large distributors make up the majority of Gildan’s business in the screen printing channel.
There are a few quirks to this business that make it very different than most apparel, shoe, or retail businesses. First, this business is basically the exact opposite of a fashion business, such as Steven Madden’s: a significant portion of this business consists of manufacturing blank white t-shirts. They do not go out of fashion, and they do not expire. Second, and most importantly, Gildan’s big customers in this business, the screen print distributors, win by having inventory available when their thousands of small customers need it. However, as distributors, these customers’ economics depend significantly upon their ability to turn inventories. In plain English, this means that they need to have inventory on hand when their customers want it, but they also don’t want to hold excess inventories.
Gildan built a very successful business over time, with excellent growth rates and healthy levels of profitability, by building a business to serve these screen print distributors perfectly. The Company accomplished this by building manufacturing capacity in low-cost regions in Central America and the Dominican Republic – areas in much closer proximity to the North American end markets than competitors with Asian manufacturing bases – as well as constantly reinvesting cash flows in further capacity expansions and upgrades. This provided a steady stream of incremental modern, high-quality capacity that could serve the screen print distributors with very short lead times – exactly what their customers needed to run their own businesses successfully. Gildan has vacuumed share of this market for a long time. While the Company rarely comments on their market share, we believe their share of the U.S. and Canadian industry now stands over 60%.
Interestingly, for years Gildan stayed within this corner of the industry. Looking back approximately 10-15 years, however, the company made a few strategic changes to pursue new markets and new growth opportunities. As the Company felt it was approaching the maximum share it could expect in the screen print business, it started building capacity to deliver branded Gildan products to mass retailers, such as Wal-Mart and Target. Gildan also made a few acquisitions to break into what it viewed as complementary products in areas such as socks and underwear.
Both moves put them head-to-head versus a fairly entrenched competitor, Hanes [or Hanesbrands], which had long specialized in supplying branded products to mass market retailers. Gildan also was going to market from a different competitive position, as the #2 or #3 player in a market dominated by two or three giant customers, rather than as the far and away #1 vendor in the screen print market.
In our view, this foray into mass-market retail customers hasn’t been their best strategic move. Eventually this culminated in a significant restructuring, resulting in the company attempting to pursue a much smaller, more basic business in underwear, in particular. In fairness, however, the company has fared better in its traditional activewear categories (tshirts and fleece) than it has in underwear, and they have also fared reasonably well in socks, although this is a very low growth category.
It’s worth pointing out that Hanes, around the same period Gildan was trying to move into mass market, spent several years migrating their manufacturing base for its North American business to the western hemisphere, very much like Gildan’s strategy. Hanes also attempted a few sallies into the screen print market, just as Gildan was trying to make an entry into mass market retail. Hanes, even after imitating Gildan’s manufacturing footprint, still found it could not beat Gildan in its screen print market – just as Gildan was struggling to dislodge Hanes in mass market. Hanes eventually exited the screen print market, just as Gildan, now, has stepped back from some of its branded mass market business.
We have ended up with a very healthy separation of the two businesses, in our opinion. The Hanes brand name, and the company’s long experience managing a mass market brand, as well as the management of categories more complex than blank white t-shirts, give it the dominant position with the mass market retailers, whereas Gildan’s advantages in cost and speed to market in the less concentrated screen print market give it the dominant position there. Furthermore, after the migration of its manufacturing base for North America, Hanes has eased up on capacity expansion, and it seems happy to grow at the modest pace of its large mass market customers. Gildan, on the other hand, continues to invest in new capacity as they always have done. We note the Company’s capex as a percent of revenue is nearly 4X the same metric for Hanes. This allows the Company to serve the growth of the screen print market while still playing in mass market as it mops up demand growth that Hanes is not serving with new capacity.
Moving on to the company’s stock, we purchased our initial position in Gildan this past summer, after it had taken a roughly -40% hit from its early-year highs. We believe the market has been spooked by two related issues: the well-publicized inventory corrections at large mass-market customers such as Amazon, Wal-Mart, and Target; and the fact that the Company has begun to build additional capacity after a Pandemic-era pause. We believe the basic thinking is “these idiots are building capacity in a shrinking market.” The problem with this is that mass market is Gildan’s smaller and relatively less important business; the larger screen print business has remained strong. Many of the drivers of that portion of the business (i.e., travel, events, sports) are still recovering from the Pandemic. We suspect the market attributes abnormally large importance to the mass market business because that is the part of the business most people understand. It is much easier, especially for observers who are not specialists in the apparel industry, to track how Wal-Mart and Amazon are doing than it is for them to understand an odd business serving thousands of little print shops. As for the capacity growth worries, the company already has secured business for both 2023 and 2024 with their new capacity; they are not just tossing up some new factories and hoping for the best. We believe the inventory corrections at large retailers will be easing over the next couple of quarters. We already have seen Wal-Mart make considerable progress on their inventory adjustments through their third quarter report, and we expect to see further evidence emerge from the industry as fourth quarter retail earnings are reported. Once these worries are lifted, we expect the market to reward Gildan with more realistic estimates for growth as well as a more normalized valuation.
Steven Madden (SHOO)
Steven Madden is a fashion footwear designer and seller with a dominant market position in the North American wholesale market, particularly in the women’s fashion category. Major wholesale customers span the broad consumer spectrum, from Nordstrom to Macy’s to Amazon, mass market, and off-price retailers. In addition, the company operates a small fleet of its own stores and complementary wholesale businesses in apparel and accessories, as well as a small international business.
While the company would not have existed at all in the first place if not for founder Steven Madden’s skill in designing fashionable shoes, the most important thing to understand about this business is that it now has little or nothing to do with the company’s skills in designing fashionable shoes. The business model’s repeated success over time has been driven entirely, in our opinion, by its supply chain model.
To understand this, we first must look at the broad footwear industry’s supply chain model. For decades, this has remained roughly the same. Shoes have been manufactured in China, originally because labor was cheap, and Chinese manufacturers over a period of time had built the necessary capacity to handle the world’s shoe needs, which also helped to build a labor force with the necessary skills. As you know, this happened in most other industries, as well. On this side of the world, at least in part due to the very long lead times required to ship shoes from the other side of the world, shoe vendors and their retail customers generally have planned for two main seasons each year: Spring and Fall/Holiday. Shoe vendors and their customers would get together nine months ahead of these planned seasonal deliveries to the retailers; the shoe brands would show their customers what they planned to sell for the upcoming season, and retailers would place their orders then. The shoe brands would then place their orders with their manufacturers.
In an industry subject to the whims of fashion, and the unpredictability of weather, there are some obvious flaws with this process. To cite an oversimplified example, if you place a big bet, nine months ahead of time, on bright orange boots for the winter season, and it turns out that you arrive at the selling season and nobody likes bright orange, plus the weather doesn’t cooperate and winter never really appears, you have a problem.
For decades, the industry accepted these risks and consoled itself with the thought that it was at least getting a deal on the cheap Chinese labor. Without delving too far into our opinions on the historical skills of fashion industry management teams generally, we would argue that there always had been a flaw in this thinking, as well. We think it would be clear to most people that the per-unit cost of a product is only one component of your final profit and return on your investment in that unit of inventory. Another obvious input to that equation is the price at which you eventually sell that unit of inventory. If your orange boots eventually sell for 90% off, or get tossed into the trash, your great deal on the cost of manufacturing them doesn’t matter much. Even worse, you probably still have a few months of orange boots that nobody wants still chugging across the Pacific Ocean, and on your balance sheet in inventory.
There are less obvious flaws in this business model, as well. For as start, you have cash invested in an unwieldy string of inventory that is very long in terms of both time and distance; this slows down your inventory and working capital turns and ties up cash that you could be reinvesting in your business or returning to your shareholders. Furthermore, this lengthy, inflexible supply chain has opportunity costs that are not quantifiable. For example, if you happen to guess correctly on fashion and weather, and everyone loves your product, you have limited or no ability to replenish supply of your winning products. So, maybe you didn’t place a huge order for the bright orange boots, but it turns out everyone loves them, and your customers’ shelves are empty; they are begging you for more of these great orange boots, but you can’t get them from your manufacturer on the other side of the world for three months, even if you decide to pay up and fly them over. By this time, its now spring, and the demand is no longer there. Not only do you miss that opportunity, but your customer files this away in their memory, and they are less likely to place a big bet on you in the future.
More recently (although it’s no longer that recent), one additional issue made these traditional supply chains even more outdated: for a good 15 years or so now, Chinese labor is no longer even cheap. So now you have all the flaws of the China-based supply chains without any benefits at all, we would argue. However, despite the fact that this sourcing model hasn’t made any economic sense for a very long time, and despite several large external nudges – including Trump-era tariffs, Pandemic lockdowns and massive disruptions to supply chains around the world afterward – which should have caused shoe companies to take a good look at their supply chain for the first time since 1995 or so, there has been shockingly little progress made on modernizing supply chains over the past few years. A few companies have talked about moving some production to other Asian countries for cheaper labor, which still doesn’t solve the majority of the problems we discussed above, still leaving you with a long, unwieldy, and inflexible supply chain.
Turning to Madden: this company has operated its supply chain much differently. The company has a small manufacturing plant on Long Island, which it uses to manufacture small quantities of shoes created by their design team. They then use their own retail stores to test demand for their new creations. From there, they can choose to pursue their winners; but more importantly, they can abandon their losers. Madden doesn’t need to have a high success rate in designing fashionable shoes. They can design 20 shoes, scrap the 17 that are terrible and have no demand, and pursue the three that work. This does in fact create what we might call an illusion: Wow!, Madden has been really good at designing shoes for a long time. Most investment observers of fashion industries spend all their time looking at merchandise and taking guesses about whether the company is making pretty stuff or not; we believe they completely miss the fact that a company’s supply chain actually determines whether they are presenting a greater or lesser proportion of the pretty stuff.
So, at this point, Madden then can present their winners to their wholesale customers, such as Nordstrom. Nordstrom can feel much more confident about the bet they are placing in a product that already has demonstrated some success. Madden then can place its orders with their manufacturers, and that is where another key differentiation of the business model kicks in: especially for newer, higher-fashion shoes, they have established supply relationships with manufacturers in places such as Mexico. As this manufacturing is much closer than China, the turnaround time on these orders is significantly shorter, which removes a significant portion of the fashion and weather risks and also allows for the placement of replenishment orders if the Company’s retail customers want more. Incidentally, labor and shipping costs are also lower than they would be in China. Madden only has maybe six weeks of cash tied up in inventory in its supply chain, rather than 6-9 months.
Now, we must point out that Madden still places a significant percentage of orders with Chinese manufacturers, especially on more basic, established, large-volume shoes, for which fashion risk is less problematic. They have done this, in large part, due to the scale of the Chinese manufacturing base; perhaps they would have struggled to find manufacturers of the scale they needed in nearby regions. However, especially since the Trump-era China tariffs, the company has been reducing its reliance on China further. Most importantly, Madden started that period with a much more advanced supply chain than its competition and has only improved its position further because of these continuing shifts in its supply chain. Therefore, we established our initial position in the stock, and why we continue to hold a large position now. The market first beat up companies it viewed as “China stocks,” which was fairly arbitrary, since most companies in most industries are “China stocks.” More recently, the market clobbered consumer companies generally after large retailers such as Amazon, Wal-Mart, and Target admitted they had been planning for overly optimistic sales growth after the wild rebound period of late 2020-2021. The stock has been caught up in both of these market uncertainties, at many times leaving expectations and valuation very low.
Meanwhile, Madden’s financial results have demonstrated the superiority of its business model, although those results have been mostly ignored. Growth rates and margins remained steady during the period in which the industry was struggling with China tariffs. More recently, as its retail customers cut back on their orders significantly across most industries, the company had to cut its 2022 fiscal year EPS guidance by (5%); this, however, was after raising it by 6% earlier in the year. The overall effect of its customers’ inventory adjustments has been limited. More importantly, the market has failed to notice that both the longer-term China issues (which still exist) and the shorter-term inventory adjustments by customers actually play to Madden’s strengths. As highlighted above, Madden already has the supply chain everyone else should be building. Furthermore, because of this, in a period during which customers do not want to place up-front orders for shoes, Madden is one of the few companies which, first, did not have nine months of orders nobody wanted already backed up in its supply chain, and second, is able to meet customers’ preferences to place orders closer to need, should there prove to be better demand than expected.
With the stock recently bouncing off valuation levels last seen during the actual, full-blown recession of 2008-2009, we remain very confident in the company’s business model, and in fact we believe it has emerged from the era of China tariffs, Pandemic lockdowns, and the post-Pandemic supply chain disruptions and wild demand variations even stronger than before. We plan to continue to hold a significant position.
Powell’s New, New Mandate: Break the Fed Put
”Changing the inflation target is not something we are thinking about.
And it’s not something we are going to think about thinking about under any circumstances. Our inflation target is 2%. Full stop.”
Fed Chairman, Jerome Powell. December 2022.
The stock market (S&P 500 Index) declined -18.3%. At its low during the year, the S&P 500 Index fell a sharp -25%. Since World War II, 2022 has been the 4th worst year for the broad stock market. The worst year was back in 2008 during the Great Financial Crisis when the S&P 500 Index fell -37%. The next two worst were 1974 (-26% and 2002 -22%). The results for the typical investor in 2022 were likely worse still as many investors (including Wedgewood) had a meaningful weighting in technology stocks (the NASDAQ Composite was -32% in 2022) and an underweight in the leading (by far) energy sector.
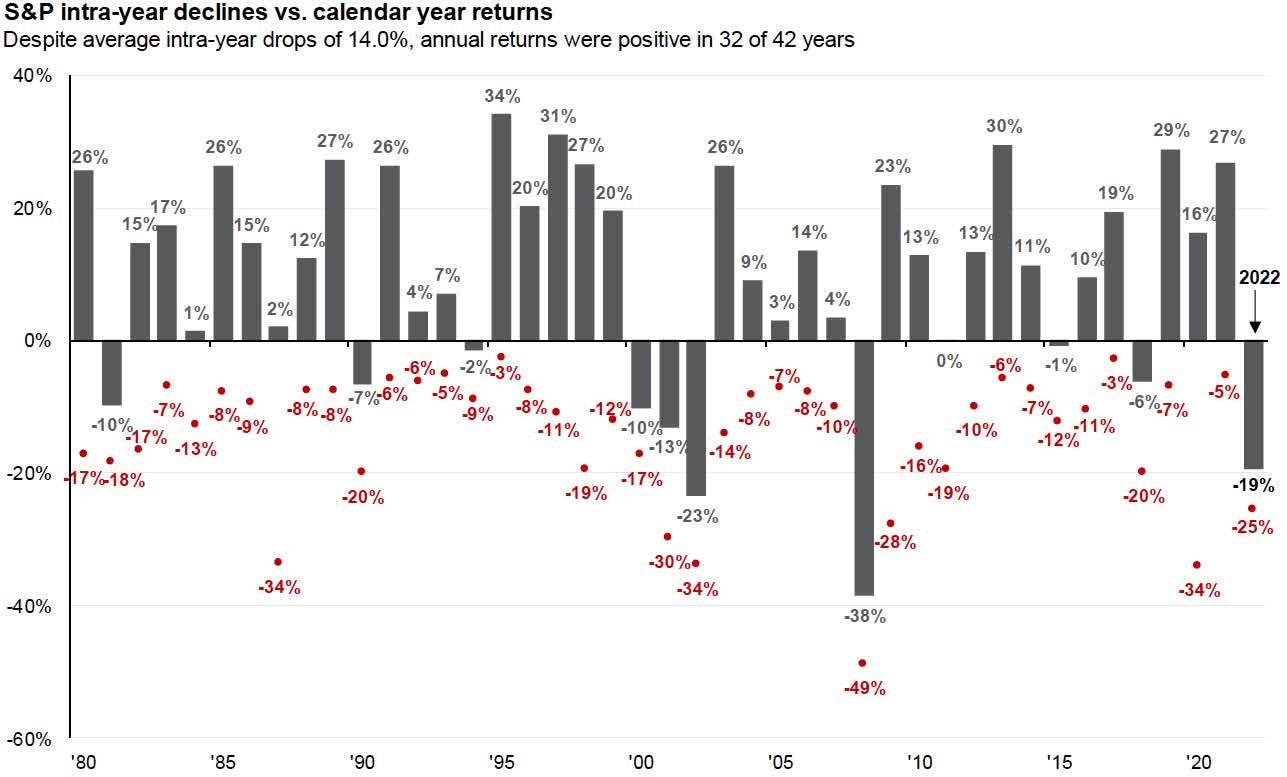
Source: J.P. Morgan Asset Management
We expected a tough year for the stock market as we exited 2021. It really wasn’t a prescient call. Remember that at the end of 2021, market valuations were excessive, corporate margins had feasted on trillion in fiscal and monetary stimulus – and the Federal Reserve was determined to raise rates good and hard. This is how we ended our fourth quarter 2021 Client Letter:
We at Wedgewood expect a very volatile 2022, particularly on the downside – Quantitative Tightening
(QT) will see to that. Quantitative Easing (QE) has been the oxygen for financial markets for so long that we suspect that far too many market participants can’t remember a time without such market-steroids.
The graphic below reminds us that when speculation reigns, markets can go far higher than what seems sober. Relatedly, when speculators lose their collective psychology to speculate, then markets will repeat their long history of falling faster and further than what seems sober.
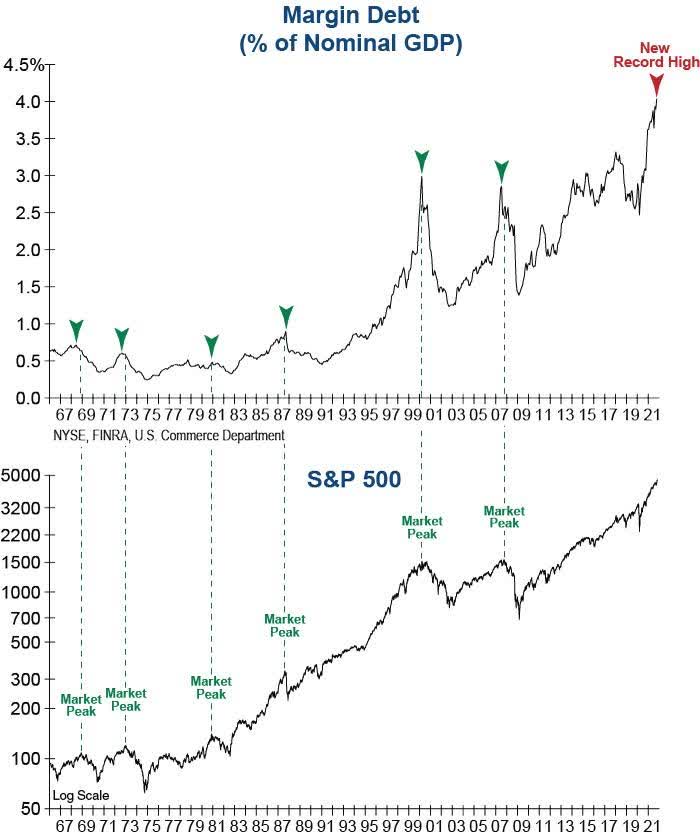
Source: Investech
Here is what the same graphic twelve quick months later
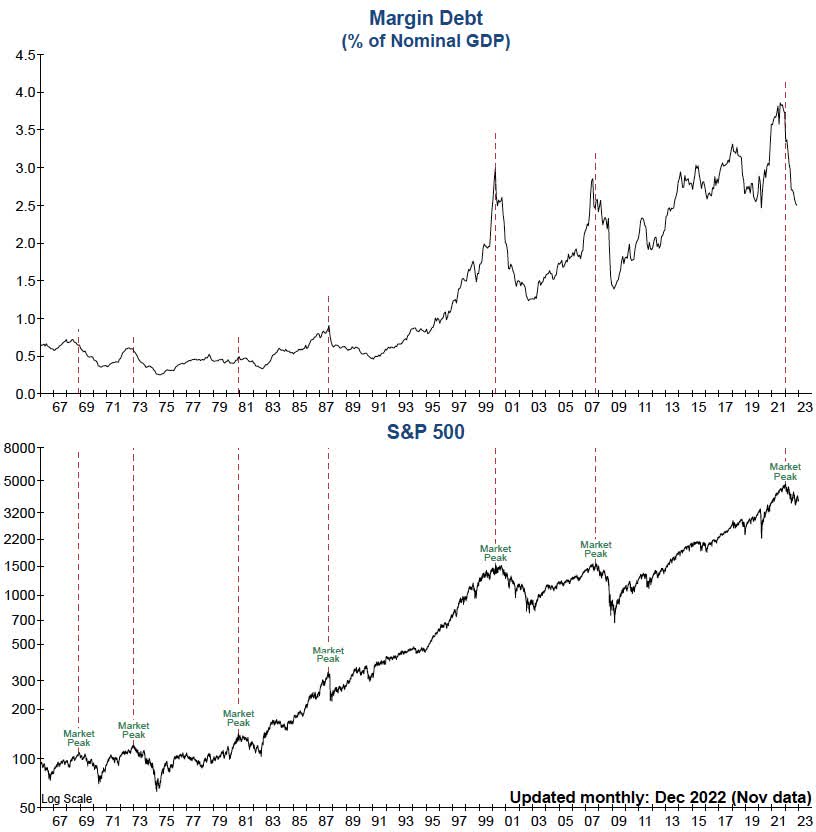
(Source: Investech).
For far too many years we’ve opined in these Letter’s that the Federal Reserve’s new monetary policy of Quantitative Easing (QE) was an experiment with vast potential unexpected consequences. At the risk of torturing a harsh metaphor, the Federal Reserve’s QE experiment would have made Mary Shelley (of Frankenstein frame) proud. As with QE, so too with modern monetary theory (MMT).
The intended benefits of spurring economic growth, as it turns out, were few and far between. The victims of zero-interest policy were middle-class savers, and retirees who “played by the rules” prudently investing their holdings in the highest quality fixed income securities, only to see their interest income evaporate under QE. The outsized benefactors of QE were frenzied financial markets of every stripe, plus hard assets such as real estate, art and a myriad of luxury collectibles (Rolex Daytona’s and Day-Date’s come to mind).
Recall that the Federal Reserve’s balance sheet was “just” $800 billion when Bear Stearns collapsed in 2008. The Fed’s balance would then soar to $4.5 trillion by 2015. During the Pandemic it would explode to $9 trillion.
On the fiscal stimulus front, the policy of Modern Monetary Theory, whereby governments with a fiat currency system can print trillions in digital dollars may be much more of a topic of discussion in 2023. U.S. debt has reached $30 trillion. 45% of our debt must be refinanced over the next three years. According to Strategas, the average coupon to be rolled over is just 1.67%. Interest rates may decline significantly from current levels if Powell & Co. can get inflation to be sticky at 2%. If not, almost $14 trillion in U.S. federal debt will need to be rolled over at rates double and triple the miniscule rate of 1.67%. The size of this headwind is unknown, because we’ve never been here before. It may rival the liquidity shrinkage on QT.
The year 2022 was the beginning of a very different economic environment whereby leverage will be taken out of every nook and cranny of the economy. Powell & Co. with their enormous blunt toolkit, are steadfast in their desire to bring inflation back down to 2% – come bear market and recession hell or unemployment high water.
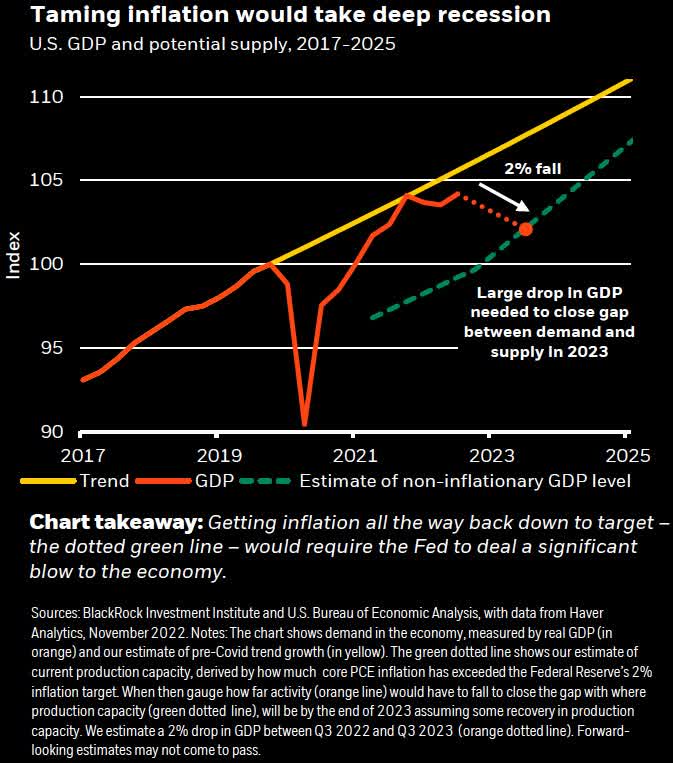
2023 will answer the elephant-in-the-room question: Will the largest financial and hard asset bubbles in U.S. history, injected with steroid 0% interest rates, plus $120 billion per month of Q.E. not either soft-land or hard-land when the post-addicted withdrawal of 5% interest rates and -$90 billion per month of QT fully courses through the circulatory system of the U.S. economy?
An added risk, in our view, is the unstated goal by Jerome Powell in particular, to kill the “Fed Put.” Market participants who expect the Fed to quickly pivot to resume QE after they slay inflation may be in for a rude awakening. Slaying inflation AND killing the “Fed Put” means tighter for longer.
Powell & Co. seem determined to quell any meaningful stock market rally. The last thing the Fed wants is a sharp increase in the wealth effect from the stock market to quash the Fed’s carved in stone playbook to achieve their “2%” inflation” target. The New, New narrative transfixing Wall Street is so-called “Quantitative Pivoting,” whereby the instant QT is over, the Fed will pivot back to QE. In an ironic twist, the long-held maxim, “Don’t Fight the Fed” has become, “The Fed Fights Wall Street.”
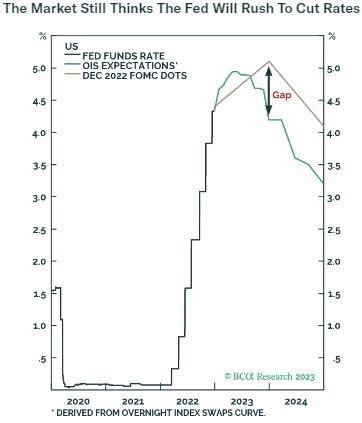
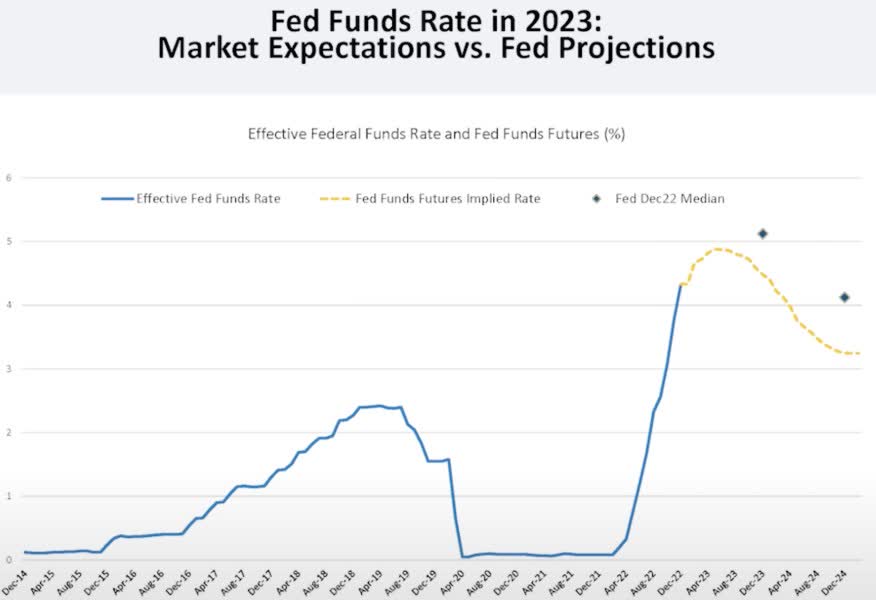
Both stock and bond markets are completely hooked on the Fed – particularly the stock market. Risk-on or Risk-off – we’ve seen it on our quote screens all year long – and it continues as we type this Letter. In fact, we believe it’s not whether Powell & Co. engineer, a soft or hard landing – it’s now all about an “soft or hard pivot.” Regarding the stock market, trying to predict the next “soft or hard” Fed Pivot has almost become an investment strategy in and of itself, and it’s a terrible trap, in our view.
Source: Doubleline
The pace of tightening has been among the sharpest in decades. Time will tell if the Fed can engineer a Goldilocks soft landing, but the Fed has slammed on the monetary breaks about as hard as it ever as – four consecutive hikes in the Fed Funds Rate of 75 basis points is unprecedented.
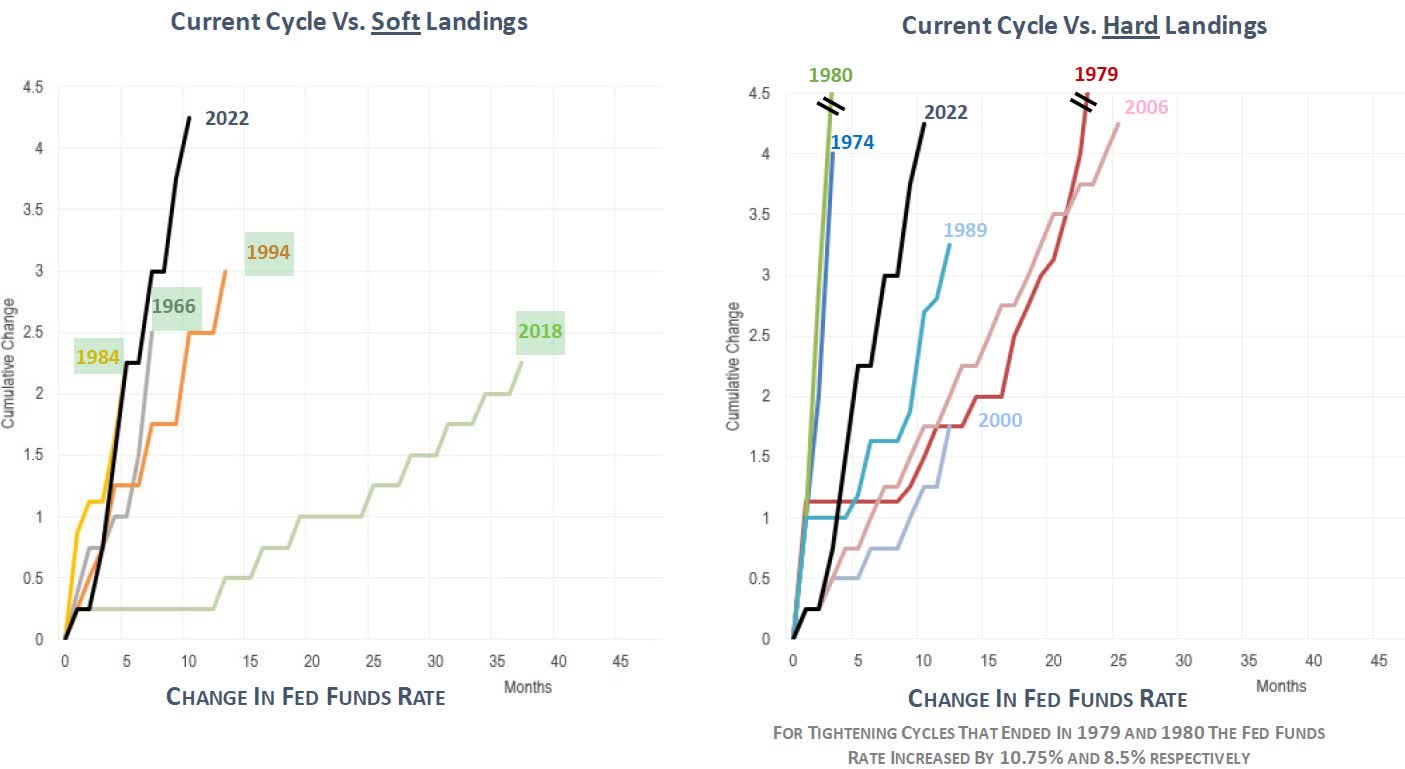
Source: Piper Sandler
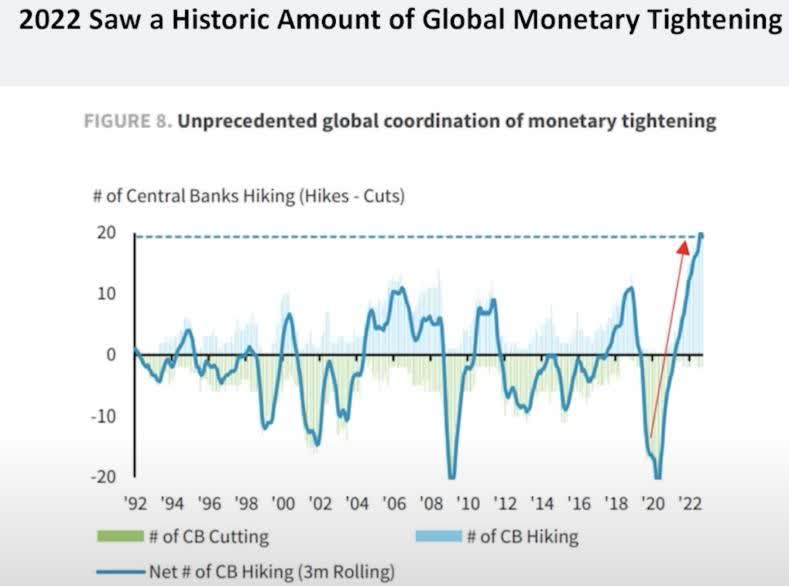
Recall too that while our Federal Reserve has been aggressively tightening for seven months (with one or two smaller hikes to come), but global short rates have been going up precipitously for two years, thanks to the tightening efforts by the European Central Bank, Bank of Japan and Bank of England. While the Fed’s balance sheet was reduced by a relatively tiny -$206 billion (2.4%) in 2022 – the first annual decline since Powell’s first QT in 2018. If QT continues at the current pace of -$95 billion/month, such a reduction will be a significant headwind decline of -$1.14 trillion (13.3%) in 2023.
Source: Doubleline
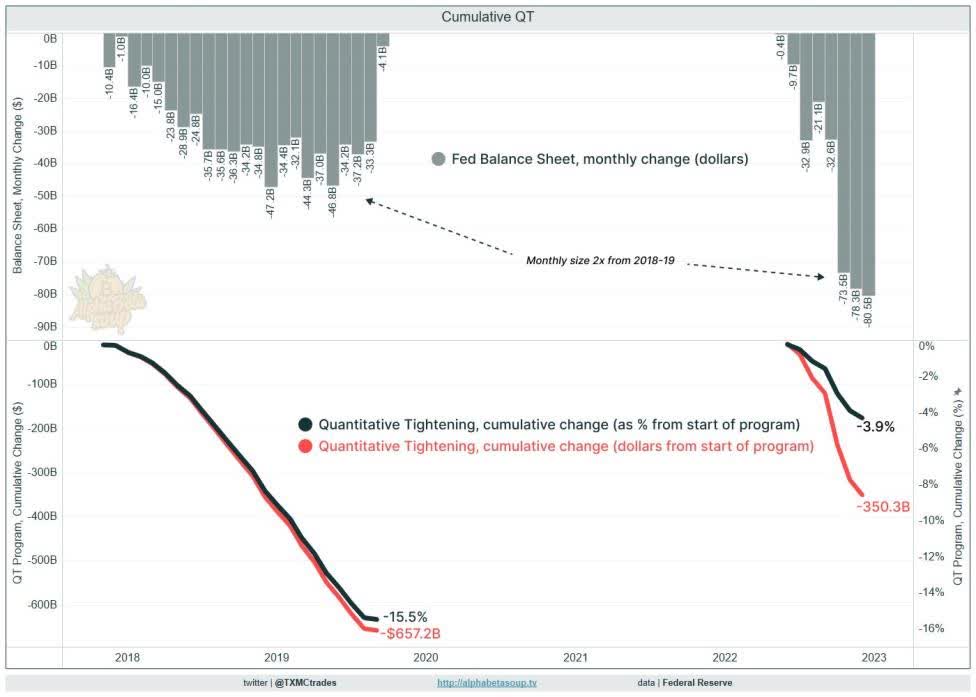
In addition, according to the San Francisco Fed, the impact of Powell & Co.’s QT of $90 billion per month, they calculate that they effective Fed Funds Rate isn’t 4.25%-4.50%, but over 6%. All of this tightening has slammed the yield curve into inversion. Historically a poor omen for near future recession risk, albeit with significant lag times measured in many months – and note, an even worse as a timing indicator for stocks.
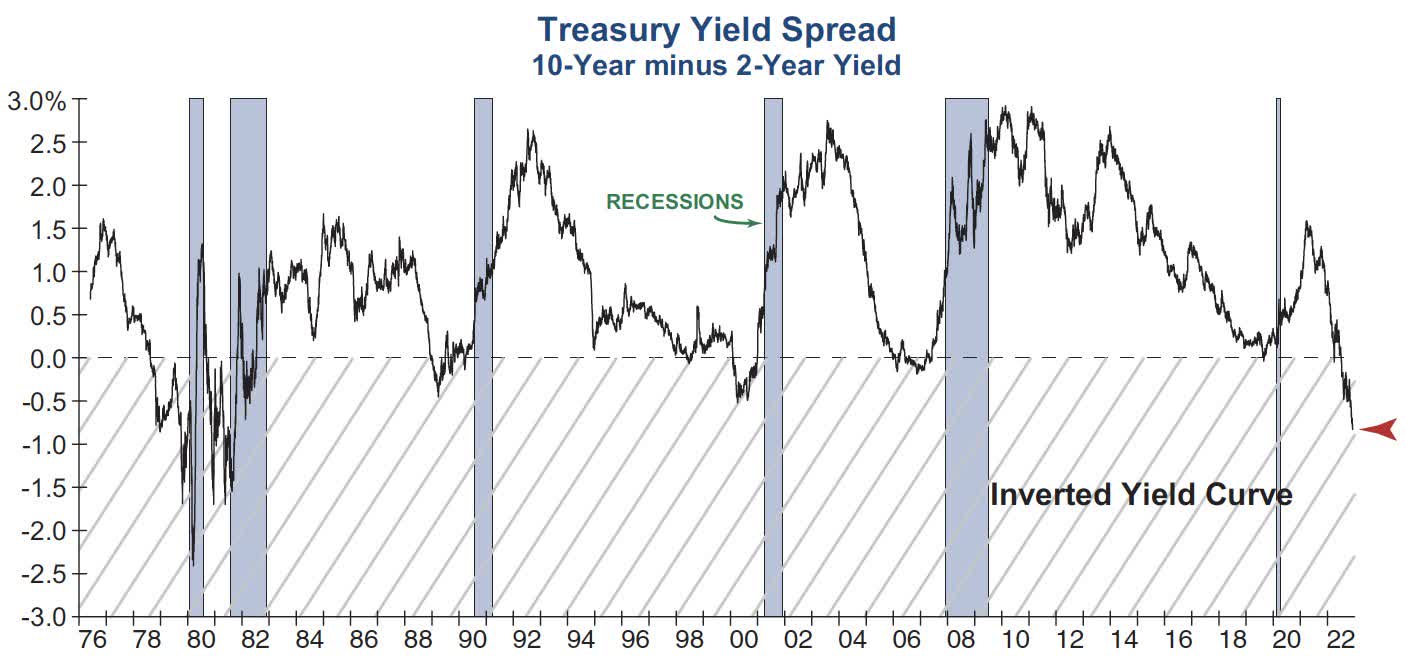
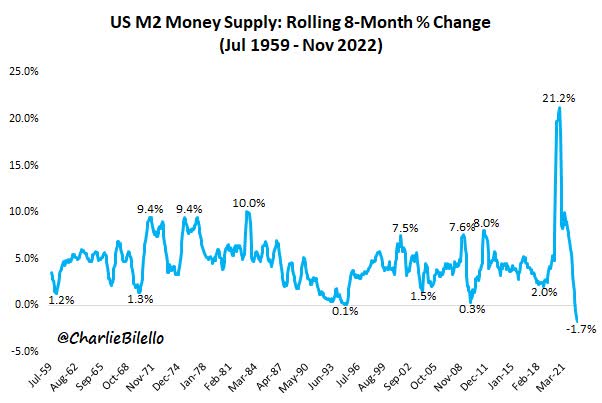
Source: Investech
Such historic tightening has crushed money supply growth to levels, again, for future economic risk.
All of this tightening has started to bite in the manufacturing sector. We’ve chronicled the weakness of various leading economic indicators (Conference Board and various manufacturing PMIs). Even the most recent ISM Services Sector PMI has now fallen into deep contractionary levels last seen during the height of the Pandemic in 2020 – its third largest drop ever.
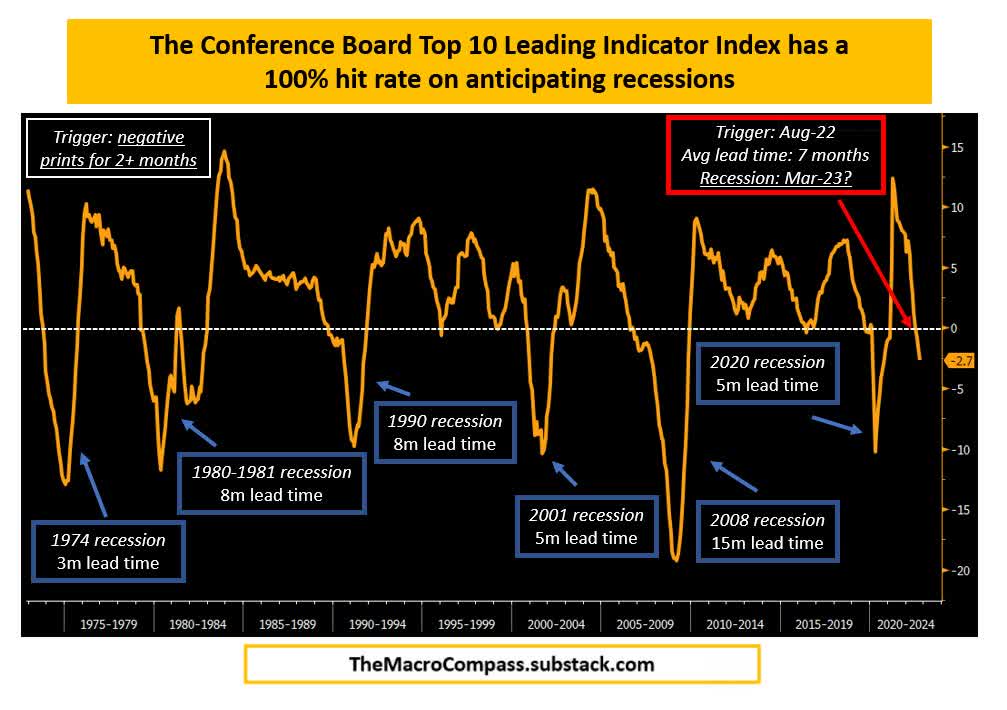
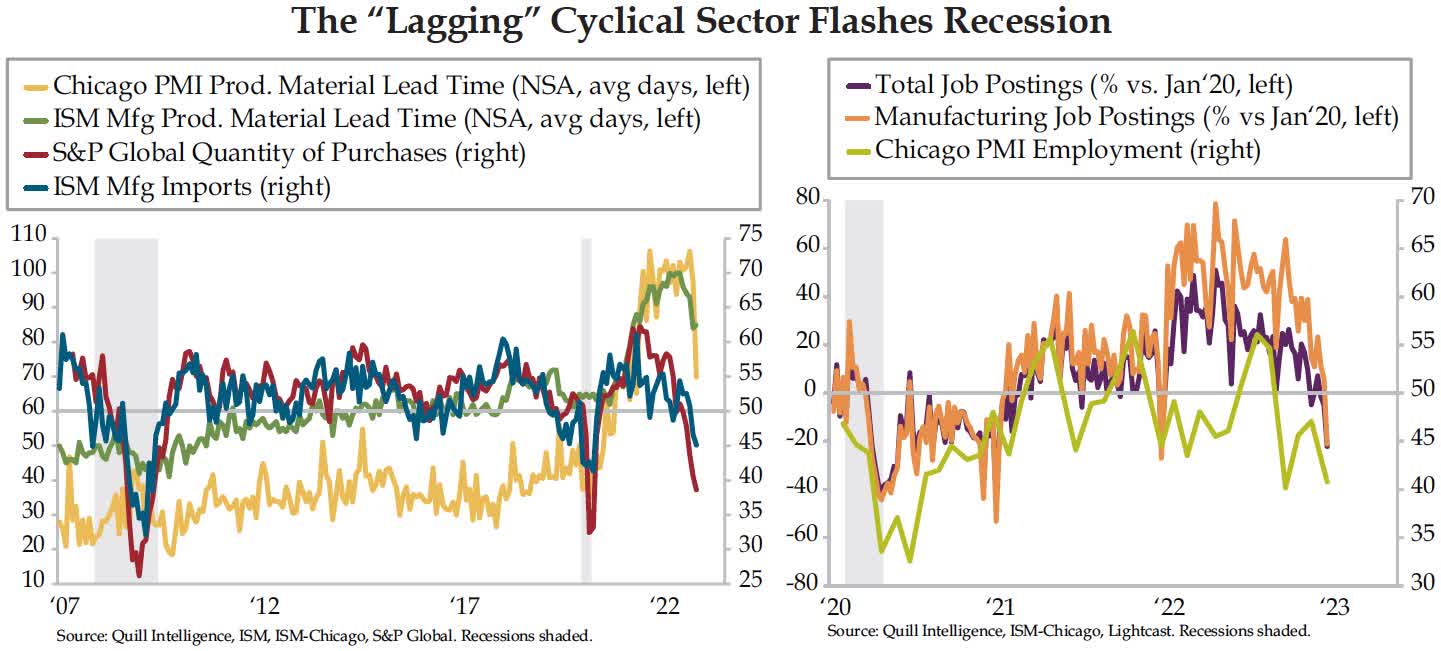
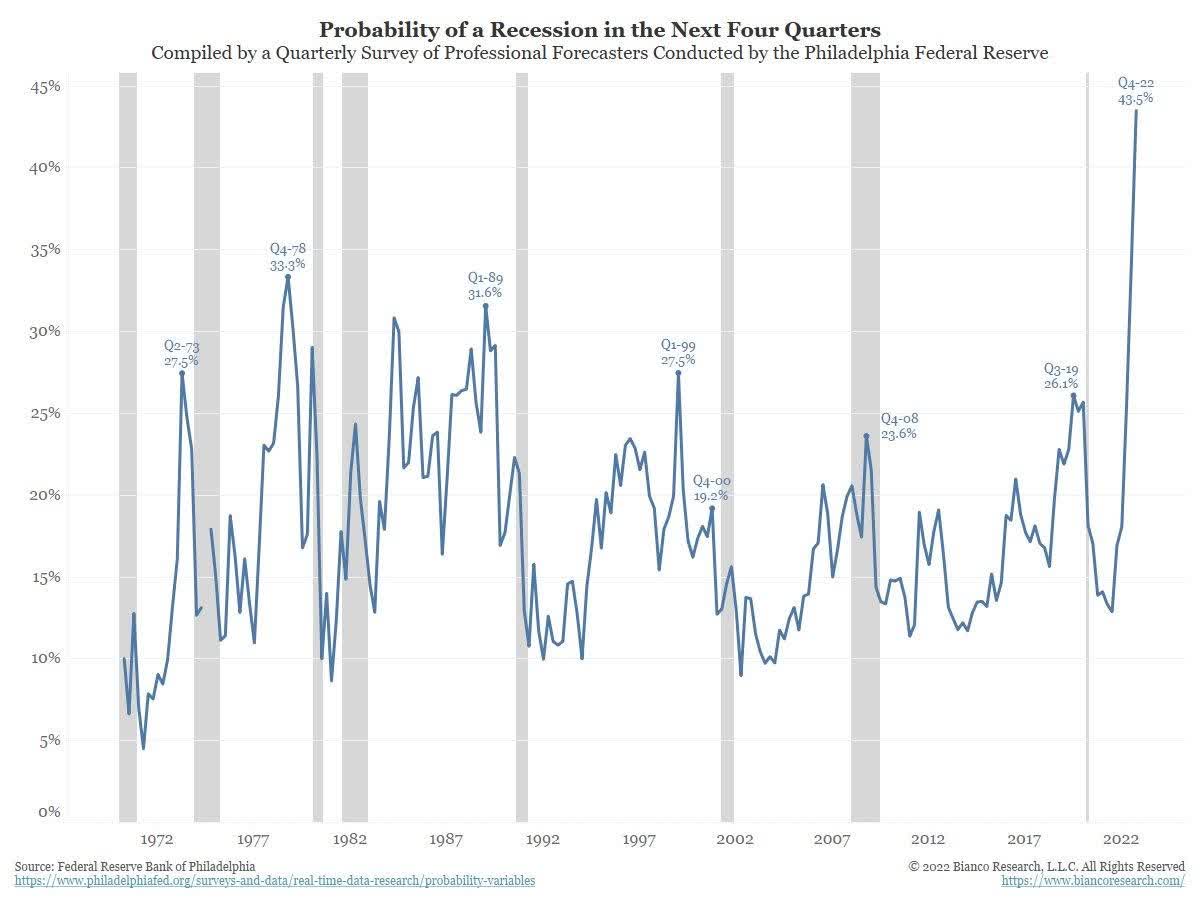
The upshot of the ever-growing list of leading economic indicators flashing red recessionary risks has been slow in accumulating, but, in Wall Street parlance, is not “new news.” Contrarily, finding an economist who hasn’t already forecasted the “2023 Recession” is a tall order.
We continue to be concerned – what we worry about most – in 2023 is a soft or hard landing in corporate earnings. The U.S. consumer has thus far been resilient in their spending. Even though post-Pandemic spending has slowed, it remains positive. Given that the U.S. consumer has long represented about 70% of GDP, even if the manufacturing sector falls into a mild recession, as it did in 2015 to 2016 and 2019, the U.S. may keep the greater U.S. economy out of one. That said, any type of recessionary risk means significant risk for corporate profits. That is our continued worry.
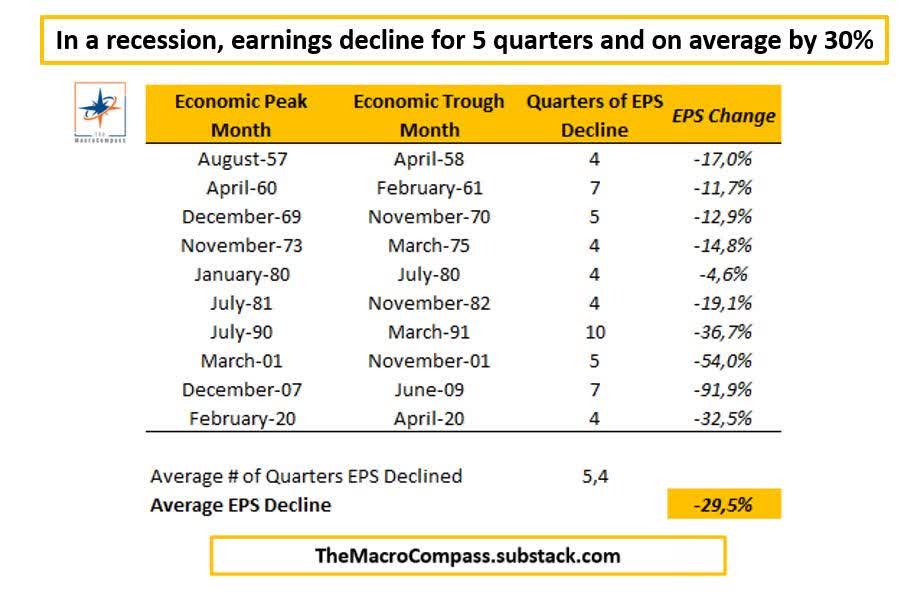
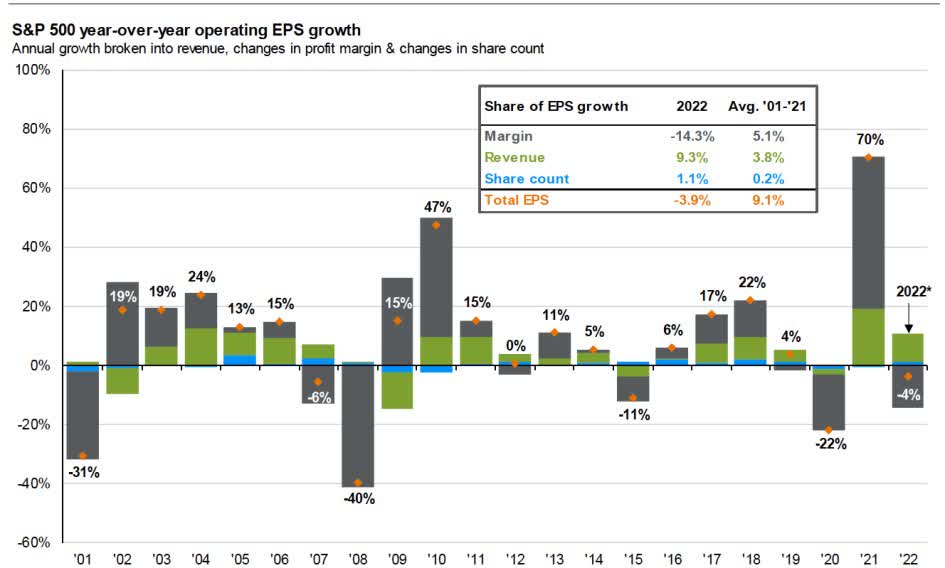
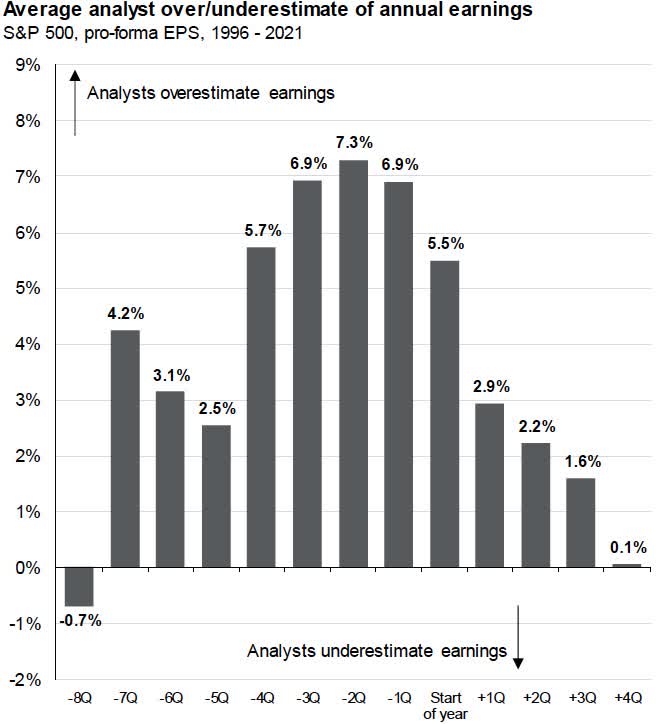
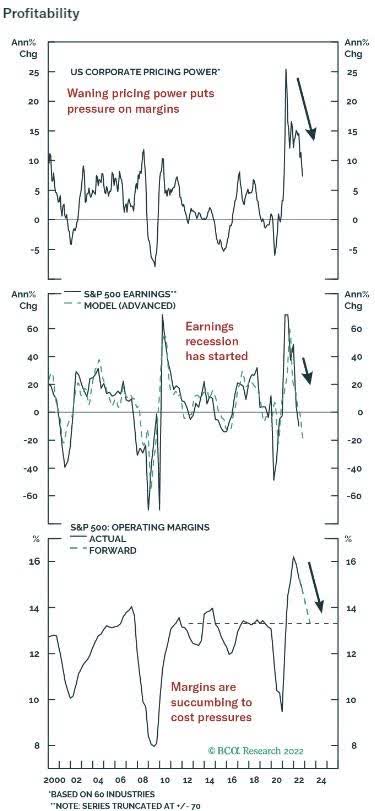
We have considerable reason to be worried. Earning in 2022 were weak enough on much weaker peak-2021 margins, but higher cost of capital still needs to filter through the economy in 2023. Indeed, consensus estimates for 2023 haven’t been cut much at all. That’s not too surprising. Wall Street analysts are typically of the optimistic sort, yet according to FactSet, earnings estimates have been cut -6.5% in the fourth quarter – a considerable decline from the +31% growth in the same quarter last year. Lastly, as we have chronicled in past Letters, corporate margins boomed in 2021, but declined some last year. We suspect that margin pressure will continue to come under pressure for most of 2023.
Source: J.P. Morgan asset Management
Source: FactSet Research
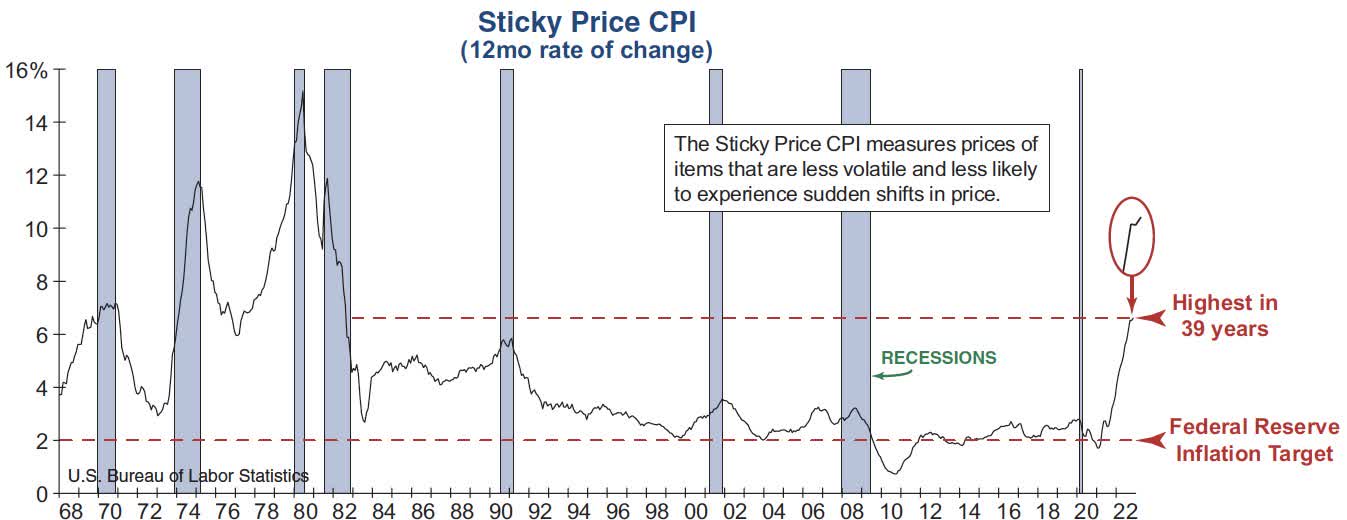
As we enter 2023, Powell & Co. and his inflation warriors are getting what they want: The financial markets have been crushed, financial speculation has all but vanished (crypto, SPACs, IPOs), a bevy of leading economic indicators are pointing to a weaker economy, most inflation measures long peaked last year (some, not all), yet the Fed still faces quite the conundrum.
Source: Investech
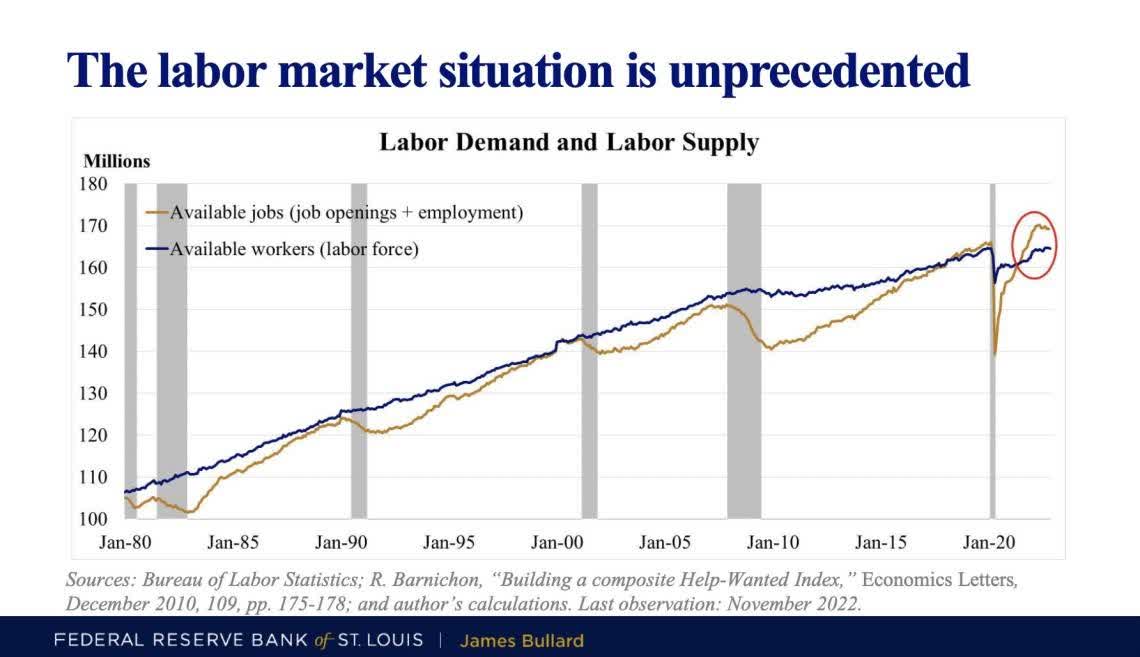
The U.S. labor market porridge remains too hot. To get such porridge “just right” the Fed may keep rates higher for longer – and an added benefit too in killing the “Fed Put” once and for all.
2022 was all about the “P” in P/E multiples. Sharply higher interest rates crushed valuations. We suspect that 2023 will be about the “E.” Similar to our message during the bear market last year, we will continue to be patient and let the market serve up bargains.
We are pleased to announce that Steve Kaufmann has been promoted the role of Director of Business Development and Trading. Please feel free to contact Steve at SKaufmann@wedgewood-partners.com with any questions as to our strategies.
In addition, we are pleased to announce our collaboration with FOCUS Distribution. FOCUS Distribution is a marketing and distribution firm that specializes in representing money managers with unique investment solutions. FOCUS was founded by three previous partners from Miller/Howard Investments, a boutique SMA manager in Woodstock, NY. Together they have over 80 years of combined experience in the Institutional and Retail investment marketing world. They have raised over $15 billion dollars at major wirehouses, regional brokers, institutions and foundations. Based in Woodstock, NY the firm has additional offices in Houston, TX and Philadelphia, PA.
David A. Rolfe, CFA, Chief Investment Officer
Michael X. Quigley, CFA, Senior Portfolio Manager
Christopher T. Jersan, CFA, Portfolio Manager
|
The information and statistical data contained herein have been obtained from sources, which we believe to be reliable, but in no way are warranted by us to accuracy or completeness. We do not undertake to advise you as to any change in figures or our views. This is not a solicitation of any order to buy or sell. We, our affiliates and any officer, director or stockholder or any member of their families, may have a position in and may from time to time purchase or sell any of the above mentioned or related securities. Past results are no guarantee of future results. This report includes candid statements and observations regarding investment strategies, individual securities, and economic and market conditions; however, there is no guarantee that these statements, opinions or forecasts will prove to be correct. These comments may also include the expression of opinions that are speculative in nature and should not be relied on as statements of fact. Wedgewood Partners is committed to communicating with our investment partners as candidly as possible because we believe our investors benefit from understanding our investment philosophy, investment process, stock selection methodology and investor temperament. Our views and opinions include “forward-looking statements” which may or may not be accurate over the long term. Forward-looking statements can be identified by words like “believe,” “think,” “expect,” “anticipate,” or similar expressions. You should not place undue reliance on forward-looking statements, which are current as of the date of this report. We disclaim any obligation to update or alter any forward-looking statements, whether as a result of new information, future events or otherwise. While we believe we have a reasonable basis for our appraisals and we have confidence in our opinions, actual results may differ materially from those we anticipate. The information provided in this material should not be considered a recommendation to buy, sell or hold any particular security. |
| [1] Portfolio contribution calculated gross of fees. The holdings identified do not represent all of the securities purchased, sold, or recommended. Returns are presented net of fees and include the reinvestment of all income. “Net (actual)” returns are calculated using actual management fees and are reduced by all fees and transaction costs incurred. Past performance does not guarantee future results. Additional calculation information is available upon request. |
Editor’s Note: The summary bullets for this article were chosen by Seeking Alpha editors.
Editor’s Note: This article discusses one or more securities that do not trade on a major U.S. exchange. Please be aware of the risks associated with these stocks.
Be the first to comment