

All truth passes through three stages. First, it is ridiculed. Second, it is violently opposed. Third, it is accepted as being self-evident. – Arthur Schopenhauer
No doubt this has been a very painful week for equity investors, reminding us all that risk happens fast, and that stocks exhibit “kurtosis” where extremes happen. I think the speed and viciousness of the decline lends itself to the possibility that this more than a “correction” of 10% or more in the S&P 500 (SPY). We may very well be in a crash.
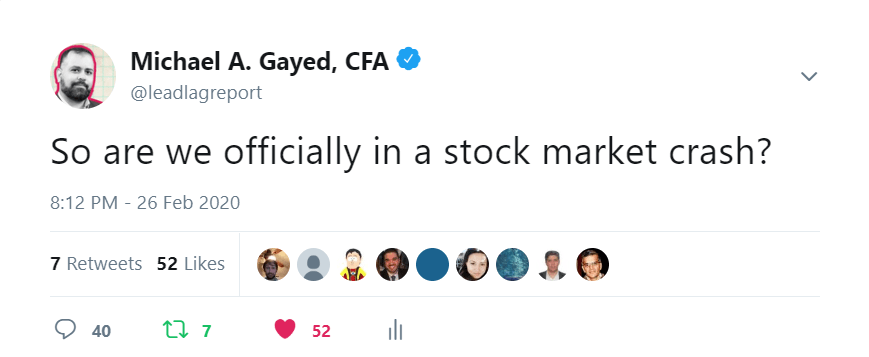
That word “crash” is a scary one that conveys a lot of emotion. The number of responses on a recent tweet I made got quite a few talking about the idea.
My objective here isn’t to scare anyone, but rather to call it as I see it based on intermarket trends and analysis built off of four papers I co-authored. Over the years, I’ve traveled extensively to CFA and CMT Chapters across the country on how to use quantitative signals to anticipate stock market corrections and volatility. Those very indicators are outlined in my Lead-Lag Report here on Seeking Alpha, which allowed subscribers following those signals to completely sidestep this decline as risk-off warnings picked up.
To me, this increasingly looks like we are in a crash. First, we need to define what a crash is though. As I said on Twitter, a crash to me isn’t about percentage (20% as often cited in the media). Instead, it’s about time.
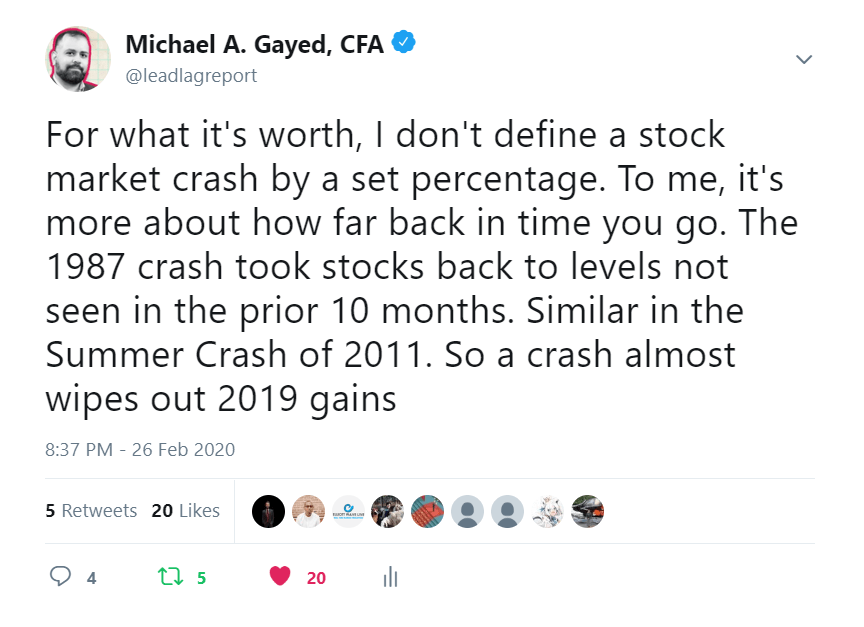
If you’ll go with me that this is more about time than percentage, then this is NOT a crash yet. Stocks have retraced us back to levels last seen in November in just one week.
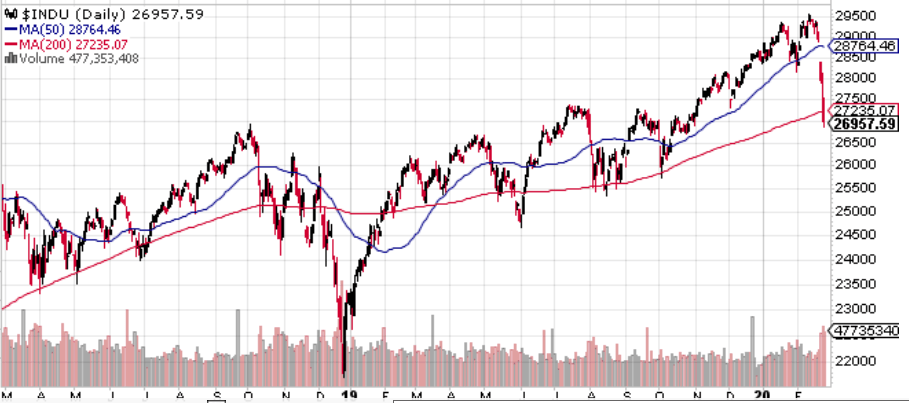
But it’s possible the decline takes us back to prior crash period time reversals – back 9-10 months. That would take the Dow down by another 2,000 points from here.
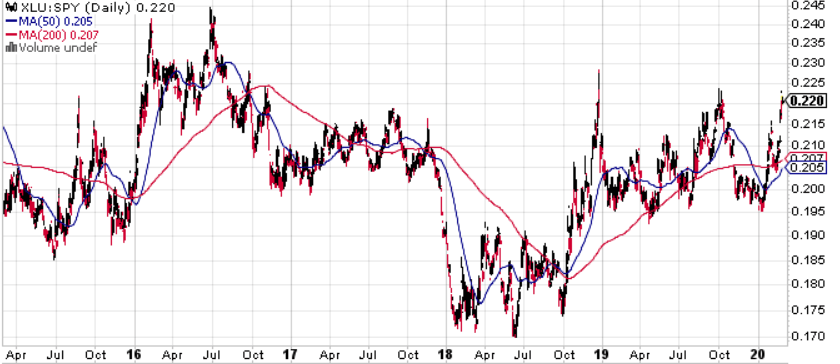
Here’s what is concerning to me, purely from a quantitative perspective. Anyone who has followed me for some time knows I often talk about utilities as a leading indicator to severe periods of market stress. I track utilities every week in the Lead-Lag Report because of how critical the sector is for risk-off sentiment. Because utilities are the most bond-like sector of the stock market, its movement tells you a lot about changing growth and inflation expectations. When looking at utilities relative to the S&P 500, its outperformance looks set to continue suggesting on a short-term basis this isn’t a low yet.
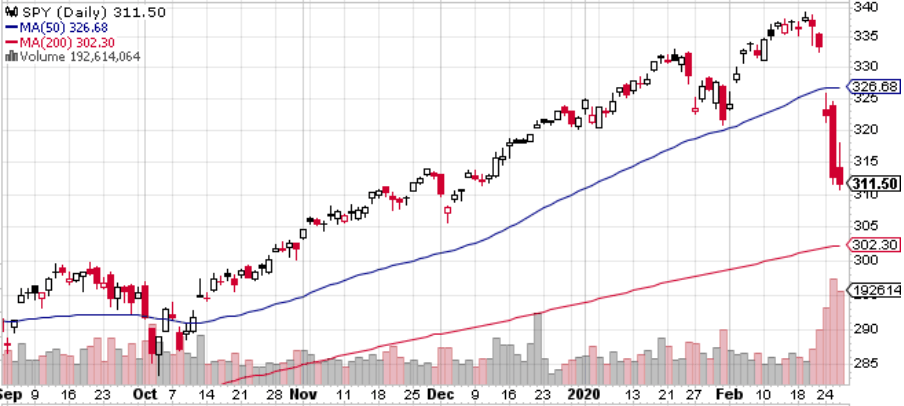
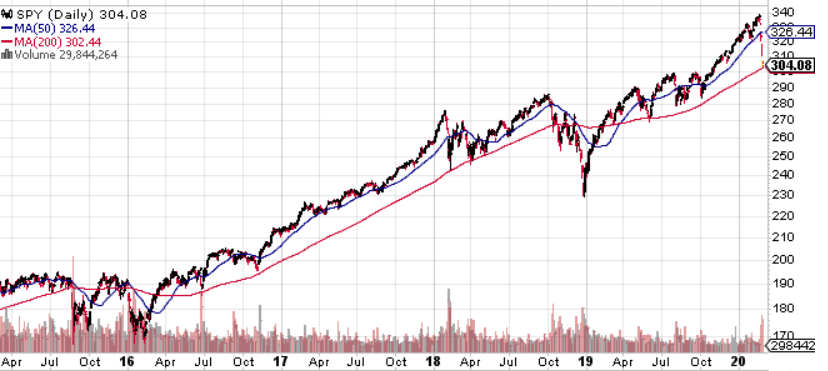
As of this writing, most major averages are now also below their 200-day moving averages. As I noted in the 2016 paper “Leverage for the Long Run,” moving averages don’t tell you about trend. Historically when stocks are below their 200-day moving averages it means volatility on average is likely to rise. Given that we are just now below the average, history suggests more volatility is to come (assuming it’s not a false positive).
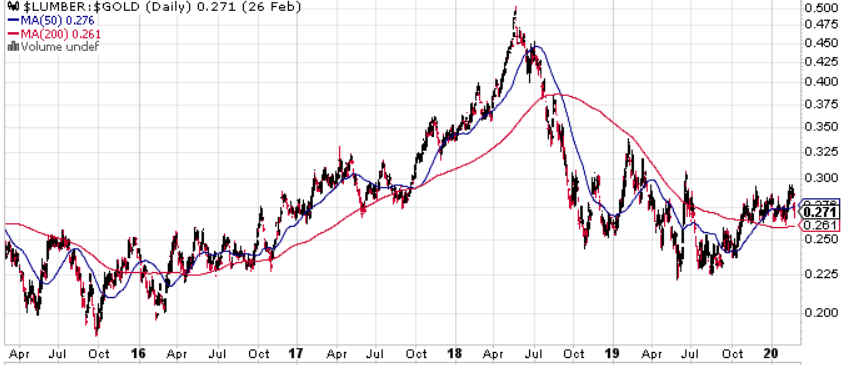
What would truly confirm that this may be a crash is a sudden breakdown in lumber. I’ve talked a lot about lumber on Real Vision in the past, given that lumber weakness has historically preceded big declines in the stock market, such as the 1987 Crash, LTCM, the tech wreck, Lehman, and the summer crash of 2011. When looking at lumber relative to gold, the ratio is only just now looking like it may turn south.
Bottom line here? Yes it looks like a correction, but a correction becomes a crash if it happens too quickly. The major concern here is that the other indicators I track and document in the Lead-Lag Report are only just now turning negative (utilities were first to warn). That makes me nervous that this may get uglier. What do you do about it? It may make sense to lighten up a bit and hedge more. These things can be more surprising than what pundits on air would have you believe. Coronavirus may have been the catalyst, but there are other black swans waiting to appear.
*Like this article? Don’t forget to hit the Follow button above!
 How To Avoid the Most Common Trading Mistakes
Sometimes, you might not realize your biggest portfolio risks until it’s too late.
That’s why it’s important to pay attention to the right market data, analysis, and insights on a daily basis. Being a passive investor puts you at unnecessary risk. When you stay informed on key signals and indicators, you’ll take control of your financial future.
My award-winning market research gives you everything you need to know each day, so you can be ready to act when it matters most.
Click here to gain access and try the Lead-Lag Report FREE for 14 days.
Disclosure: I/we have no positions in any stocks mentioned, and no plans to initiate any positions within the next 72 hours. I wrote this article myself, and it expresses my own opinions. I am not receiving compensation for it (other than from Seeking Alpha). I have no business relationship with any company whose stock is mentioned in this article.
Additional disclosure: This writing is for informational purposes only and Lead-Lag Publishing, LLC undertakes no obligation to update this article even if the opinions expressed change. It does not constitute an offer to sell, a solicitation to buy, or a recommendation regarding any securities transaction. It also does not offer to provide advisory or other services in any jurisdiction. The information contained in this writing should not be construed as financial or investment advice on any subject matter. Lead-Lag Publishing, LLC expressly disclaims all liability in respect to actions taken based on any or all of the information on this writing.
Be the first to comment