

ijeab/iStock via Getty Images
In a recent post, I explored a methodology to guesstimate the S&P 500’s 2-year annualized return 12 months into the future. A silver bullet? Hardly, but as short-term forecasting models go, you could do worse. But your editor gets poor marks for explaining the details. Several readers reached out and asked for clarification. Allow me to make amends.
The idea starts with taking the rolling 10-year annualized return for the S&P 500 Index and adjusting it by subtracting the one-year return, a.k.a. the 10-year/1-year return spread. History suggests this is a reasonable proxy for anticipating what the 2-year annualized return will be 12 months ahead.
Consider the relationship between the spread and the 12 months advanced 2-year return, per the chart below. The main takeaway: there’s a negative correlation between the two time series. It’s not perfect, but it persists enough of the time so that you should think through the reasons to ignore it in real time.
CapitalSpectator.com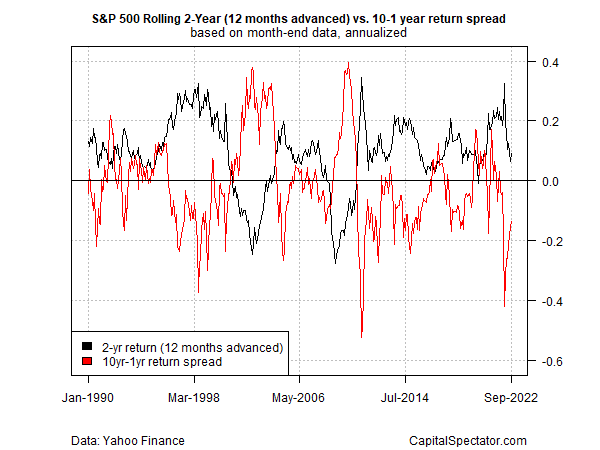
For a somewhat clearer summary of this relationship, let’s take the chart above and invert the 10-year/1-year spread. To the extent that the inverted spread tracks the 2-year return (12 months ahead), the modeling reflects a robust forecast.
CapitalSpectator.com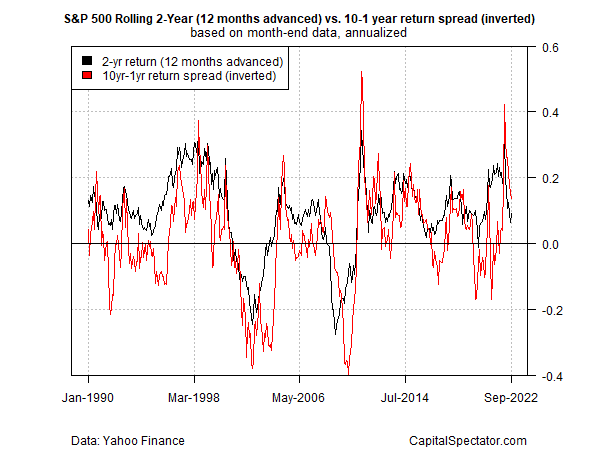
Alas, there’s a non-trivial amount of noise in the relationship, as illustrated in the linear-regression chart below. If the model was perfect, all the dots would fall along the blue regression line, but that’s obviously not the case. (Note: the red dot reflects the current 2-year return vs. the spread from 12 months previous.)
CapitalSpectator.com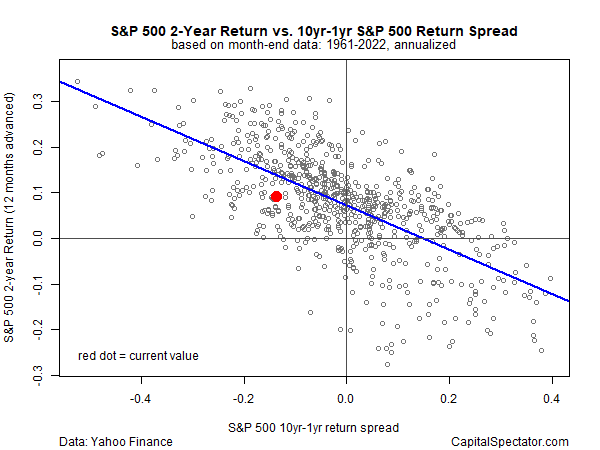
Editor’s Note: The summary bullets for this article were chosen by Seeking Alpha editors.
Be the first to comment