

Wolterk
Walmart (NYSE:WMT) reports its fiscal Q3 ’23 earnings before the opening bell on Tuesday morning, November 15th, 2022. (WMT’s ’23 fiscal year ends January ’23.)
Consensus is currently expecting $1.32 in EPS on $147.5 billion in revenue for expected year-over-year growth of -9% and +5% respectively.
If there is one metric that stands out that would tell readers what is happening within Walmart is this table showing the relationship between y.y sales and inventory growth:
WMT sales vs inventory growth (earnings reports)
Readers will have to click on the spreadsheet to expand it, but you can see how WMT has always tightly controlled the relationship between sales and inventory (for very good reason, given the $550 bl in revenue every year) and then the explosion in inventory in the ’22 calendar year as ordering got way out of whack with revenue.
The culprit is partially grocery since grocery makes up half of WMT’s annual revenue, according to Doug McMillon, WMT as of the last quarter ended late July ’22, WMT was still seeing “mid-teens” inflation rates in grocery.
Other problems this year include:
1) Overstaffing. (WMT is America’s largest private-sector employer so what they say on labor and wages matters).
2.) Increased fuel and supply chain costs.
3.) The aforementioned grocery inflation rate pressuring gross margin.
Trends in EPS and revenue estimates:
WMT revenue est trend (IBES data by Refinitiv) WMT EPS est trends (IBES data by Refinitiv)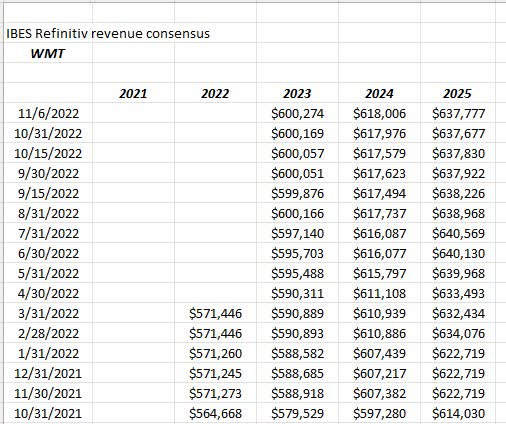
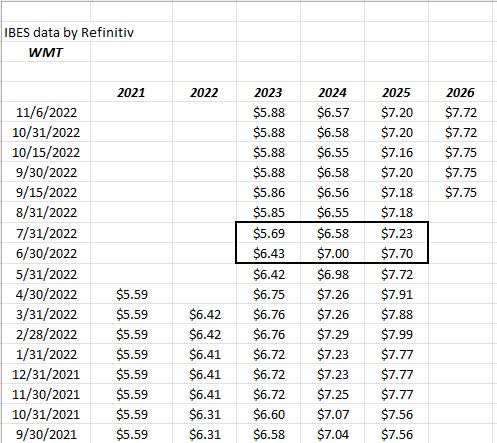
The black-bordered area within the WMT EPS estimate changes show the EPS warning from last quarter when WMT reduced EPS guidance but boosted revenue guidance for the rest of fiscal ’23.
It’s interesting that after Walmart reduced guidance and the 7/31/22 EPS estimate hit $5.69, almost immediately it began to increase to the current $5.86.
Walmart – the technicals:
WMT weekly chart (Worden Gold)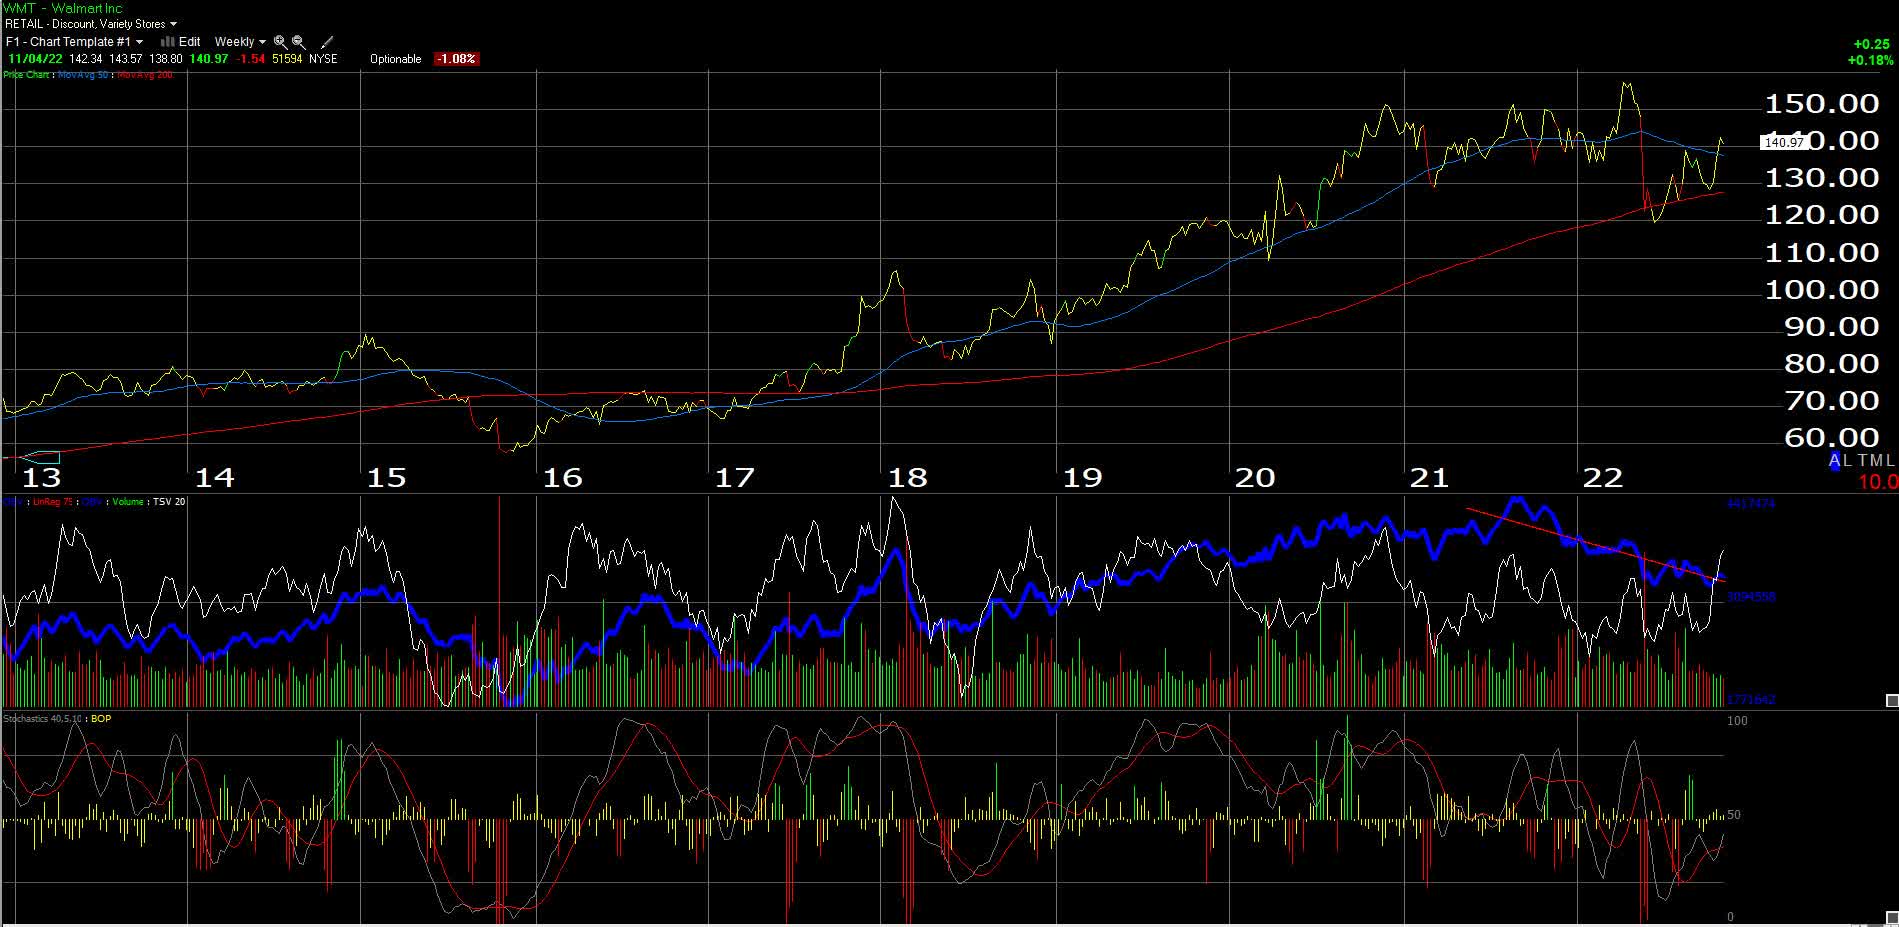
The weekly chart of WMT actually shows the stock bottoming around the 200-week moving average, but the stock will require more time – at least through the end of calendar 2022 – to work off the excess inventory.
Valuation:
With its current EPS estimate of $5.86 for fiscal ’23, WMT is trading at 24x that estimate, but just 18x cash-flow per share, which is understandable given the depreciation around the retail store base.
WMT has always traded at a discount to TTM revenue, today at 0.62x and its dividend yield is just 1.5%-1.6%, which is relatively uninteresting.
Once the influence of Covid-19 and its re-opening is over, the long-term growth assumptions around Walmart are for low-to-mid single digit revenue growth and mid-single digit EPS growth.
To give readers some hint at what calendars 2020 and 2021 meant for Walmart, EPS growth for WMT averaged 4% from 2010 to 2019, but then in 2020 and 2021, EPS growth shot up to 11% and 18% respectively, and will return to a more normal -9% in fiscal ’23 after the last two torrid years.
Revenue growth behaved similarly averaging just 2% from 2010 to 2019, but then jumping to 7% and 3% in calendar 2020, and calendar 2021.
Summary/Conclusion:
WMT will eventually return to the low and mid-single-digit growth that was in evidence in the last decade from 2010 to 2019. However, the current environment, like so many other companies have Walmart twisted and convoluted in terms of its ability to merchandise and sell inventory, which is resulting in margin issues for a company that is used to running like a Swiss watch.
Walmart is fairly valued around $140 per share. Clients saw a small position added when the stock was trading around $120. For readers interested in trading the stock, I’d use the 200-week moving average of $127.80 as a stop-loss.
Both Walmart and Target (TGT) will eventually work out these inventory issues, but the distortions still speak volumes of what Covid-19 did to the US economy both in closing and then re-opening and then what’s still going on with the China supply chains and their own policies around Covid.
2023 should see some relief, but I think that was said in late 2021, too, about 2022.
Finally, food inflation for the most recent October CPI was still up 10% per the following graph from Liz Ann Sonders of Charles Schwab.
October CPI (Schwab Research)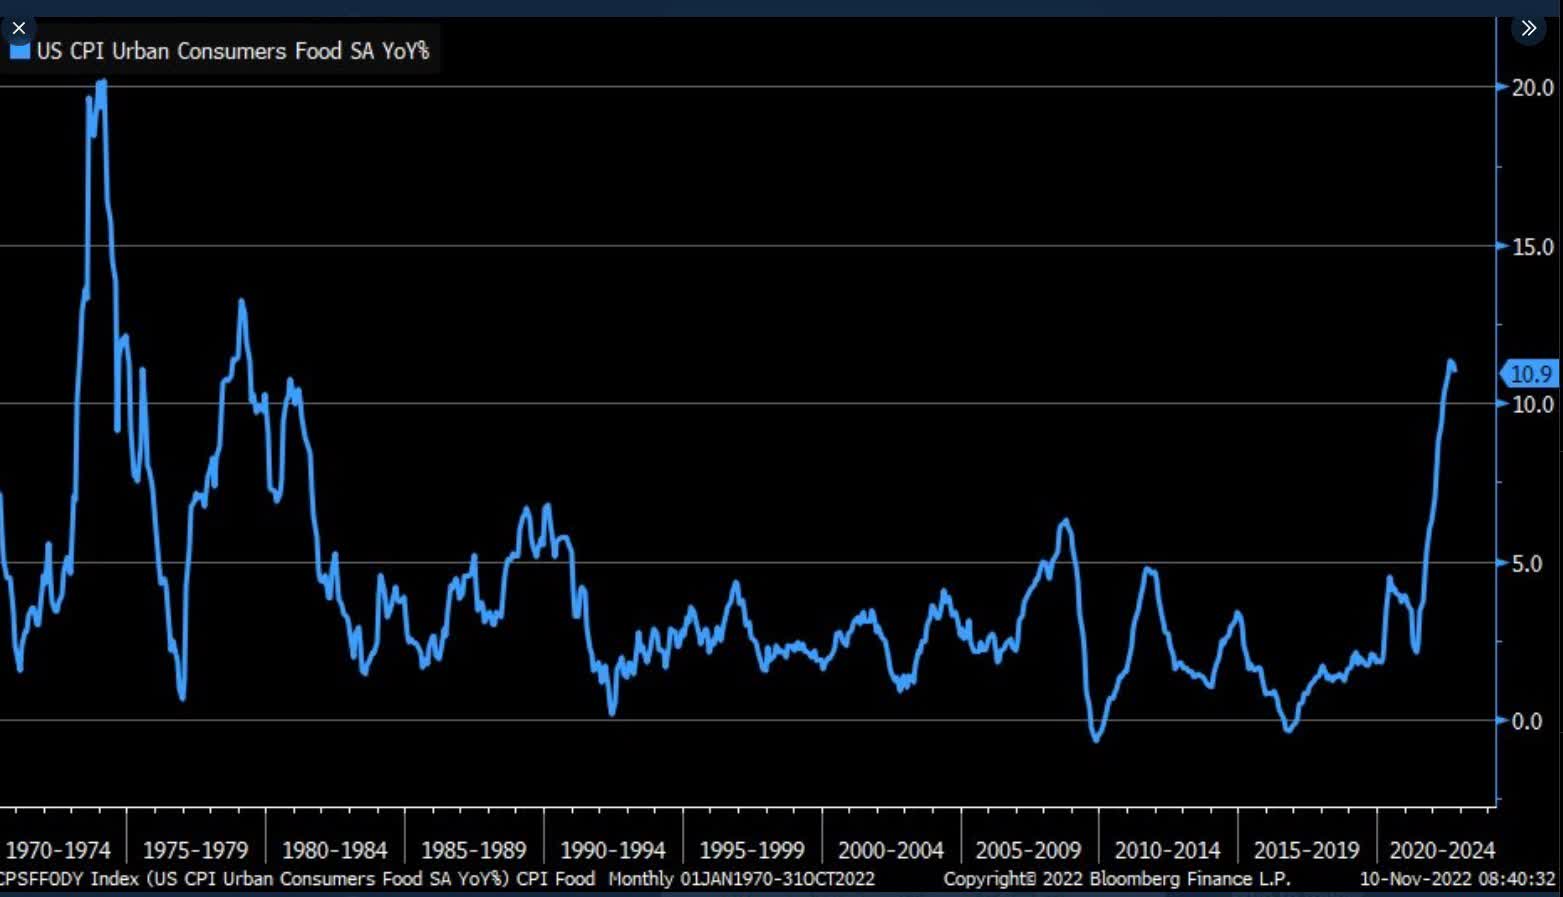
This could represent an ongoing challenge for Walmart, but given Walmart’s size and the fact that it is the largest grocery chain in America, it also gives the retail giant leverage too. The key is margins and that’s what will be watched on Tuesday morning, November 15, 2022.
Be the first to comment