

akova/iStock via Getty Images
Thesis
The Peter Lynch approach is not particularly well-known among dividend investors, primarily because the man is so famous for picking 10 baggers and is typically regarded as a growth, not an income, investor. However, a large part of his method for picking growth stocks applies equally well (or even especially well) to picking dividend stocks too. Lynch is a “story” investor at the core, and he always prefers simpler stories to complex ones. He said in his book (One Up on Wall Street) that he prefers investing in “pantyhose” to “communications satellites,” and “motel chains” to “fiber optics.” He loves companies with boring names and boring products in boring areas (like funeral services, retail chains, motel chains, et al). You can see why Walgreens Boots Alliance, Inc. (NASDAQ:WBA) and CVS Health Corporation (NYSE:CVS) could fit into his above criteria almost perfectly.
Despite Lynch’s fame as a growth investor, throughout his career and writings, he’s provided enough wisdom into the choice of dividend stocks, too. Some of his insights are familiar and yet some are quite unique even to veteran DGIs (dividend growth investors). And in this article, I’ve gathered a total of 5 of his screening criteria as listed below (most from his book mentioned above). And I will examine WBA and CVS against each of them one-by-one. And in the end, you can see that the final result is that WBA scored 4 points in total, slightly ahead of CVS’ 3 points. For those who cannot wait, the final scorecard is at the end of the article.
These criteria are:
- Dividend record. Of course, since we are talking about dividend stocks, long records of regularly raising dividends are always a plus. Lynch prefers to see a 20 to 30 years record or regularly raising dividends.
- Valuation. Most people are familiar with his P/E relative to the earnings growth rate (the PEG ratio). He prefers a PEG around 1x or below. For dividend stocks, he also has a modified PEG ratio, the PEGY ratio (price-earnings ratio divided by the sum of the earnings growth rate and dividend yield). The idea behind the PEGY is very simple and effective (most effective ideas are simple). If a stock pays out a large part of its earnings as dividends, then investors do not need a high growth rate to enjoy healthy returns. And vice versa. Lynch prefers PEGY ratios to be below 1x (because of the addition of the dividend yield).
- Payout ratio. We are all familiar with this one: the lower the payout ratio, the better.
- Share buybacks. Most dividend investors do not pay enough attention to share repurchases, which are every bit as important and as real for total returns as cash dividends. And Lynch recognized this and prefers to see companies who buy back their shares. Buyback is a clear indicator of financial strength (the company has extra cash flow that exceeds CAPEX) and management confidence in their existing business (so they chose to buy back than expand into new segments).
- And finally, inventories. This is also a point most dividend investors do not pay enough attention to. A build-up of inventories is always a red flag. That is, if the inventories are growing much faster than sales, it is a particularly concerning sign.
1. Dividend record
Let’s start with 1st criterion: the simple dividend record. As aforementioned, Lynch prefers to see a 20 to 30 years record or regularly raising dividends. And WBA is the clear winner here with no surprise. It is a dividend champ and has been increasing its dividend consecutively for 30 years as you can see from the chart below. While CVS has stopped its dividend increase since 2017 when it acquired Aetna. And it has just resumed its dividend growth since 2021. Hence, WBA is one point ahead.
Source: Seeking Alpha data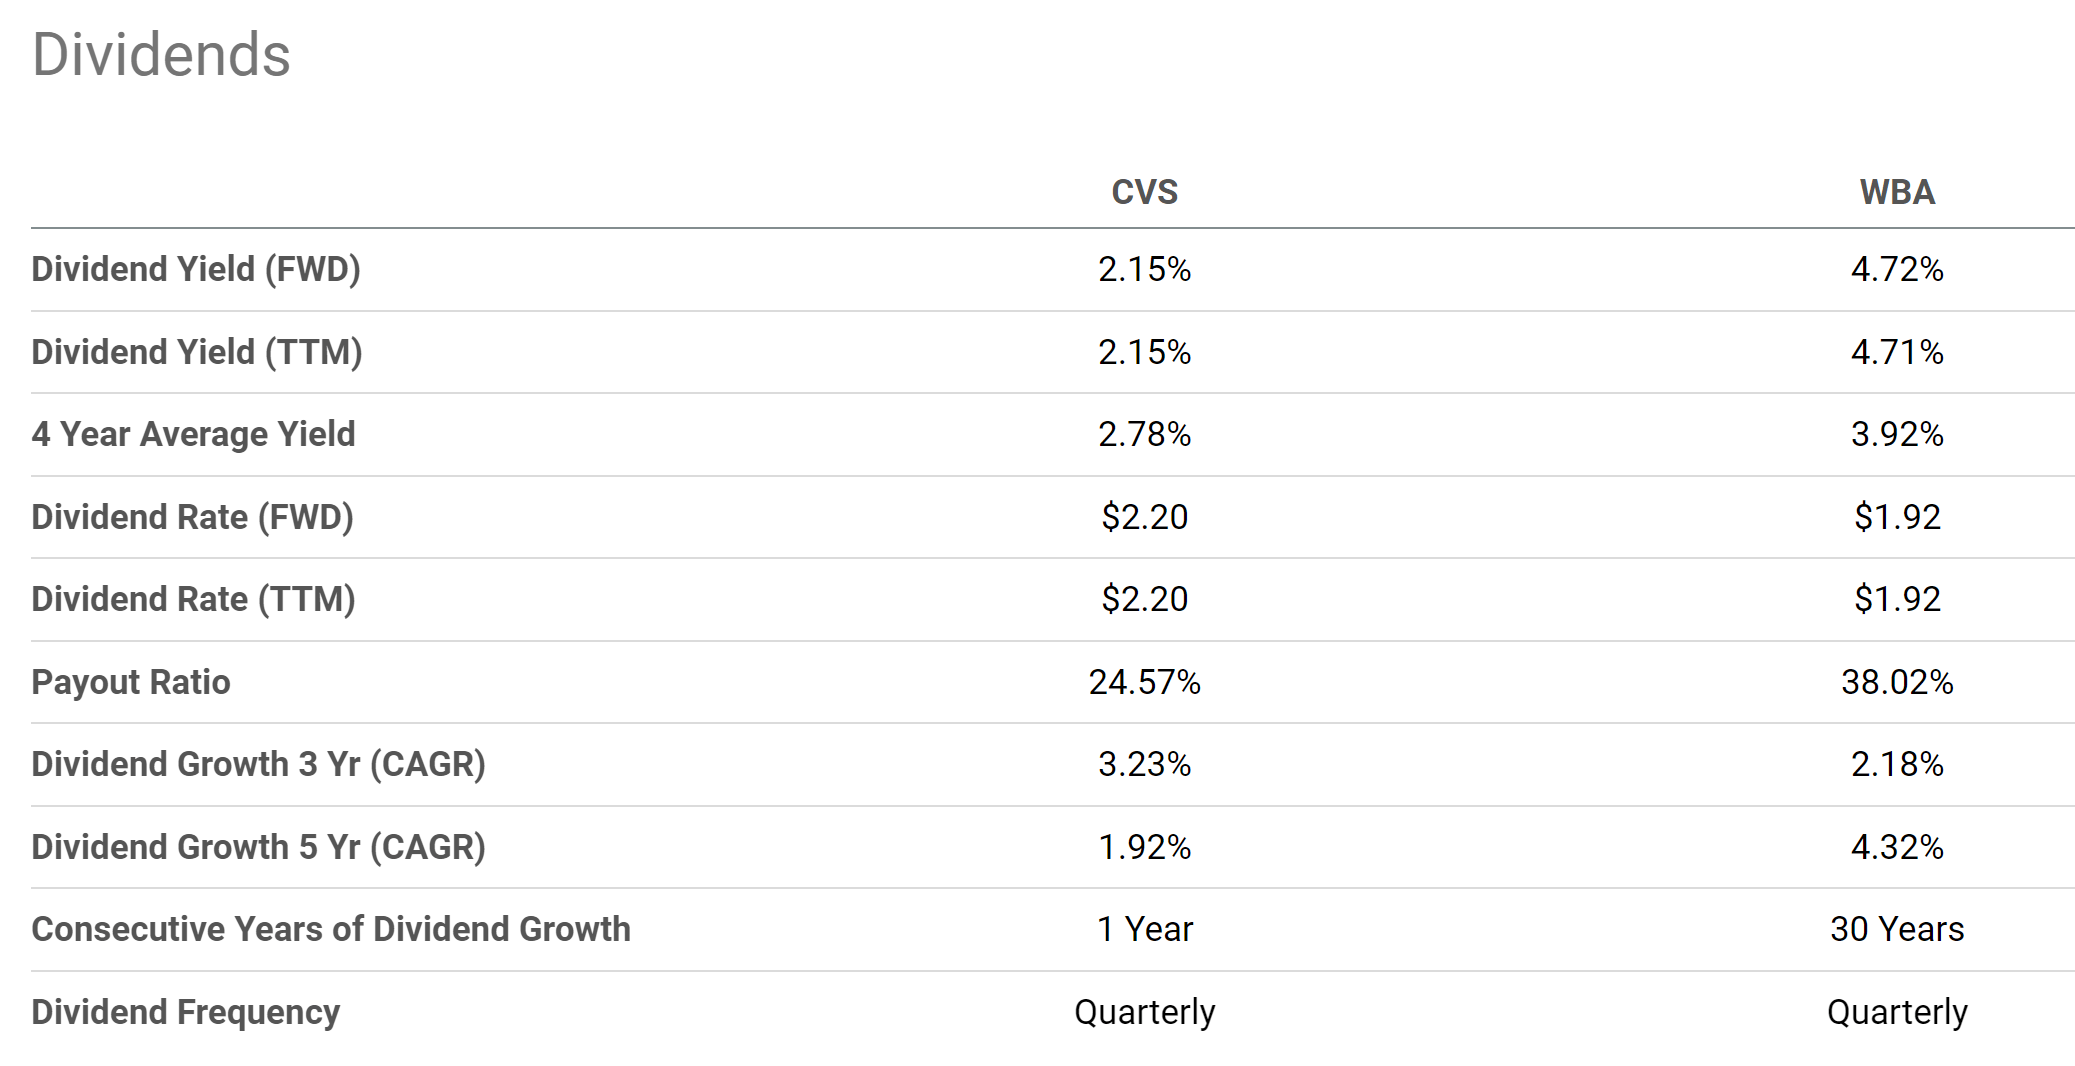
2. Valuation
Due to CVS’ dividend freeze since 2017, its dividend growth rate is also slower than WBA either on a 3-year or 5-year basis as seen in the chart above. To wit, CVS’ dividend growth on a 5-yr CAGR basis is 1.92%, and WBA’s is 4.32%. And next, I will use these growth rates as a representation of their earnings growth rates. For companies that consistently pay dividends like WBA and CVS, the dividends provide an excellent way to hack into their owners’ earnings.
As seen, the FY1 P/E ratio for WBA is 9.04x and is 11.87x CVS as of this writing (taken from Seeking Alpha). As a result, the PEG ratio for WPA is 2.08x. And for CVS, it is 4.69x. Both are far above the 1x PEG that Peter Lynch prefers to see.
This is where the modified PEG ratio come in. Both WBA and CVS are paying a quite generous dividend yield of 4.72% and 2.75% at this point, respectively. Once we divide the FY1 price-earnings ratio by the SUM of the growth rate and dividend yield, their PEGY ratios turn out to be 1.0x for WBA and 2.54x for CVS. Again, not below the 1x that Lynch prefers to see, but in WBA’s case, its 1x PEGY ratio is not only substantially lower than CVS but also reasonable enough.,
Thus, WBA scores another point ahead of CVS here too.
Source: Author based on Seeking Alpha data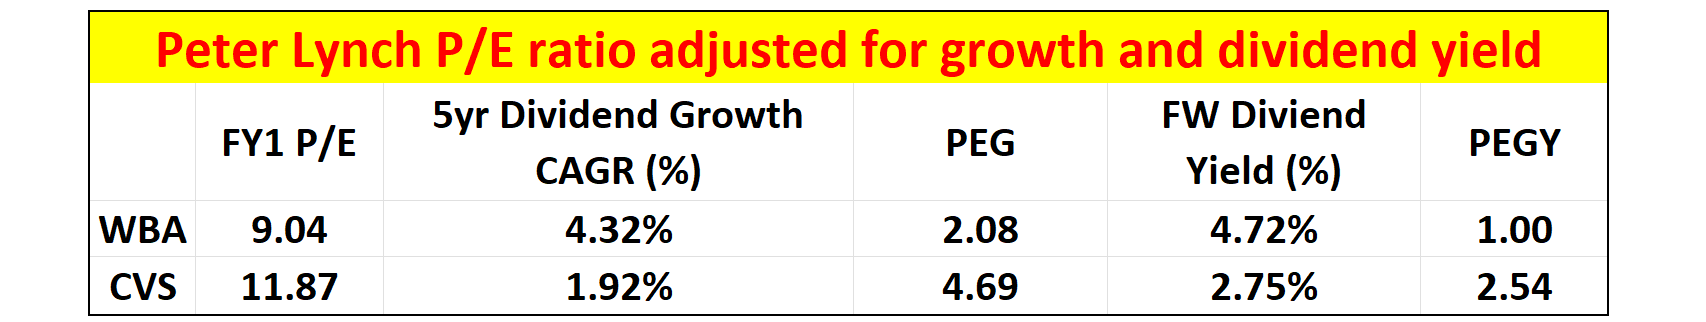
3. Dividend payout ratios
The payout ratios in terms of earnings are so choppy for both stocks (as you can see from the bottom panel of the chart below) because accounting EPS sometimes do not represent their economic earnings. Therefore, here I will rely primarily on their cash payout ratios as shown in the top panel of the chart. As seen, WBA has been historically paying out a higher percentage (35.7% on average) of its cash as dividends than CVS (24.9% on average). And also at this current moment, WBA’s cash payout ratio is also far higher than CVS’ (76% versus 14.6%).
Thus, as a result, the picture is quite one-sided, and CVS scores one point on this one for sure.
Source: Author Seeking Alpha data
4. Share buying backs
Both stocks have been consistently buying back their own shares over the years as you can see from the following chart. Again, CVS’ buybacks were interrupted for a few years because of the Aetna acquisition. But on average, CVS’ buyback yield is quite close to that of WBA on average in the long term. To wit, CVS’ buyback yield is 2.92% on average in the past 10 years and it currently sits at 1.49%. And WBA’s buyback yield is 3.46% on average in the past 10 years and it currently is 0.53%.
Given the mixed comparison between the long-term average and current buyback, I call it a tie on this criterion given that both companies have been consistently repurchasing their own shares in the long term.
Source: Seeking Alpha data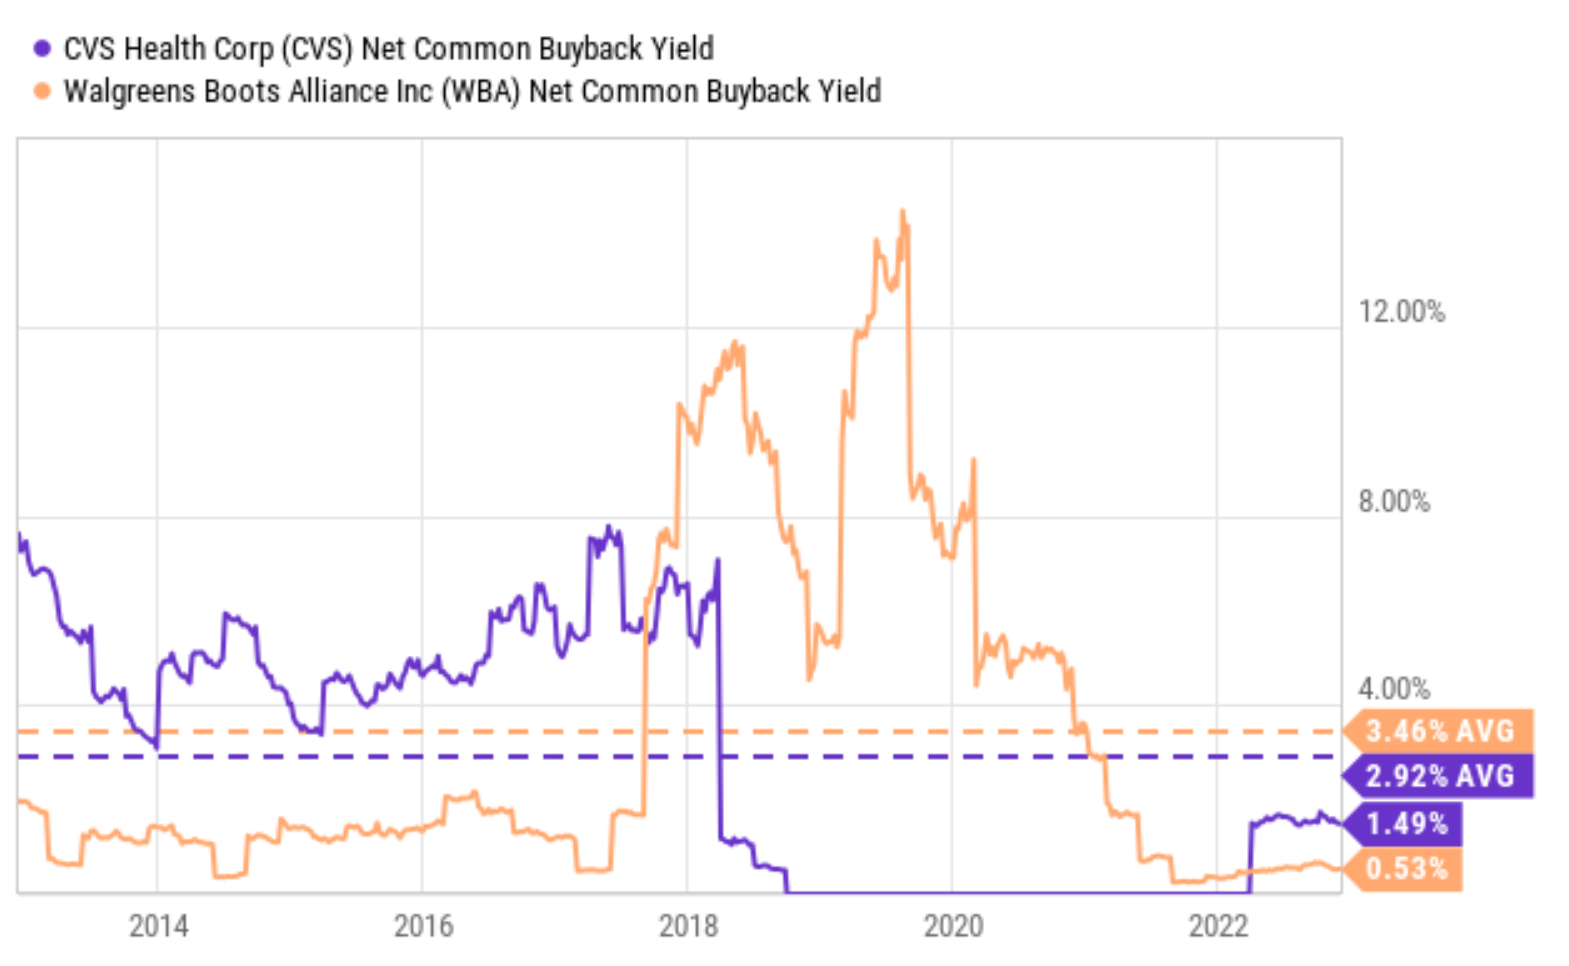
5. Inventory management
The next chart shows their days of inventory outstanding on an annual basis. As seen, both have been improving (i.e., reducing their outstanding inventory) over the years, a sign of more efficient management and operation. To wit, CVS has managed to reduce its inventory from almost 40 days 10 years ago to the current level of 27.56 days. And WBA’s improvement is even more dramatic: from over 48 days in 2014 to the current level of 28.85 days.
I am also calling it a tie on this criterion, too, given that both companies have been showing the same consistent trend and also their current levels are essentially on par with each other.
Source: Seeking Alpha data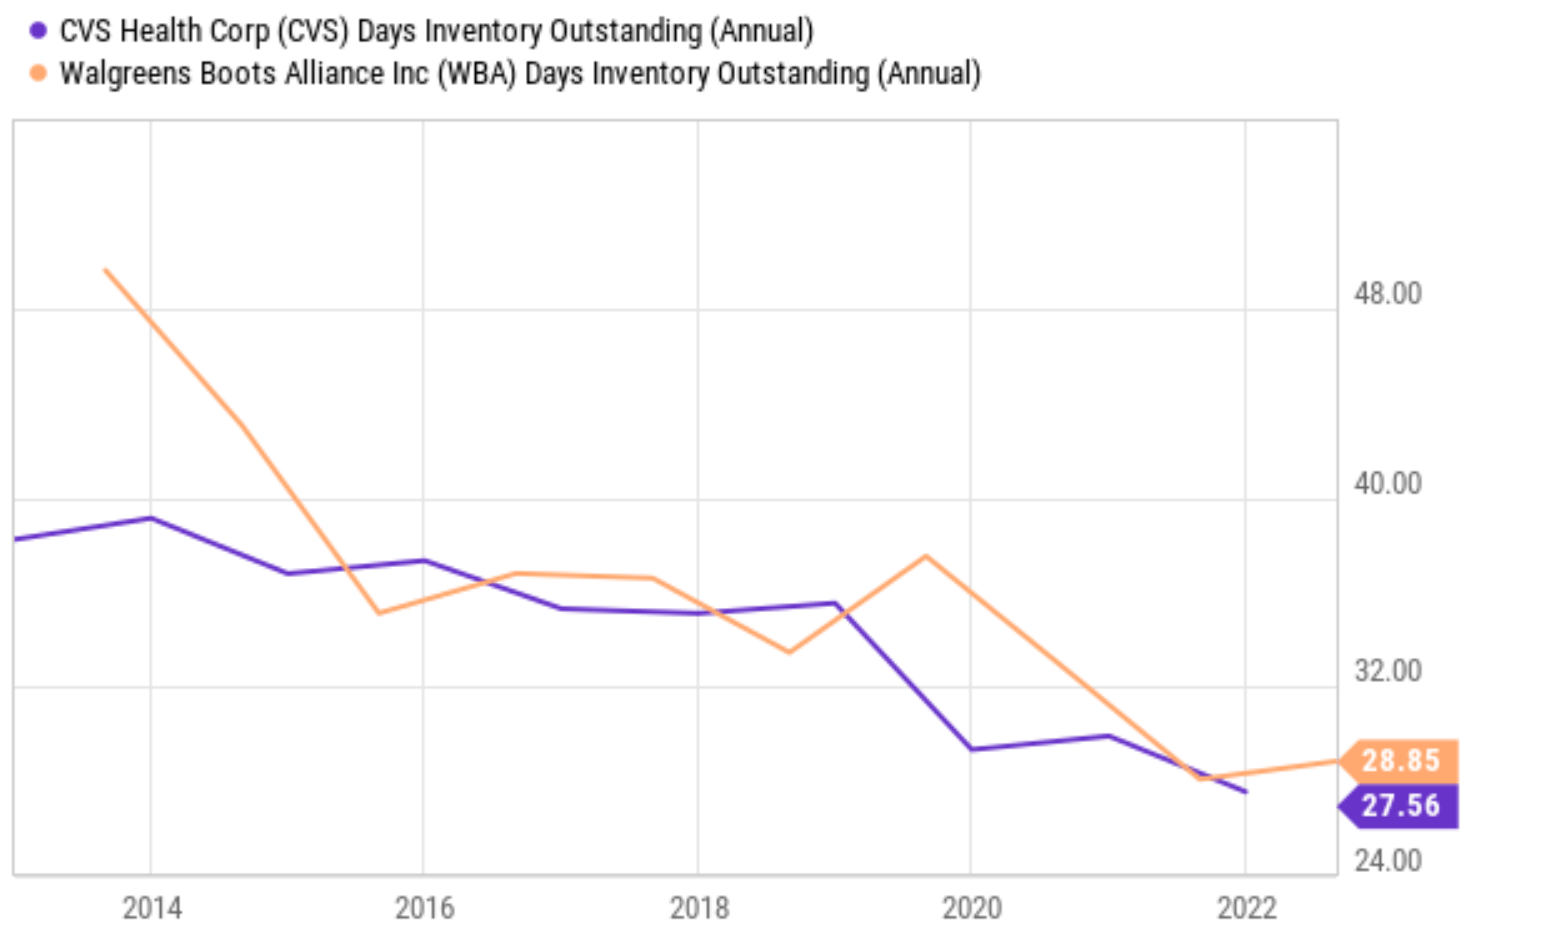
Risks and final verdict
Before issuing the final verdict, let me remind investors that both stocks involve risks. They both face macroscopic uncertainties as well as company-specific risks. Macroscopic uncertainties include the pandemic, high inflation, and also reimbursement headwinds. In particular, the recent passing of the Inflation Reduction Act (“IRA”) can generate long-term impacts on both stocks yet to be seen. Specific to WBA, it has a much larger global exposure than CVS and hence is more sensitive to the fluctuation of currency exchange rates. For CVS, I am expecting a flat or very small increase in EPS for the full year of 2022 due to a slowdown in sales contributions from COVID-19 vaccines, store closures, and also increased competition.
All told, I see both WBA and CVS as excellent dividend stocks that can fit into the Lynch approach. They both fit the general Lynch creation (both being easily understandable businesses with boring names and boring services in a boring area) and also his criteria more targeted for dividend stocks. After checking them against 5 of his screening criteria for dividend stocks, you can see that WBA scored 4 points in total, slightly ahead of CVS’ 3 points.
Source: Author based on Seeking Alpha data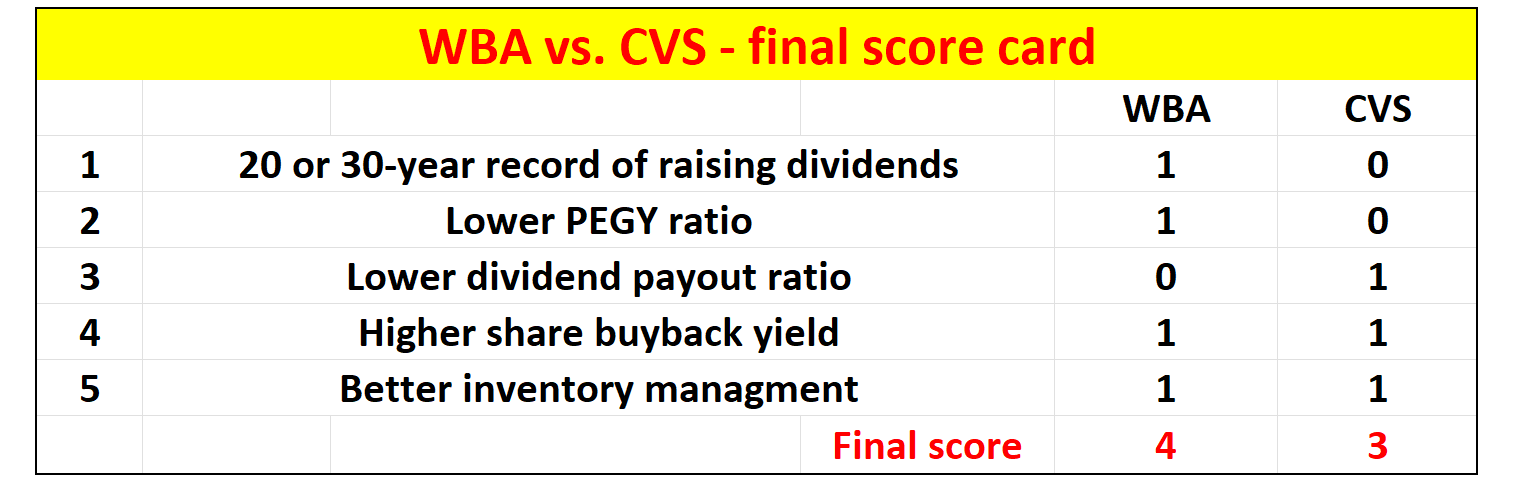
Be the first to comment