

Galeanu Mihai
The Vanguard Total World Stock ETF (NYSEARCA:VT) provides a low-cost way to invest in leading global companies. Although it delivers respectable standalone returns, structurally, the U.S. market continues to outperform the rest of the world at the moment. Without catalysts, I would recommend investors stick with Vanguard S&P 500 ETF (VOO) as their core equity exposure.
Fund Overview
The Vanguard Total World Stock ETF gives investors a low-cost method to invest in both U.S. and foreign stocks. It has $28 billion in assets, making it one of the larger “global” exchange-traded funds (“ETFs”).
Strategy
The VT ETF seeks to achieve its investment objective by tracking the performance of the FTSE Global All Cap Index, an index that includes both developed and emerging markets.
The FTSE Global All Cap Index is a float-adjusted, market-cap weighted index designed to track the performance of companies located around the world. It covers 49 international markets and has close to 10,000 constituents.
Portfolio Holdings
The VT ETF has almost 9,500 individual positions, roughly the same as the benchmark index. Figure 1 shows the portfolio composition. Although the fund is advertised as all-cap, it skews towards large-cap as shown by the Style rating. This is because the fund is market-cap weighted, so large-cap companies will dominate. The median market cap of the fund’s holdings is $60 billion.
Figure 1 – VT ETF Portfolio Characteristics (vanguard.com)
Figure 2 shows the VT ETF’s regional exposure. Approximately 64% of the fund is invested in North America, with 61% of that being the U.S. markets, as it is the largest capital market in the world. Europe accounts for 15% of the exposure. Asia is 11% of exposure and emerging markets as a whole account for 10.4%.
Figure 2 – VT ETF Regional Exposure (vanguard.com)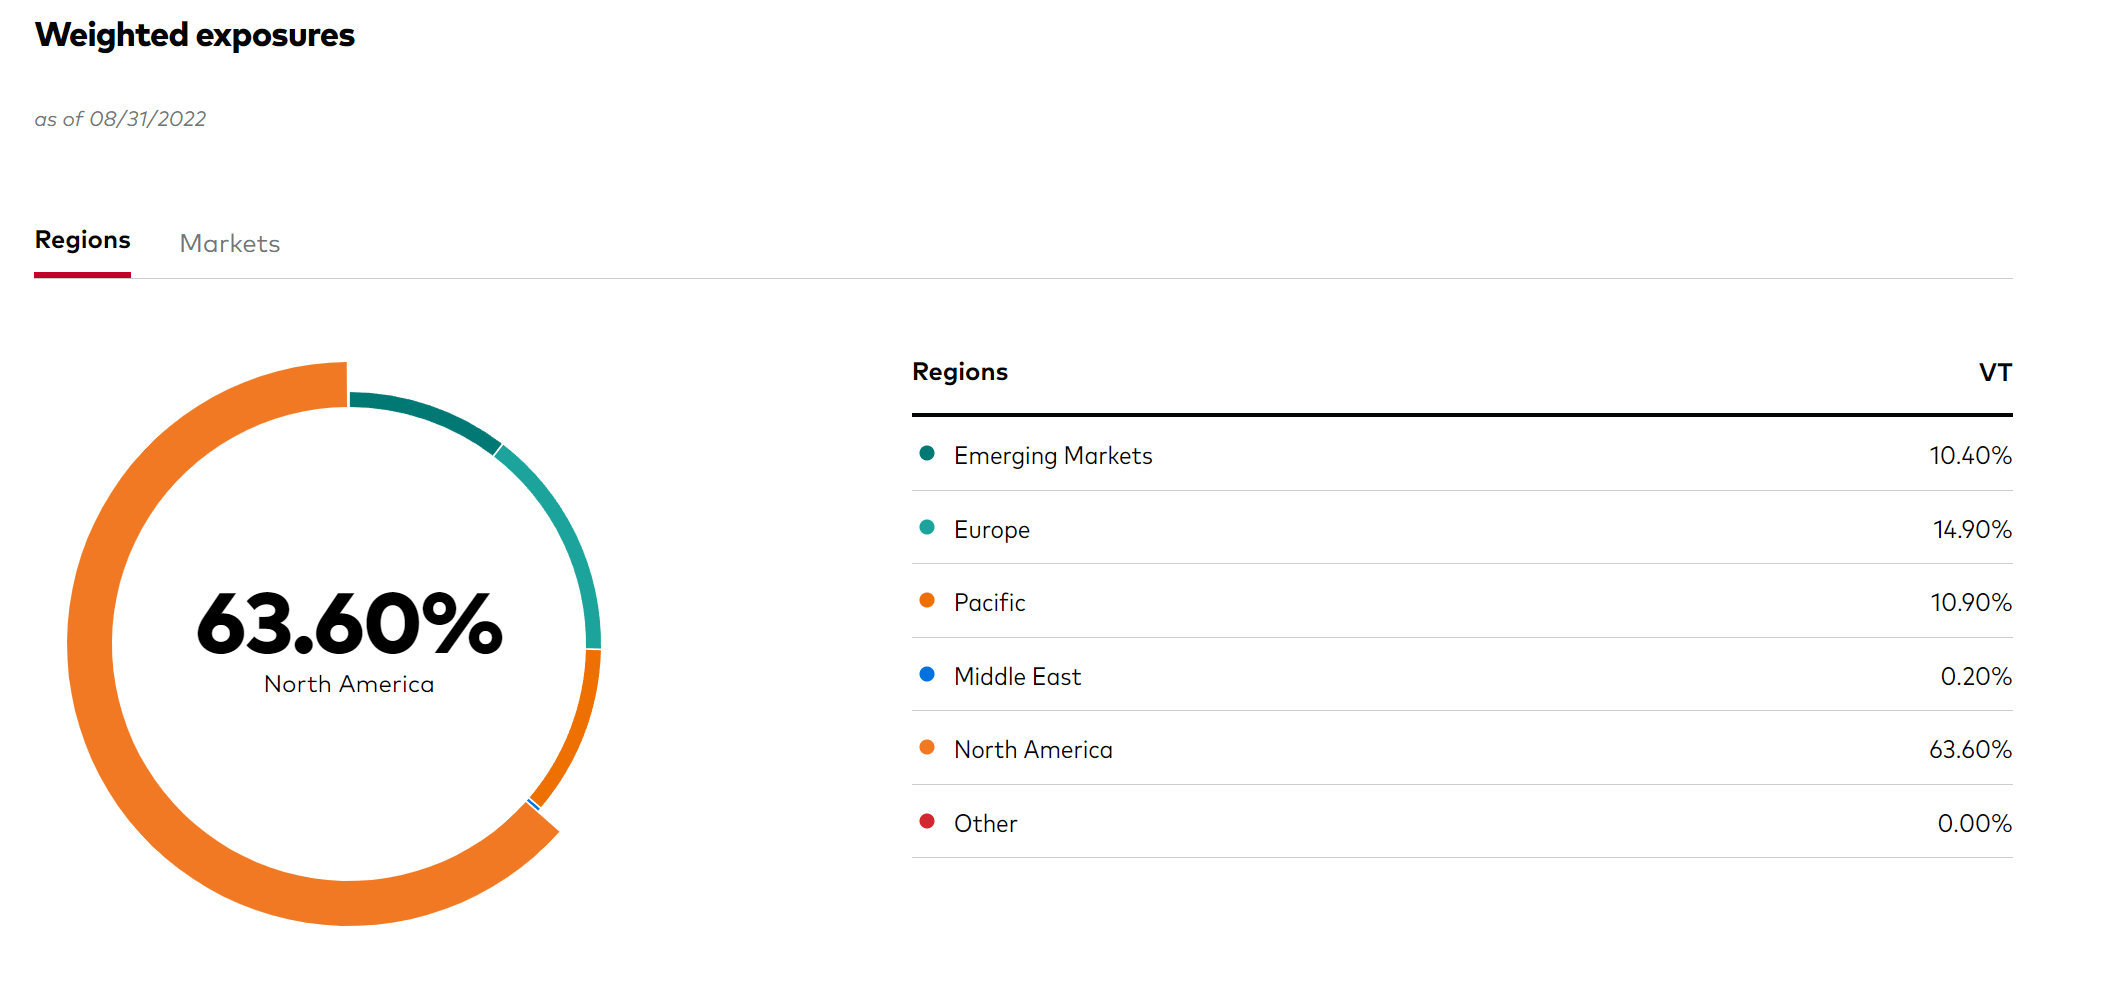
Looking at individual security weightings, we can see that the fund basically tracks the largest market cap companies in the world, with Apple Inc. (AAPL) having the largest weighting at 3.7% followed by Microsoft Corp. (MSFT) at 3.0% (Figure 3).
Figure 3 – VT Top 10 positions (vanguard.com)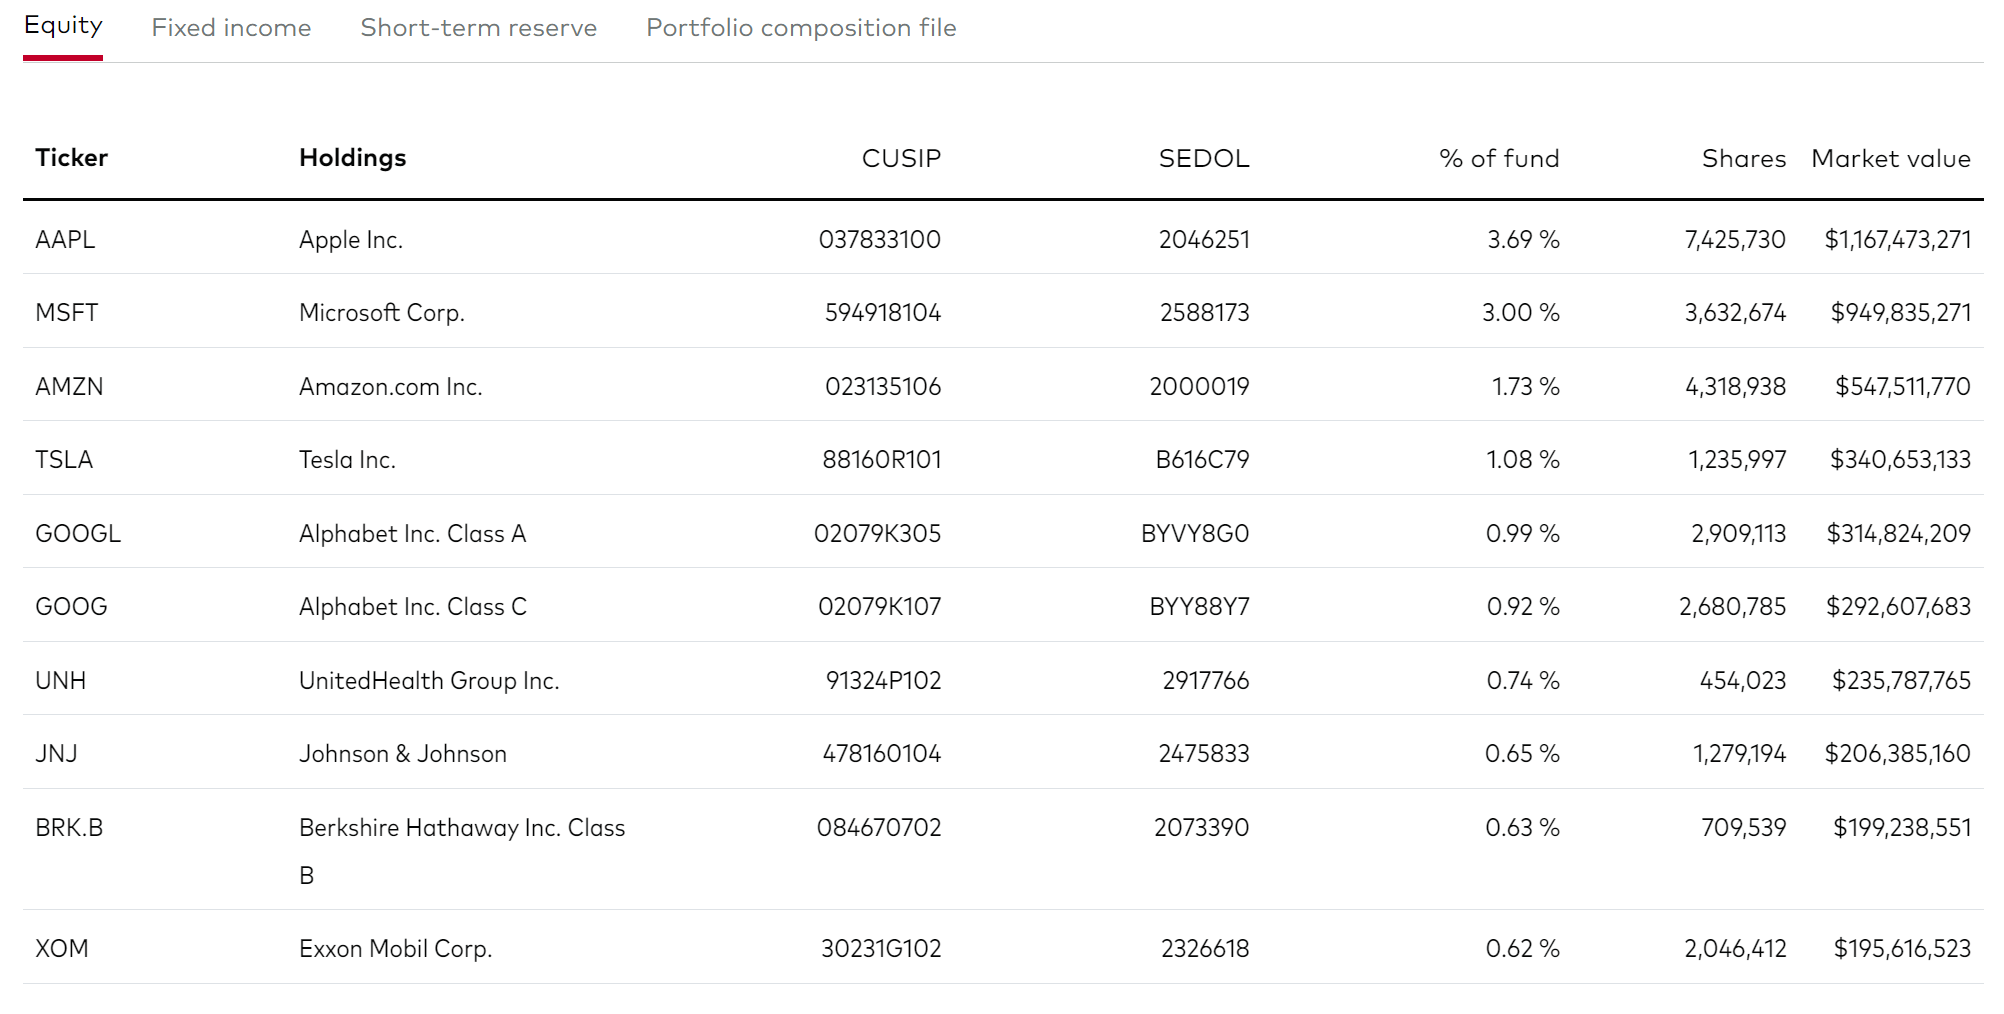
However, there are notable companies missing, or not reflected as per their market cap. For example, Saudi Aramco, with a market cap of $2 trillion, should rank in between Apple and Microsoft Corp. However, due to its low float, Saudi Aramco does not register in the top 100 holdings. Similarly, Chinese companies as a group have lower weightings than their market caps would suggest.
Returns
The VT ETF has delivered respectable long-term returns, as shown in Figure 4. It has 3/5/10 Yr average annual returns of 3.9%/4.5%/7.6% respectively, as of September 30, 2022. 2022 has been a difficult year, with the fund experiencing a 25.5% drawdown YTD.
Figure 4 – VT ETF Returns (vanguard.com)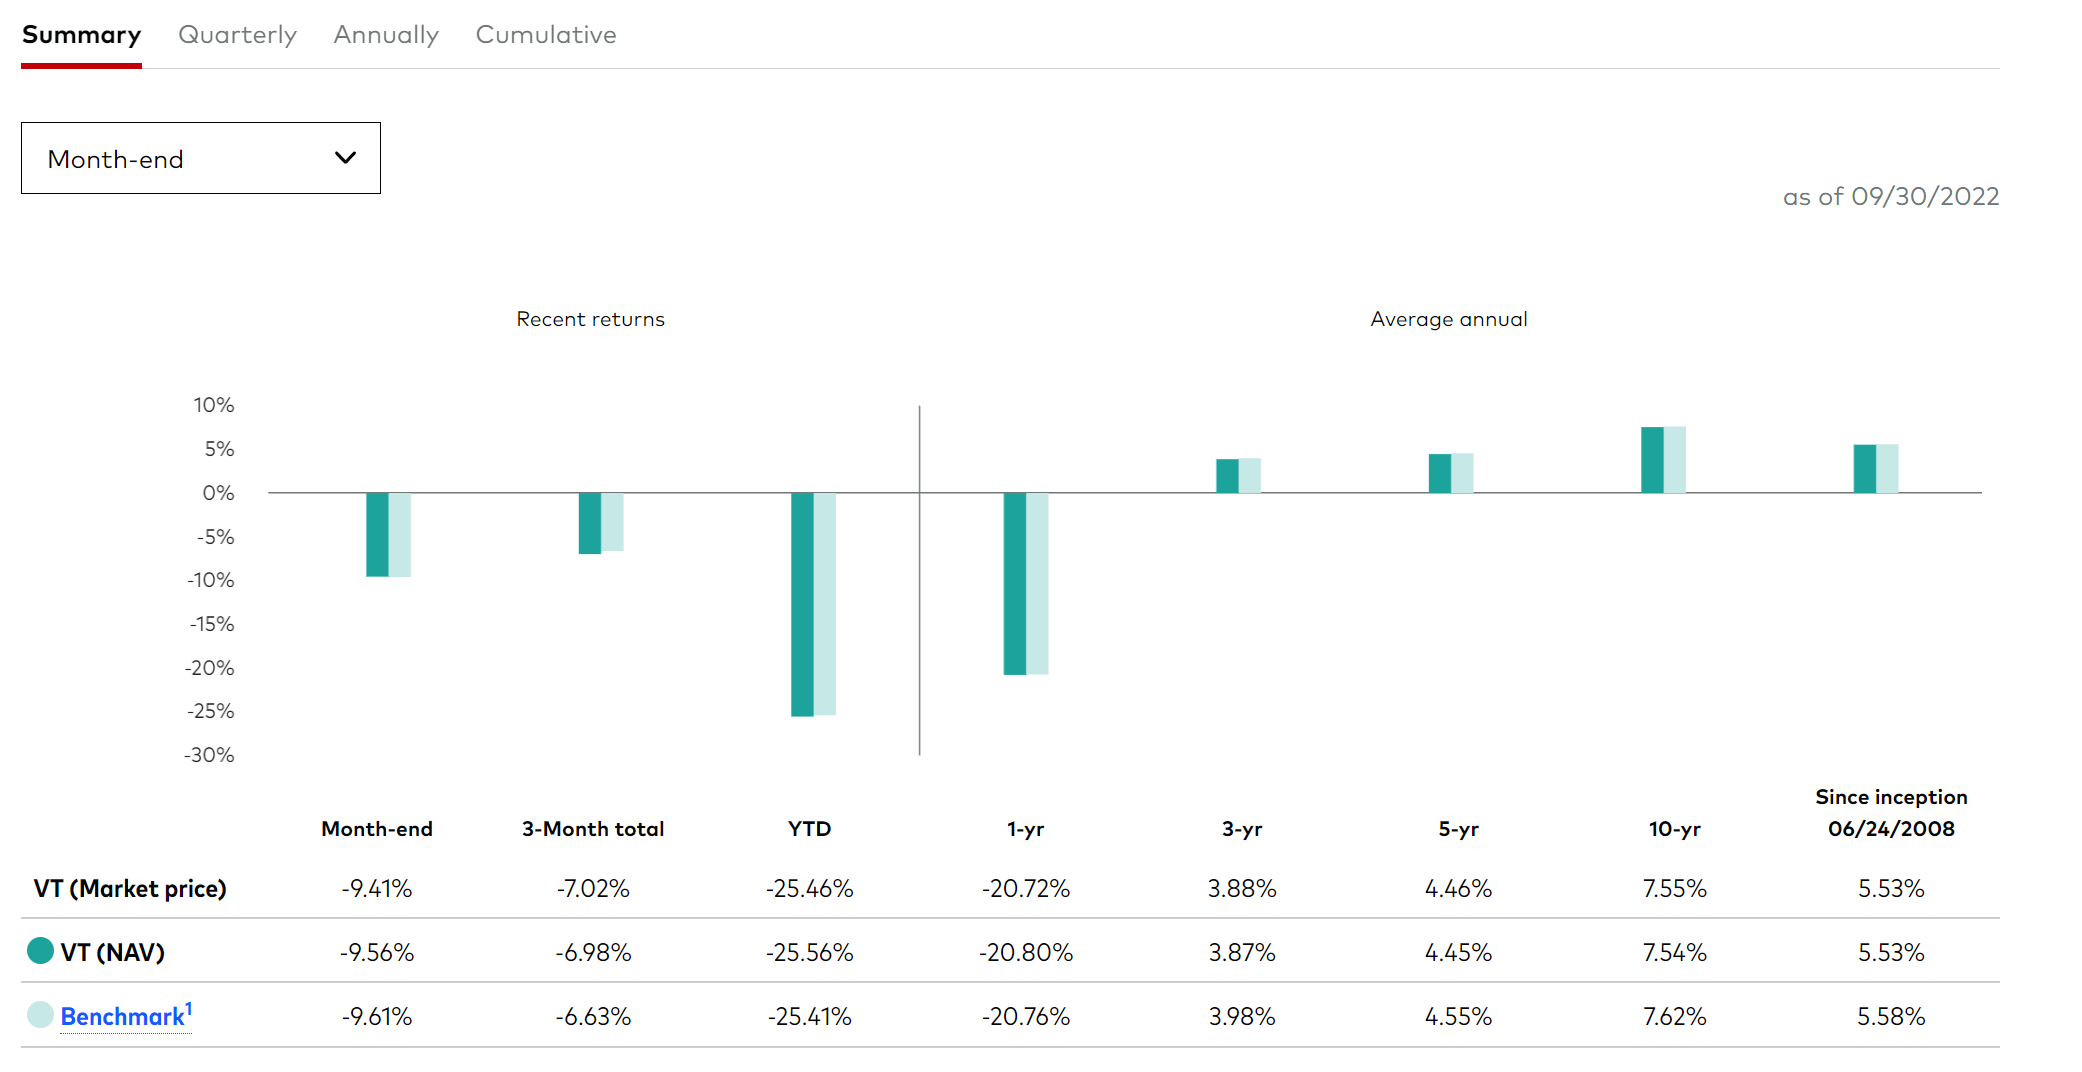
Distribution & Yield
The VT ETF pays a moderate trailing 12-month distribution of $2.04/share, or 2.5%. The distribution is paid quarterly and is variable. The most recent distribution of $0.4026 was paid on September 22, 2022.
Fees
Consistent with the Vanguard ethos, the VT ETF charges a low expense ratio of 0.07%.
The World Vs. The U.S.
While the VT ETF has generated respectable returns, it has lagged U.S.-focused funds like the Vanguard S&P 500 ETF. The VOO ETF has delivered 3/5/10 Yr Average annual returns of 8.2%/9.2%/11.7% on a 3/5/10 Yr basis, significantly outperforming the VT ETF. Visually, we can see the relative ratio between VOO and VT has been in a strong uptrend that continues to make new highs.
Figure 5 – VOO vs. VT (Author created with price chart from StockCharts.com)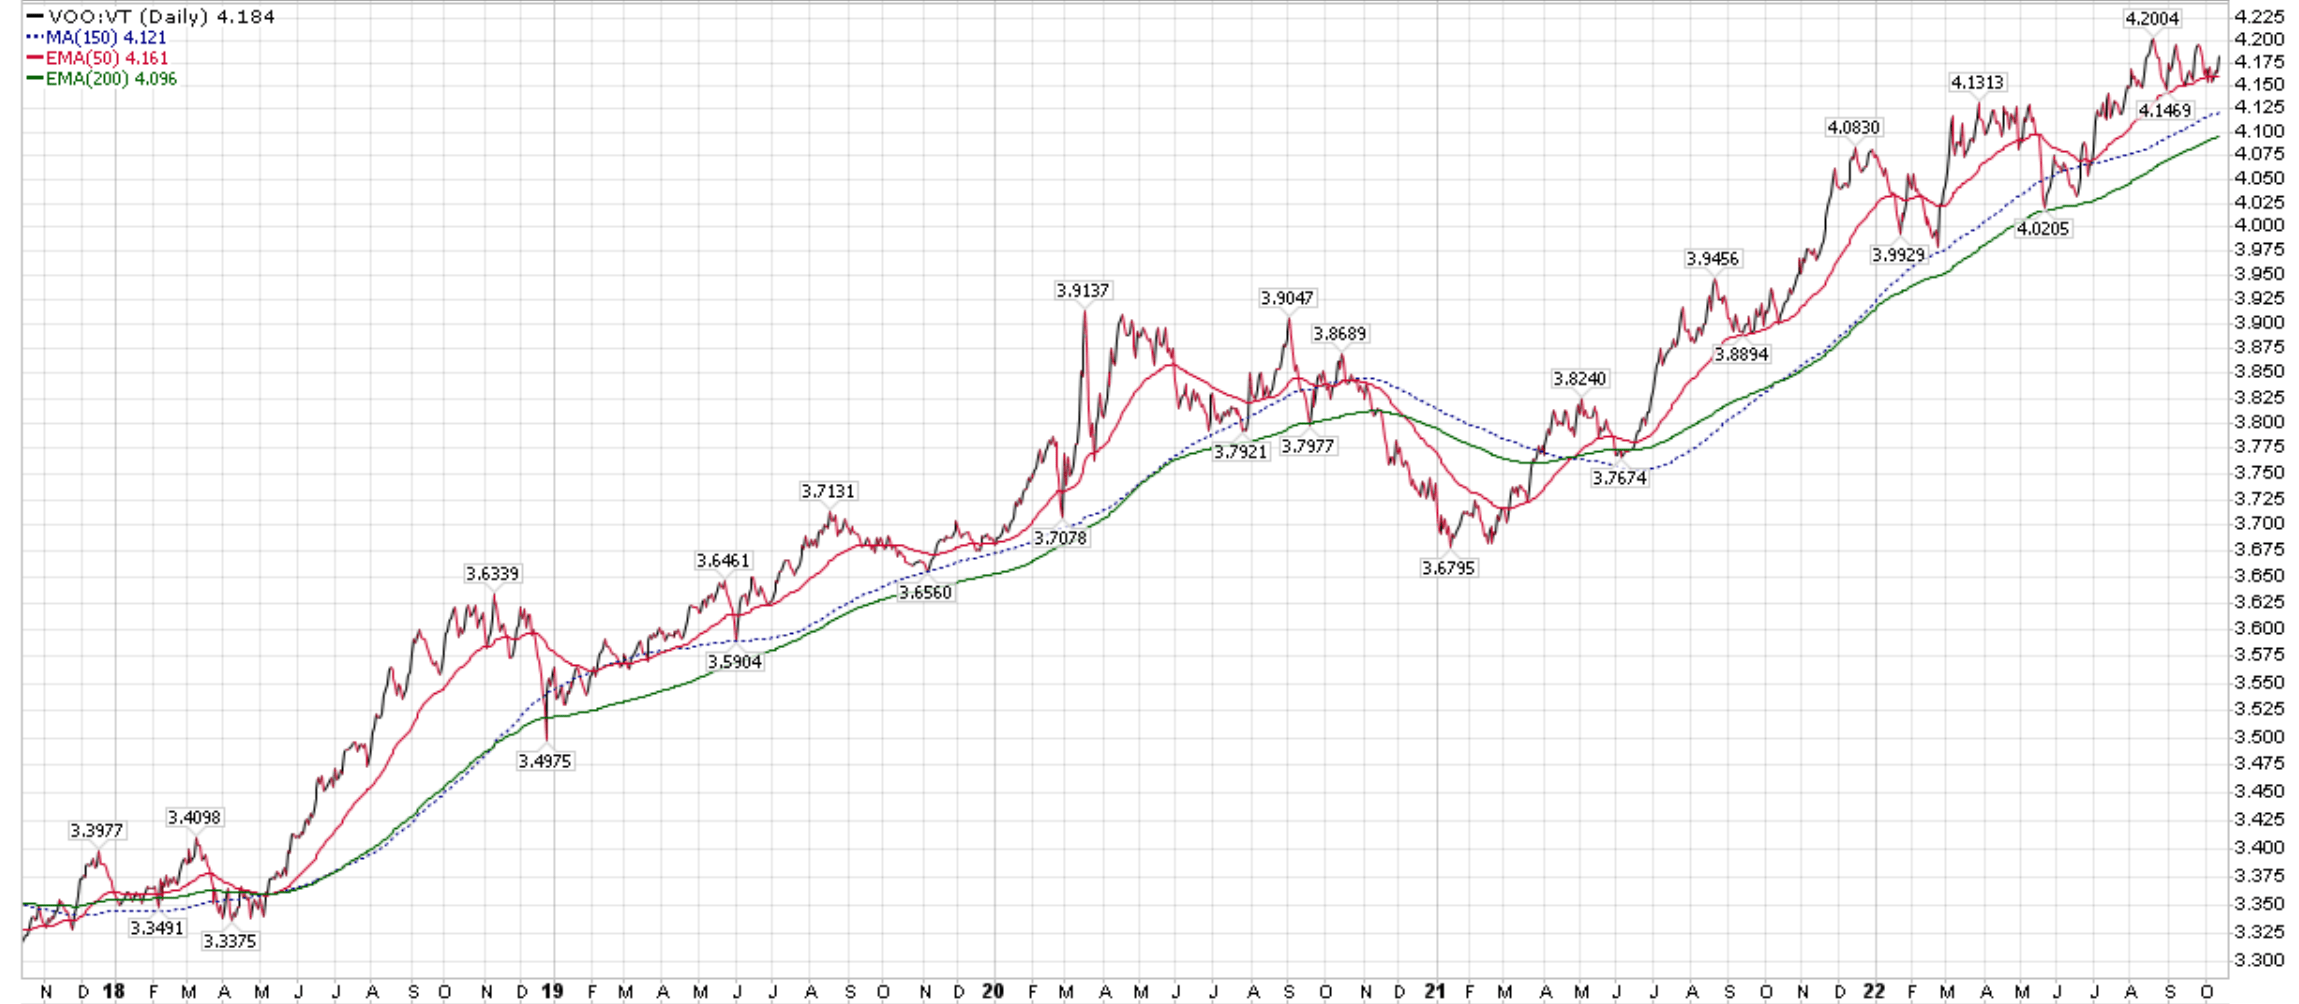
There are a number of reasons why the U.S. (represented by VOO) has outperformed the World (represented by VT). First, regionally, we know that the VT ETF has exposure to weak economic regions such as Europe, which has structurally lower growth rates than the U.S. due to demographics. Second, style-wise, the last few years have seen strong performance from growth companies, which has benefited U.S. markets as they have larger weights in growth stocks. Finally, on an individual security level, we know that the past decade has seen the dominant technology companies like Apple and Microsoft become even more dominant. These companies are much larger weights in U.S. markets and indices.
This doesn’t mean the U.S. is pre-destined to outperform the rest of the world, however. In the early 2000s, the World, represented by the MSCI World Index, had significantly outperformed the U.S. from 1999 to 2008 (Figure 6).
Figure 6 – S&P 500 vs. MSCI World Index (Author created with price chart from StockCharts.com)
In the early 2000s, we had the US. tech bust and the rise of China and other emerging markets, which led to value outperforming growth and international companies as outperforming U.S. ones. If a similar scenario were to occur, for example, if India becomes the next great economic growth story, we may see the VT ETF outperform the VOO ETF.
However, there is no evidence yet, fundamentally or technically, so I would recommend investors stick with VOO as their core equity exposure.
Conclusion
In summary, the Vanguard Total World Stock ETF provides a low-cost way to invest in leading global companies. Although it delivers respectable standalone returns, structurally, the U.S. market continues to outperform the rest of the world. Without fundamental or technical catalysts, I would recommend investors stick with VOO as their core equity exposure.
Be the first to comment