

utah778
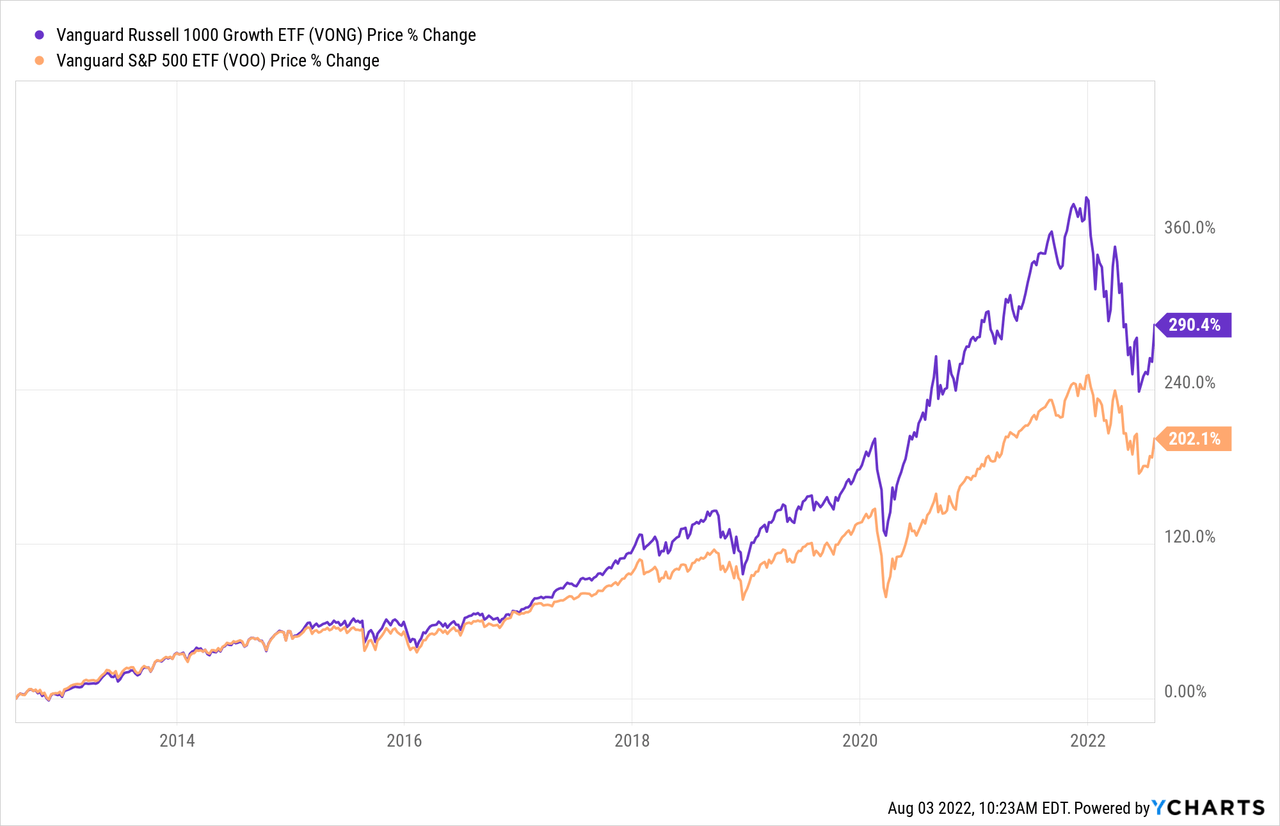
My followers know I occasionally write Seeking Alpha articles on high-level portfolio management and that I’m a big fan of a well-diversified portfolio built for the long term and to stay in the market during its ups-n-downs. In one of my most recent articles on this subject (see The 4-Fund Portfolio), I mentioned the Bogleheads – a group of investors so named because they were inspired by the investment advice of Vanguard’s legendary John Bogle. Bogleheads generally believe in starting early, saving regularly, investing in cost-efficient broadly diversified funds, and holding them through the market cycles. In that vein, I have been gradually reducing the number of holdings and complexity of my portfolio and gravitating toward the Boglehead strategy. However, I still strive to outperform the overall market, and that’s why the Vanguard Russell 1000 Growth ETF (NASDAQ:VONG) came across my radar. VONG has outperformed the S&P500 over the past three-, five-, and 10-year time-frames (see below). Today, I’ll give investors a closer look at the VONG ETF to see if it’s worthy of an allocation in their portfolio.
Investment Thesis
Over the years, I have been bench-marketing my portfolio’s performance against that of the S&P 500. Overall, I have generally lagged the S&P 500 over the past decade – largely due to my (legacy) over-weighting of energy companies that miserably underperformed the market (I have been making up for much of that this year). I’m not unique because the Bogleheads have a point: The Motley Fool says the average investor trails the S&P 500 by 4% and:
According to a 2020 study by financial research company Dalbar, average investors earned about 5% annual growth in their accounts over the last 30 years. That’s roughly half the average growth rate of the S&P 500 in the same time frame.
Indeed, research shows that even professional money managers under-perform the S&P 500. That being the case, I have been gradually pruning my portfolio over the past several years by selling under-performing assets and moving the proceeds into the cost-efficient (0.03% expense fee) Vanguard S&P 500 ETF (VOO). My portfolio has become less complex and my total returns have generally improved.
Yet, I still manage my overall portfolio in an effort to beat the S&P 500. One of the strategies I used was the “A-List” Technology Portfolio: a simple portfolio of four best-of-breed companies: Apple (AAPL), Amazon (AMZN), Alphabet (GOOG) (GOOGL), and Broadcom (AVGO). Since its inception in November 2019, that relatively simple portfolio has significantly outperformed the broad market indexes. The Vanguard Russell 1000 Growth ETF is generally built along the same lines but is much more diversified.
Let’s see how the VONG ETF has positioned investors to succeed going forward and see if it might make sense in your portfolio.
Top-10 Holdings
The top-10 holdings of the Vanguard Russell 1000 Growth ETF are shown below and equate to what I consider to be a relatively concentrated 45% of the entire 518 company portfolio:
Vanguard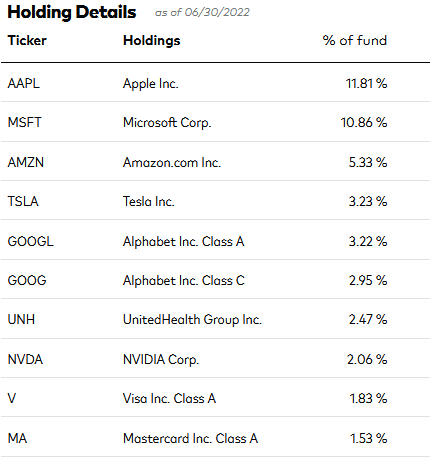
Note, the fund has 22%-plus invested in its top-two holdings: Apple and Microsoft (MSFT). That being the case, investors who already hold significant positions in these two stocks might think twice about adding VONG shares.
In aggregate, Google is actually the No. 3 holding with a 6.45% weight in combined A&C classes of Alphabet (GOOG) and (GOOGL). Despite a supposed “miss” (at least according to some analysts …), Google’s Q2 report was strong in my opinion. Constant currency revenue was up 16% yoy, operating margin was 28%, and the Google Cloud Platform grew revenue by 35.6% yoy. Google ended the quarter with $125 billion in cash and cash equivalents ($9.44/share). On July 15, Google split the stock 20:1. Google continues to be my favorite mega-cap tech stock, with a forward P/E of only 21.8x.
Amazon, the No. 4 holding with a 5.3% weight, also recently split its stock 20:1. Tesla (TSLA) is the No. 5 holding with a 3.2% weight, and the stock has been fighting its way higher ever since CEO Elon Musk first announced he intended to buy Twitter and put a damper on the stock. Musk then announced he has a big case of buyer’s remorse and wants out of the deal. That may have removed the dark cloud over Tesla shares, as there were concerns Musk may have to sell more stock to fund the purchase. The parties are heading to court in October.
The No. 8 holding is Nvidia (NVDA) with a 2.1% stake. Nvidia shares are down ~$140/share since its high setback in November but are down only 6.7% over the past year. Nvidia has evolved into a global leader in AI and ML. The designer of high-performance graphics, data-center compute, and networking chips is due to announce Q2 earnings on Aug. 24. In Q1, Nvidia grew revenue 46% yoy.
The top-10 holdings are rounded out by a 3.4% aggregate weighting in payment processors Visa (V) and MasterCard (MA). The Visa management team is under fire for allegedly accepting payments from users of PornHub.
Overall, the VONG portfolio is most highly exposed to the Technology (44.4%), Consumer Discretionary (18.3%), and – somewhat surprisingly – the Industrials (12.7%) sectors.
Performance
As mentioned earlier, VONG is down 19% over the past year. However, as can be seen in the graphic below, the ETF has significantly outperformed the Vanguard S&P 500 ETF over the past three-, five-, and 10-year timeframes:
Vanguard Fund Compare Tool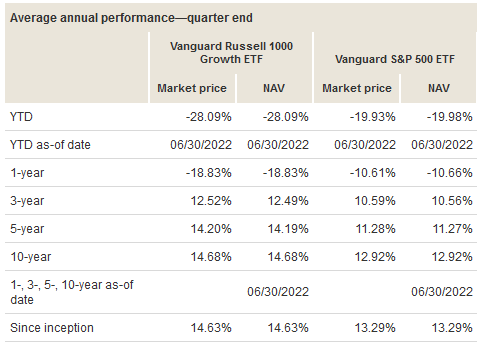
The primary reason for the out-performance appears to be due to the fact that VONG is much more highly weighted in the biggest and best companies. Note that VOO’s top-2 holdings are also Apple and Microsoft, but they have weightings that are only roughly half that of the VONG ETF.
Over the past five years, the VONG ETF has trailed the Schwab U.S. Large-Cap Growth ETF (SCHG) by ~3%:
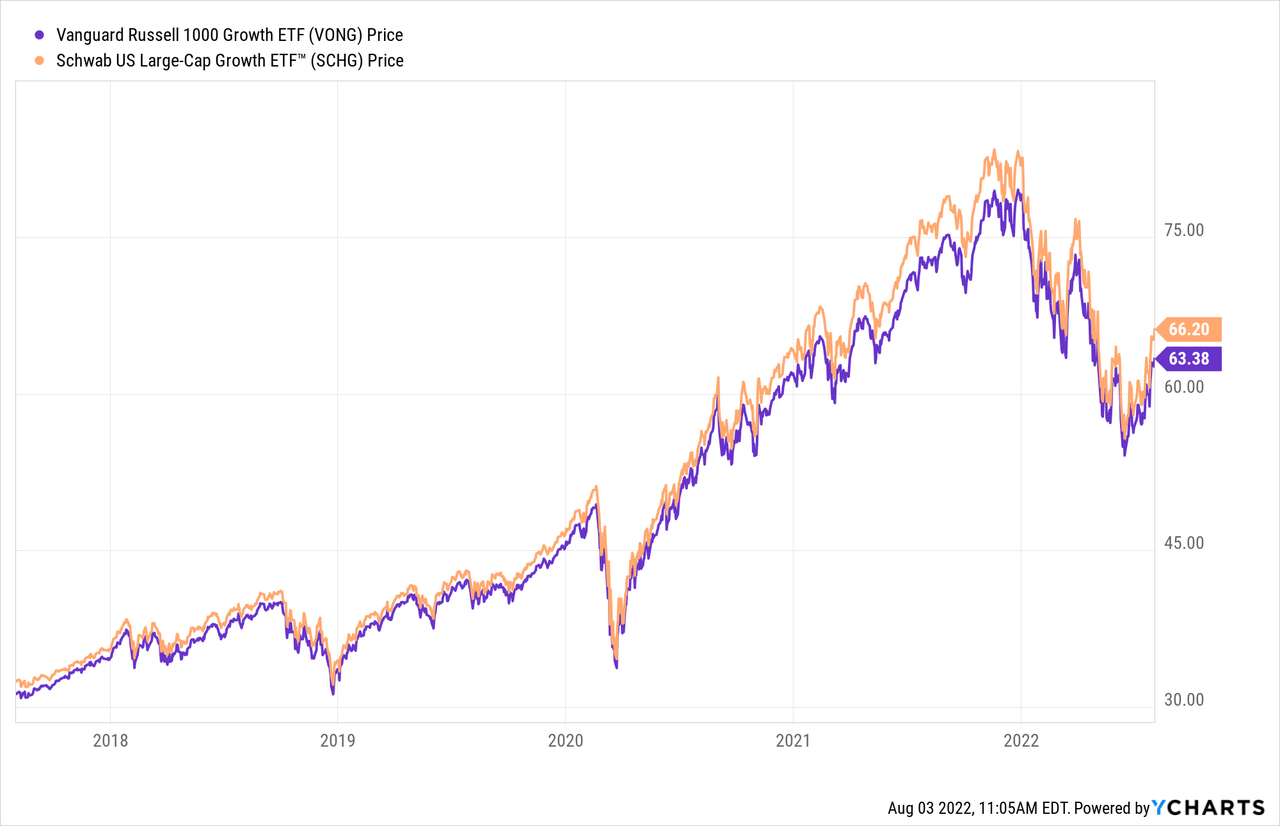
Although both of these ETFs are relatively cost-efficient, part of that out-performance is likely due to the fact that SCHG’s expense fee (0.04%) is half that of VONG’s (0.08%)
Risks
The VONG ETF is certainly exposed to the overall global economy and therefore is subject to the negative impact of high inflation and the general rising interest rate macro-environment. COVID-19-related supply-chain disruptions and shut-downs in China continue to be a potential drag on performance, especially for those companies with large manufacturing operations in that country (i.e., Apple and Tesla, for instance).
Being a “growth” oriented fund, which is currently somewhat out of favor and why the ETF is down ~19% over the past year, the VONG ETF has a relatively high valuation:
Vanguard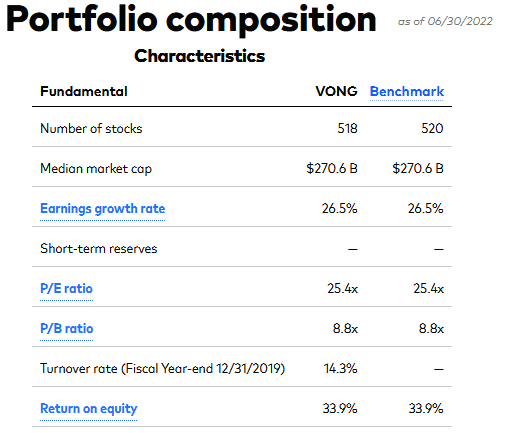
However, while the P/E and price-to-book ratios are arguably high as compared to the S&P 500 (20.9x and 4.1x, respectively), the ETF’s EPS growth rate and return-on-equity metrics are outstanding.
Summary and Conclusion
The rationale for adding the VONG ETF to a portfolio in an attempt to generally outperform the S&P500 over the coming years appears to make sense. It’s a relatively low-cost fund with a higher concentration in some of the biggest and best companies on the planet. That said, the SCHG ETF has an even lower expense ratio and has outperformed VONG over the past five years (but not by much). For more information on the Schwab U.S. Large-Cap Growth ETF, see my Seeking Alpha article Stock Splits A Tailwind For The SCHG ETF.
Be the first to comment