

imaginima
Thesis
My last article on the Vanguard Real Estate ETF (NYSEARCA:VNQ) was co-produced with Envision Research and published last month. That article compared VNQ against the Schwab U.S. REIT ETF (SCHH). The main thesis was to show why out of these two DOMESTIC real estate investment trust (“REIT”) funds, we prefer VNQ over SCHH if I must own a U.S. REIT fund under the current market conditions.
In this article, I wanted to analyze two REIT funds from a new perspective – the role of geographical diversification. And I will compare VNQ against the Vanguard Global ex-U.S. Real Estate ETF (NASDAQ:VNQI) to illustrate this role that we’ve learned from Ray Dalio. As detailed in an earlier article:
We all know the importance of sector diversification and know that owning two funds in the same sector (say holding VNQ and SCHH) does not help diversification. However, proper diversification goes deeper than sector. Properly diversification requires of course sector diversity, but that is the LAST detail. The grand picture starts with isolating your risk exposures using a barbell model, followed by assets that respond differently to fundamental economic forces as shown in the chart below, then followed by geographical diversity.
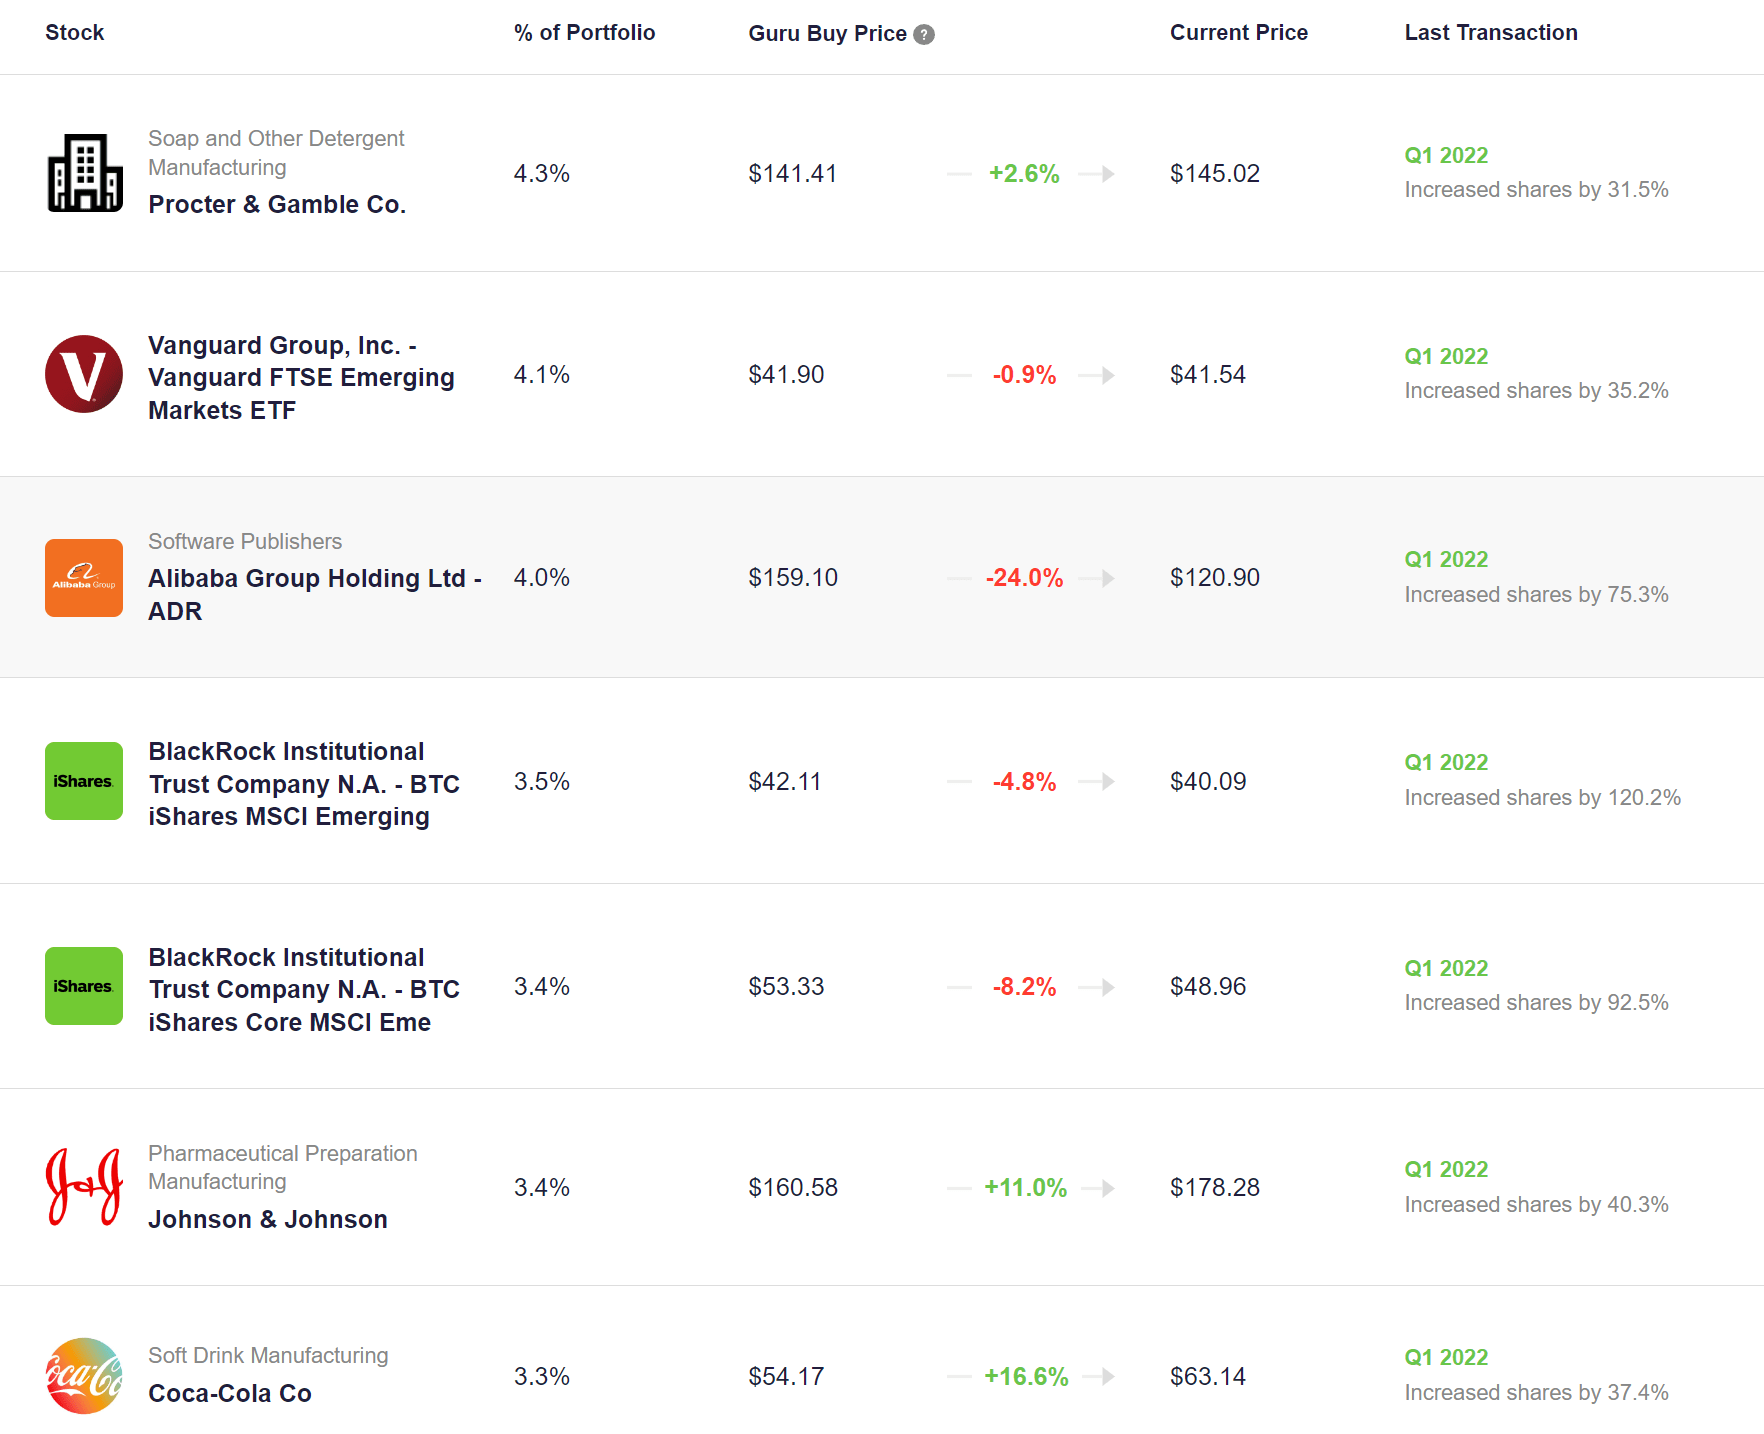
And Ray Dalio’s own positions illustrate this principle in action, as you can see the actual holdings of his Bridgewater positions. You can see that his top holdings are a balanced mix of U.S. and international stocks/funds. The largest position is a U.S. stock – Procter & Gamble (PG) with a 4.3% allocation. Then the Vanguard FTSE Emerging Markets Index Fund ETF Shares (VWO) is a close second, representing about 4.1% of the total portfolio.
The next few top positions are also well diversified both in terms of sectors and geographical exposures. The next 3 largest holdings are all international: Alibaba (BABA, OTCPK:BABAF) at 4%, the iShares Core MSCI Emerging Markets ETF (IEMG) at 3.5%, and the iShares MSCI Emerging Markets ETF (EEM) at 3.4%. These international positions are then balanced by two U.S. Stocks again: Johnson & Johnson (JNJ) and Coca-Cola (KO) at 3.4% and 3.3% allocation, respectively.
In the remainder of this article, we will explore how investors can use VNQ and VNQI to achieve similar geographical diversification in the REIT sector.
macro-ops.com stockcircle.com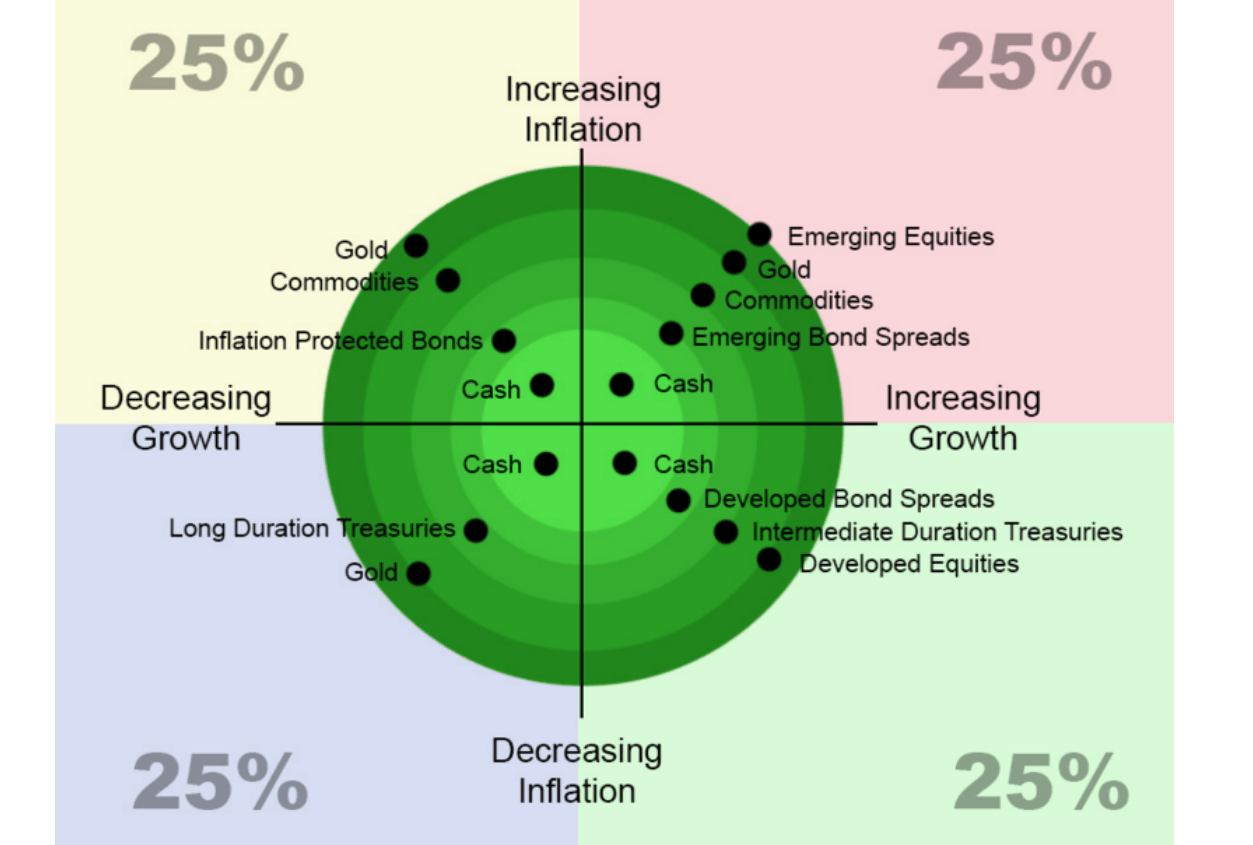
VNQI and VNQ: Basic information
VNQ is one of the largest REIT funds (with more than $21B assets under management “AUM”) and probably needs little introduction. VNQI is much smaller in comparison, with about $5B AUM. As the name suggests, VNQI holds only ex-U.S. Real Estate stocks, and it is based on the S&P Global Ex-US Property index. Both funds charge the same low fee of 0.12%. Note that VQNI holds many more stocks (683) compared to VNQ (169). And therefore, it is less top-heavy. The top ten holdings only represent 18.5% of its total assets, compared to more than 45% for VNQ.
Also, note that VNQI trades at a much lower valuation than VNQ, and we will discuss the implications immediately below.
Vanguard.com Vanguard.com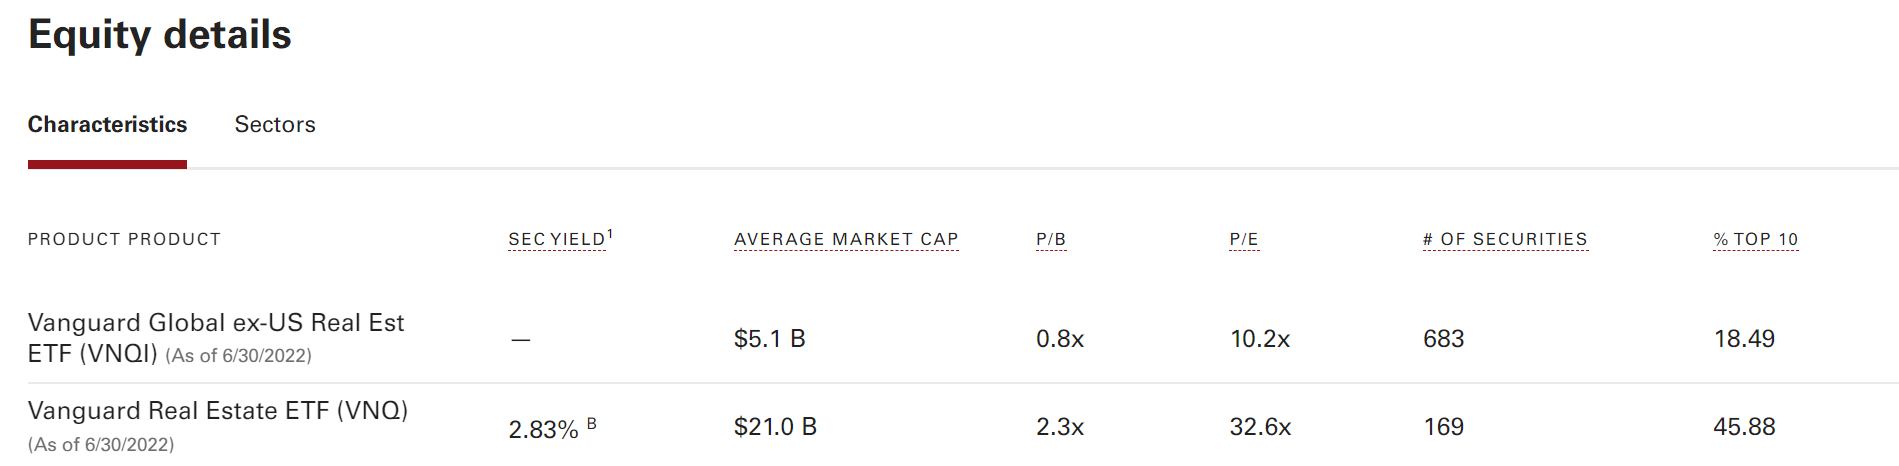

VNQI vs VNQ: Performance and risks
In the past decade (since VNQI’s inception in 2011), VNQ has delivered healthy returns as you can see from the chart below. It has delivered a 9.24% CAGR. In contrast, VNQI’s performance was a bit disappointing. It has only delivered 3.29% CAGR, lagging VNQ by almost 6% per annum.
Also, many investors consider REITs as safe-haven sectors. However, note that both VNQ and VNQI have actually suffered higher volatilities than the overall market represented by the S&P 500. In terms of standard deviation, VNQ’s volatility has been on average 16.6% and VNQI 15.6%, both higher than SPY’s 12.9%. In terms of worst year performance, VNQ lost 13.7% during its worst year and VNQI 16.9%, again both larger than SPY’s 12.6%. And finally, in terms of maximum drawdowns, VNQ’s worst drawdown was 25% and VNQI’s 27%, both larger than SPY’s 20%.
The disappointing performance from VNQI in the past decade has resulted in substantial valuation compression. If you recall from an earlier chart, VNIQ now trades at a fraction of VNQ’s multiples. Its P/B ratio is only 0.8x (selling below book value), about a quarter of VNQ’s 2.3x P/B ratio. And its 10.2x P/E is again only about one-third of VNQ’s 32.6x.
So, looking forward, we see a favorable chance for its return to catch up from a combination of valuation expansion, growth, and dividend payouts. And for investors whose portfolio is dominated by U.S. exposure, VNQI can provide geographical diversification too as to be detailed next.
Portfoliovisualizer.com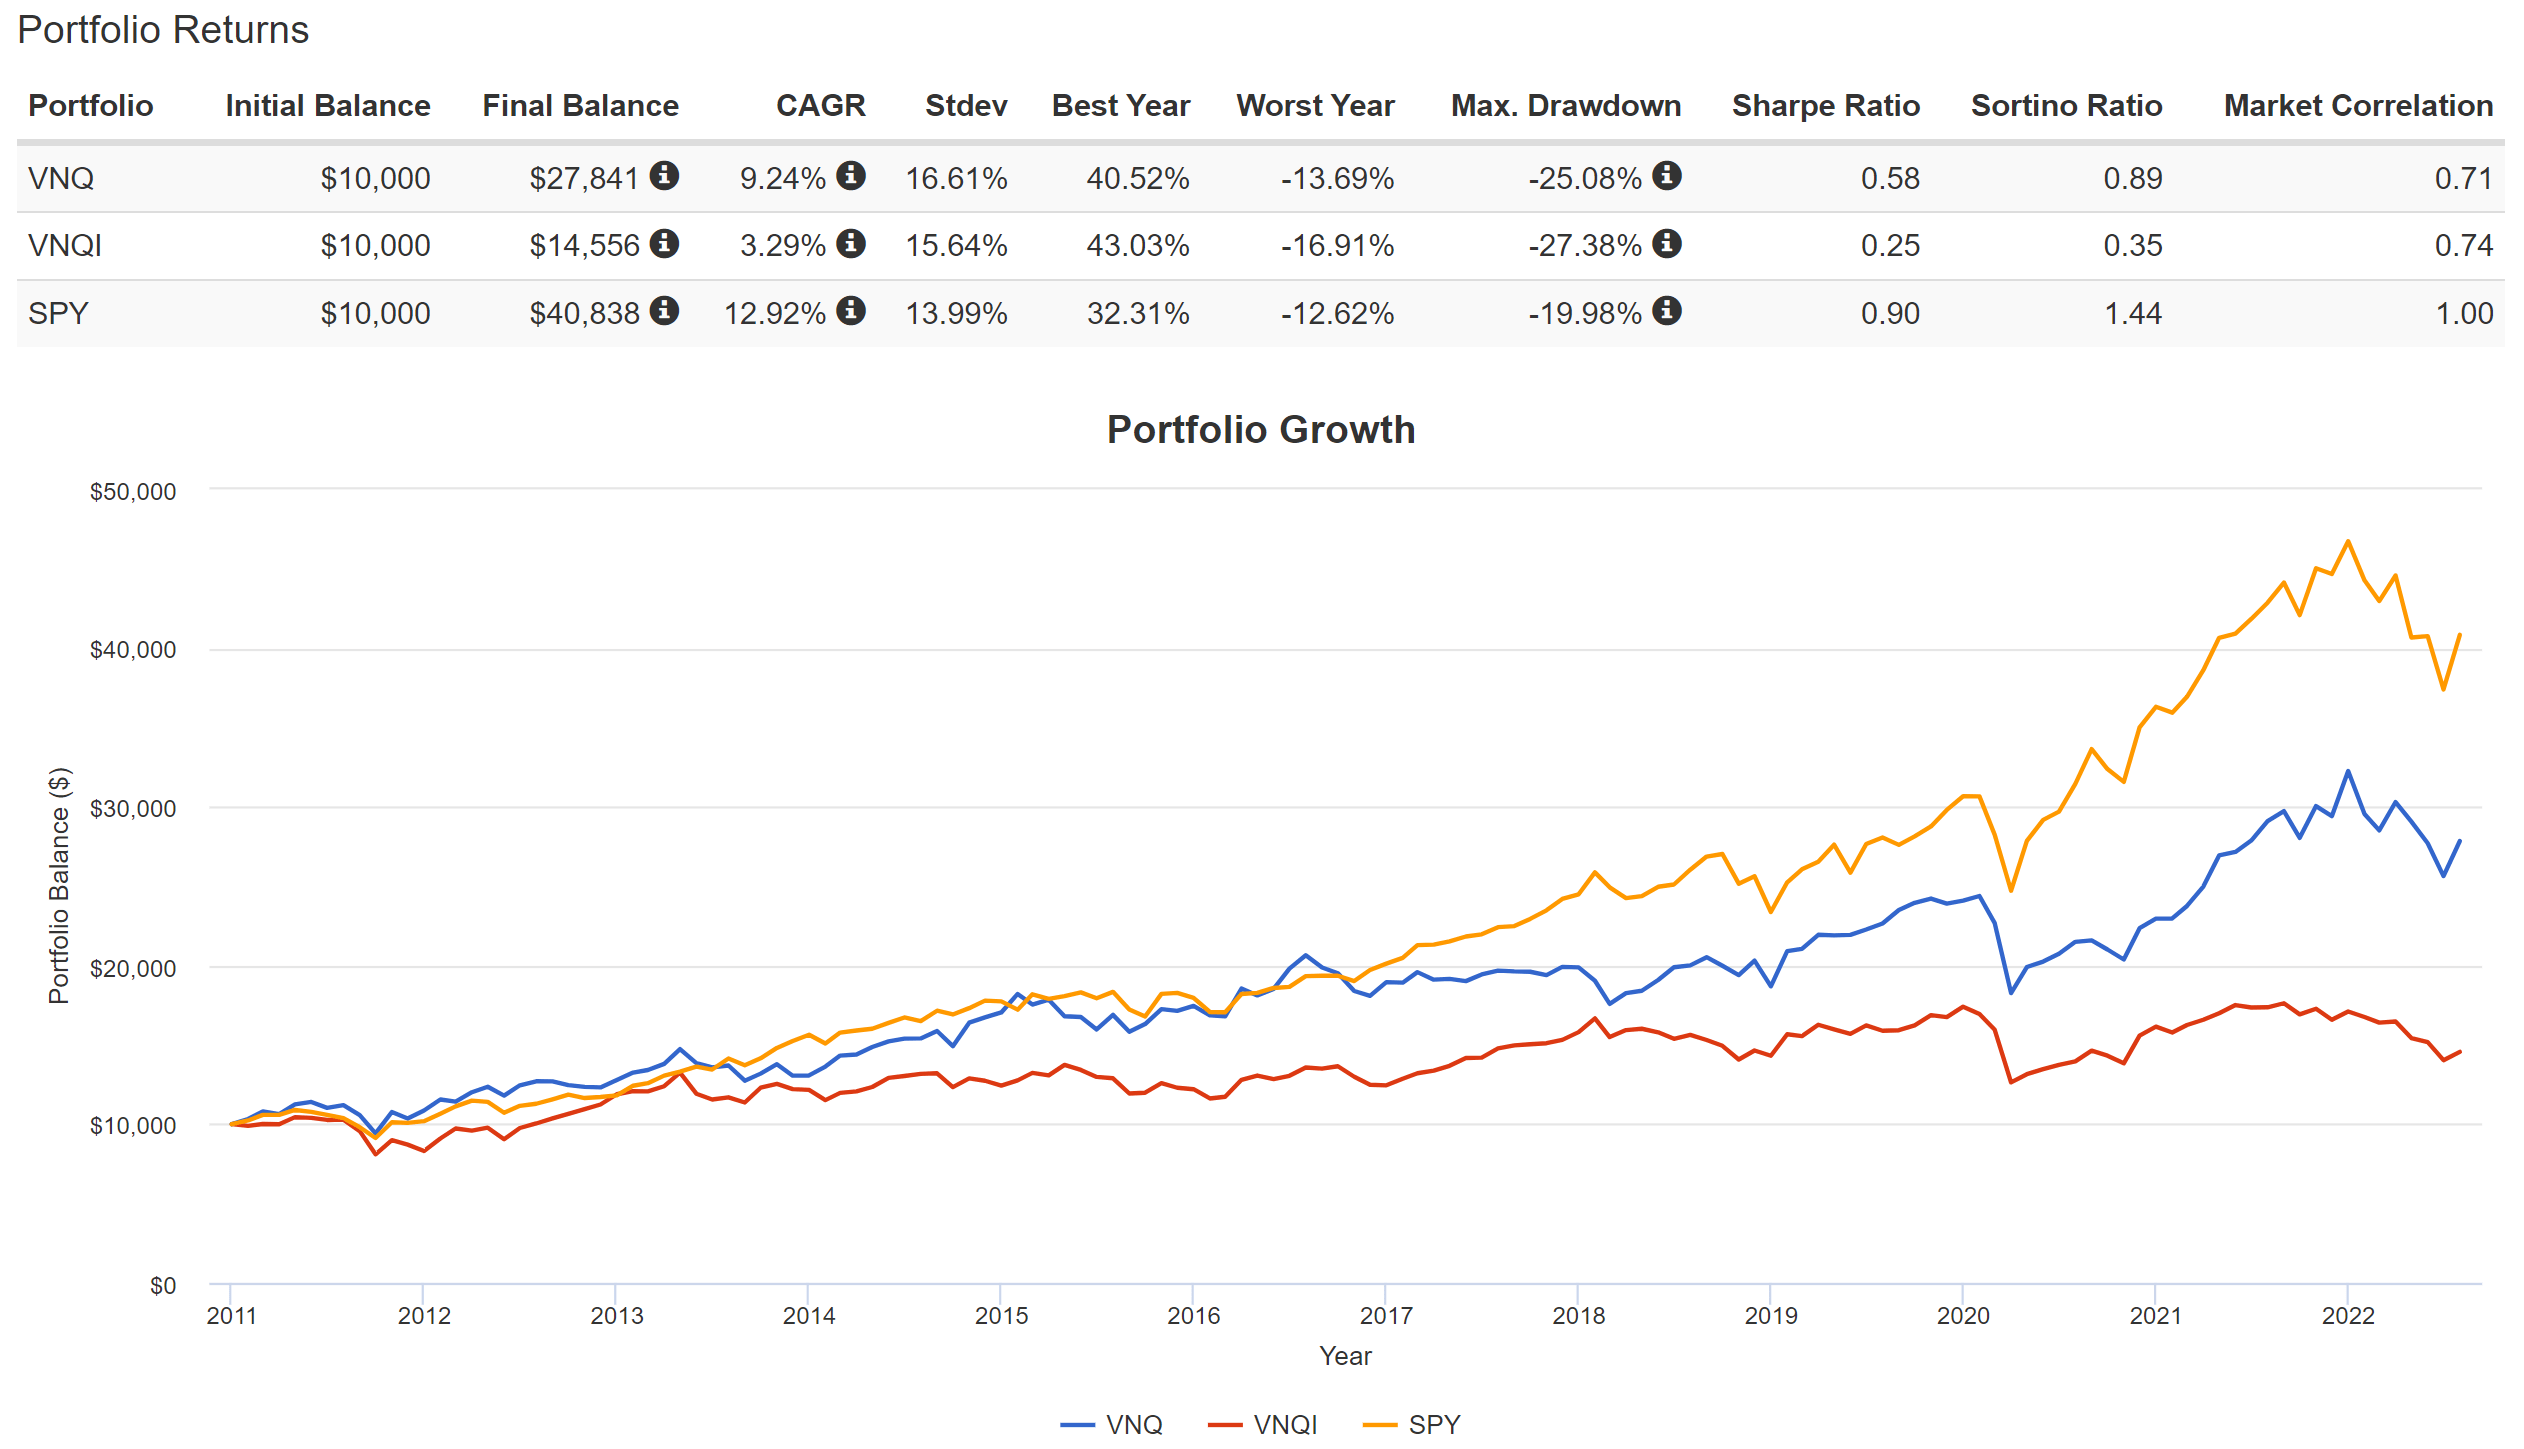
Geographical diversification
As aforementioned, the grand scheme of diversification should start with asset classes and geographical exposures. And REIT, as a separated asset class, has historically demonstrated a mildly strong correlation to the overall U.S. market as you can see from the following chart. Both VNQ and VNQI have demonstrated a correlation coefficient of around 0.71 to 0.73 relative to the overall market.
The key observation here is that VNQ and VNQI themselves also correlated with a coefficient of 0.72 too. And the reason is precisely due to geographical diversification. Given this understanding, investors who want to diversify their REIT exposure geographically can hold both VNQ and VNQI. As shown in the second chart below, a simple 50%-50% mix, with a quarterly rebalance, can help to tame the risks to a good degree and at the same help investors tap into the potential valuation expansion and growth in the international REIT market.
Portfoliovisualizer.com Portfoliovisualizer.com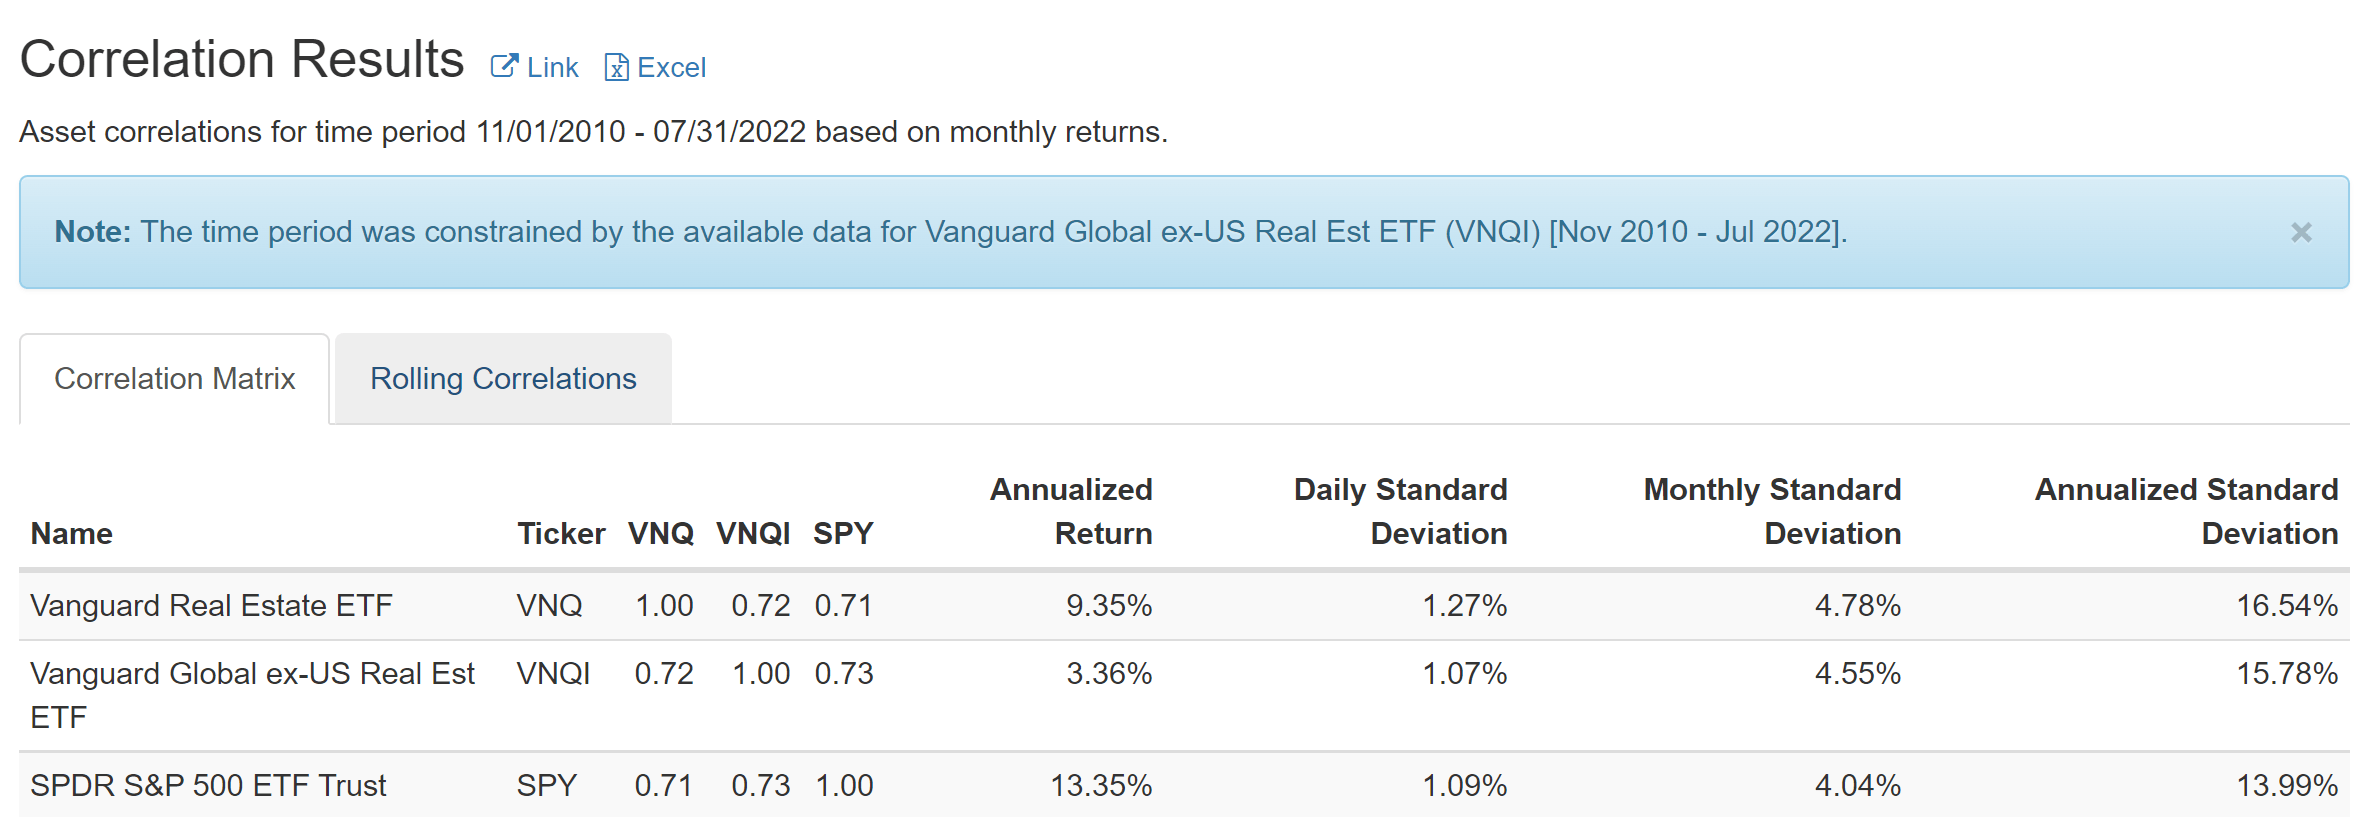

VNQI and VNQ: Dividend comparison
Many investors are drawn to REITs due to their generous dividends. So, here I will check out the dividends before closing the article. As you can see from the following chart, both VNQI and VNQ have been providing attractive dividend yields. VNQ is currently yielding 2.91% currently, and VNQ’s yield is even higher at 7.76%. Although note that VNQI has recently changed its dividend payout schedule to annually. So its current yield of 7.7% is based on the dividend payout from 2021. And the payout amount for 2022 is unknown at this point.
Here I want to revisit the valuation comparison again. VNQ’s average dividend yield in the past ten years has been 2.84%. As a result, its current yield of 2.91% is slightly higher than its historical average, by about 2%. In contrast, VNQI’s historical average yield is 4.4% and its current yield of 7.76% is about 75% above its historical average yield. Again, we wouldn’t know the 2022 payout until the end of the year. But such a large discount from its historical average is too large to ignore.
Seeking Alpha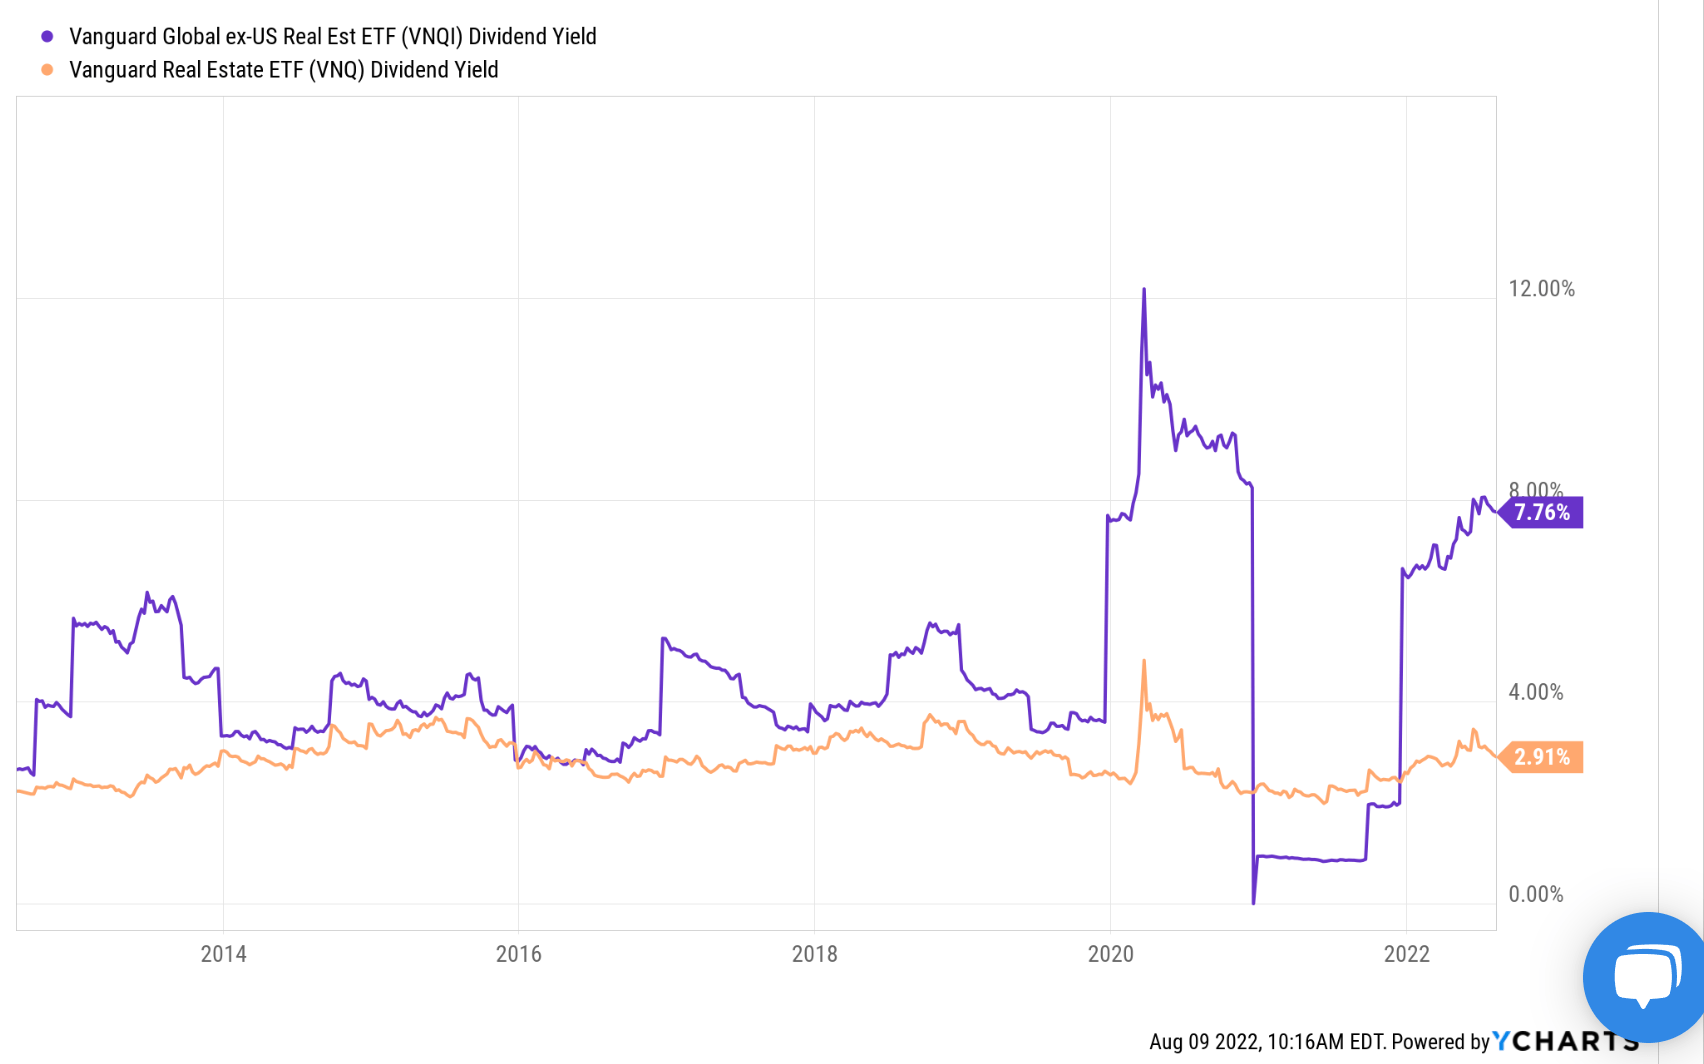
Final thoughts and risks
My last article compared VNQ against SCHH to show why we would prefer VNQ over SCHH if I must own a U.S. REIT fund. This article compared VNQ to VNQI to illustrate the role of geographical diversification. The main takeaway is that we see a favorable chance for VNQI’s return to catch up in the future, driven by a combination of valuation expansion, growth, and dividend payouts. And for investors whose portfolio is dominated by U.S. exposure, VNQI can provide geographical diversification as well given its ex-U.S. exposure.
Finally, risk. As an international REIT Fund, VNQI is more exposed to internal geopolitical risks such as the ongoing war. And the U.S.-China tension can impact the market in the Asian-Pacific region. Also, let me reiterate that the dividend payout from VNQI for 2022 will remain unknown till the end of the year. And historically, VNQI’s payouts have fluctuated in a much wide range than VNQ, as you can tell from the last chart in the article.
Be the first to comment