

VIX, S&P 500, US Dollar, EUR/USD, USD/CAD Analysis
- It’s been a brutal day across global risk markets.
- Coronavirus continues to spark pandemic fears, and related economic slowdowns have become more-and-more likely as the virus has yet to be contained in a number of major economies.
- VIX, often referred to as the ‘fear gauge,’ has spiked to levels not seen since the Global Financial Collapse.
VIX, USD Spike as Fear Drives Global Markets
It’s been another big day of moves across global markets and today appears to be somewhat of a turning point. The S&P 500 is now officially in bear market territory following another limit-down move ahead of the US equity open. The VIX, often referred to as the ‘fear gauge’ around the S&P 500 has rushed up to its second highest level ever, trailing only the run that showed during the Financial Collapse. Bond markets remain in disarray and global governments are still shuffling around in an attempt to find a solution to quell the spread of Coronavirus.
To date, no lasting solutions have yet shown.
Another sizable move has shown in the US Dollar with the currency spiking to go along with this morning’s risk-off moves. As covered by our own Justin McQueen earlier this morning, US Dollar funding is sending a distress signal across global markets, with another strong move showing after this morning’s European Central Bank rate decision.
The US Dollar has gained approximately 1.7% today, adding on to the prior bullish move to total a 3.89% move from this week’s low.
US Dollar Daily Price Chart
Volatility Levels Hit ‘Extreme’ Territory
The VIX index is trading just under the 70-level, which marks the second highest reading ever, rivaling only the Financial Collapse.
VIX Monthly Price Chart
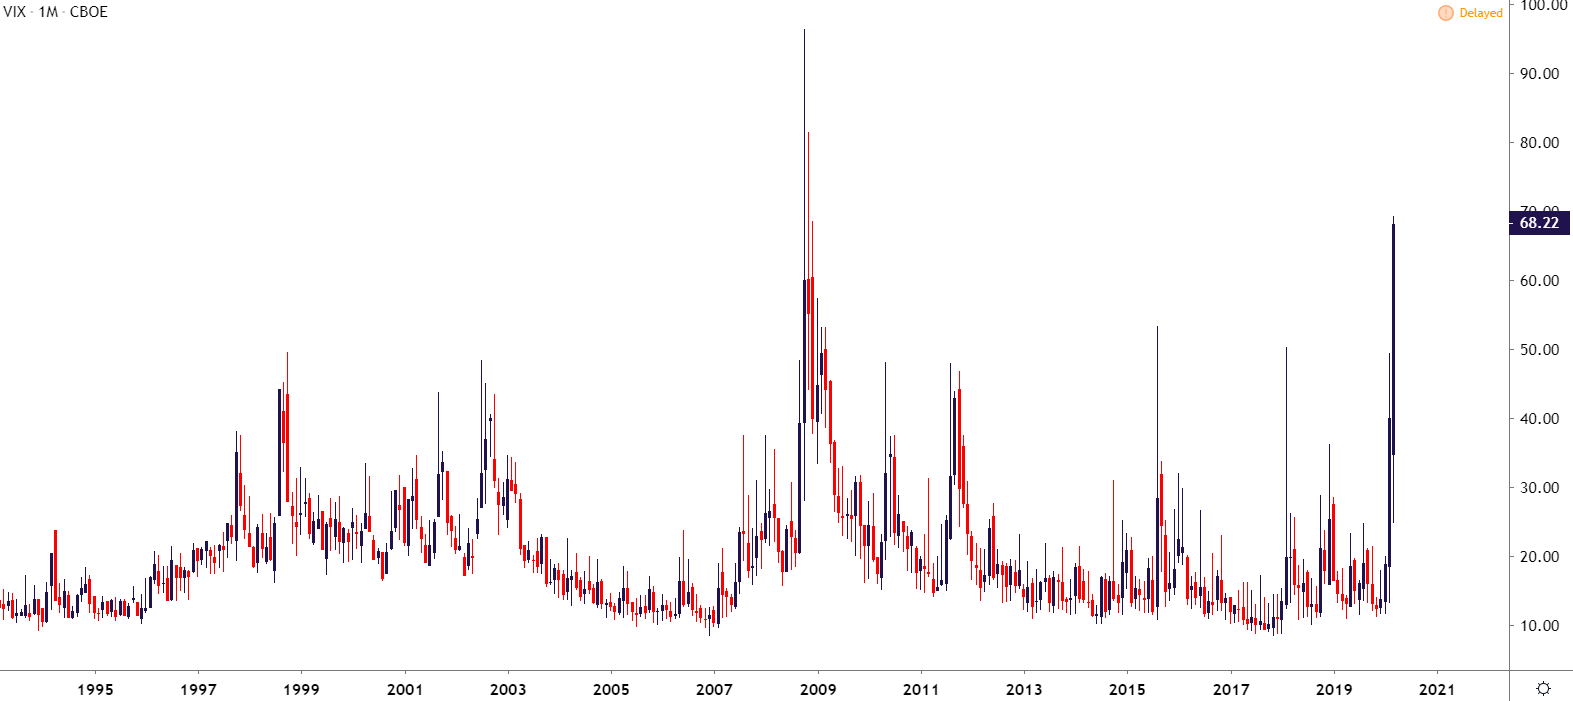
As looked at earlier this morning, equities have already put in a profound move; rushing into ‘bear market’ territory after the longest bull market in recorded history. My colleague, Austin Sealey, took a wide look at the matter, incorporating some global equity indices. Perhaps more troubling, there’s little evidence to suggest that the sell-offs are yet over.
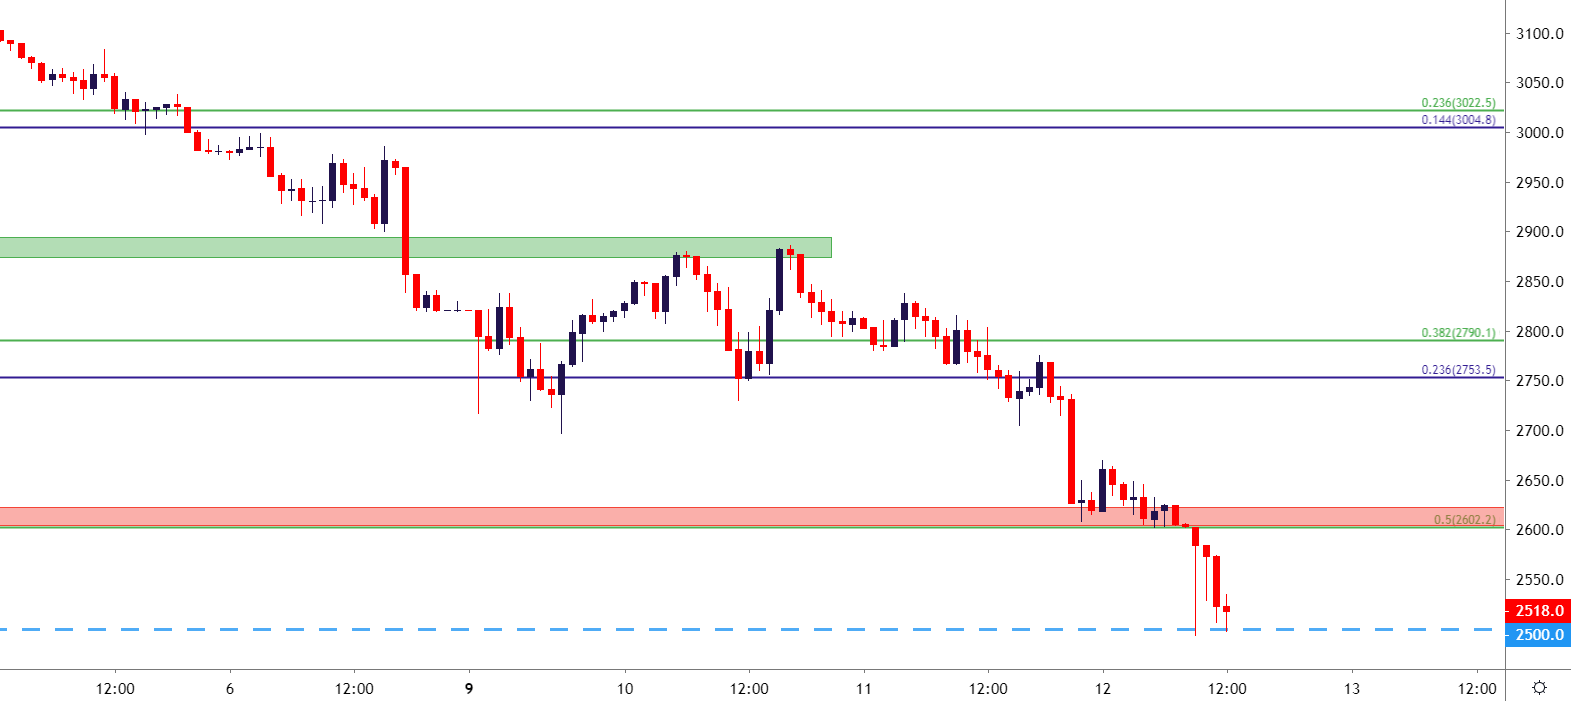
At this point, the S&P 500 has caught a bit of support around the 2500 psychological level, which is helping to stem the declines, at least for now.
S&P 500 Hourly Price Chart
Back to the FX-world, EUR/USD is putting in an outsized move this morning after the European Central Bank rate decision, furthering the fall from the 1.1448-1.1500 resistance zone looked at earlier this week.
| Change in | Longs | Shorts | OI |
| Daily | -11% | -32% | -25% |
| Weekly | -23% | -43% | -37% |
EUR/USD Daily Price Chart

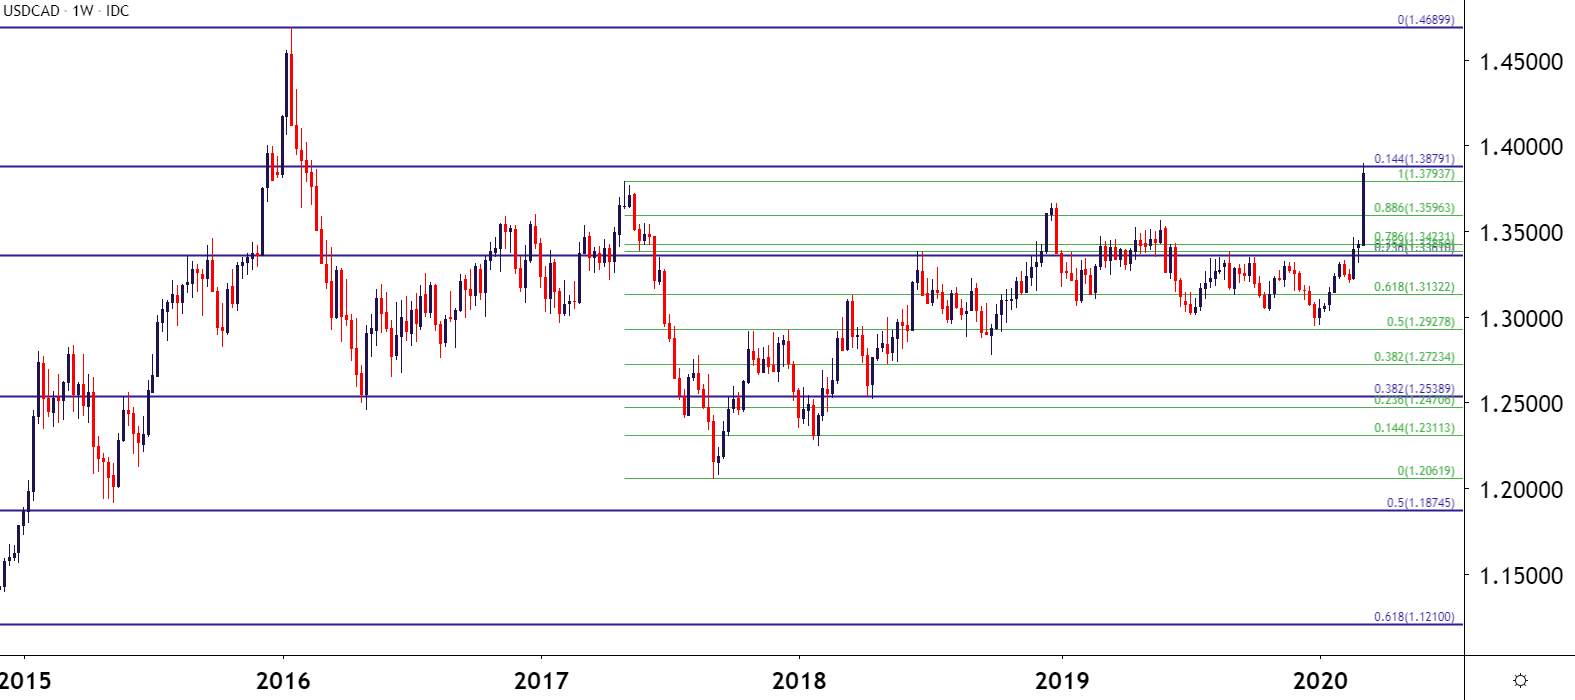
Not to be lost in the shuffle and perhaps better illustrating that rush into the US Dollar, USD/CAD has jumped up to a fresh four-year high; covered earlier in the day by my colleague, Michael Boutros.
| Change in | Longs | Shorts | OI |
| Daily | -27% | -12% | -16% |
| Weekly | -45% | -15% | -25% |
USD/CAD Weekly Price Chart
— Written by James Stanley, Strategist for DailyFX.com
Contact and follow James on Twitter: @JStanleyFX
Be the first to comment