

Justin Sullivan
Introduction: Why Is Visa Stock Up?
Visa Inc. (NYSE:V) released their Q1 FY23 results after markets closed on Thursday (January 26). Shares are up 3.4% (to $232.32) as of 3:30 pm EST on Friday, having now risen by more than 12% year-to-date:
|
Visa Share Price (Last 1 Year) 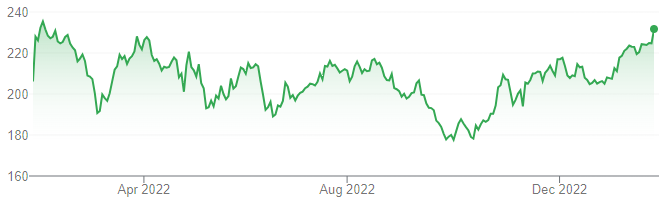 Source: Google Finance (27-Jan-23). |
Since we initiated our Buy rating on Visa in June 2019, shares have gained 46% (including dividends) in roughly 3.5 years, but the share price is only 6.2% higher since the end of 2020.
Visa’s growth in Q1 FY23 was exceptionally strong, thanks to a post-COVID rebound in cross-border volumes. Excluding both currency and the exit from Russia, revenues grew 19.2% and Adjusted EPS grew 30.6% year-on-year; including these one-offs, Adjusted EPS still grew 20.6%. Just as importantly, revenues from new flows and value-added services each grew by more than 20%. Both U.S. Payments and Cross-Border Volume have remained strong in January so far. FY23 outlook has been improved with more cost control, a lower tax rate and a weaker dollar, and we now expect Adjusted EPS to grow at low-teens year-on-year. Visa shares are at 29.2x CY22 EPS. Our forecasts indicate a total return of 94% (20.0% annualized) by September 2026. Buy.
Visa Buy Case Recap
Our investment case on Visa is based on a continuation of its strong EPS growth (but at a lower-than-history CAGR of low-teens) and a partial return to its premium valuation multiple, driven by:
- Electronic payment volumes are growing structurally, from both GDP growth and the continuing shift away from cash and cheques; even in the U.S. and Europe, a significant amount of consumer spending remains in cash; the potential is even greater in newer geographies
- Visa and Mastercard (MA) are increasingly penetrating new payment verticals including Business-to-Business, Business-to-Consumer and Peer-to-Peer; they are also increasingly providing value-added services that utilize their platform status and wealth of data, adding further revenue growth
- Incumbent payment networks enjoy natural advantages in scale and network effects; regulations ensure a high barrier to entry
(Mastercard is also Buy-rated in our coverage; see our review of their Q4 2022 results this week.)
Before COVID-19, Visa’s Adjusted Net Income has grown at a CAGR of 21.8% in FY17-19 (with EPS growth further helped by buybacks); even including the pandemic years, Adjusted Net Income CAGR was 14.0% in FY17-22:
|
Visa Net Income, Dividends & Buybacks (FY13-22) 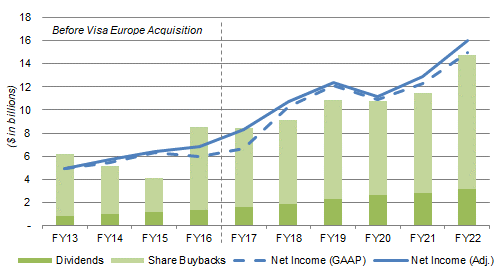 Source: Visa company filings NB. Visa Europe acquisition was completed in Q4 FY16. |
COVID-19 was a significant short-term negative for Visa, with travel restrictions disrupting high-margin cross-border volumes, but a long-term positive, accelerating the shift to electronic payments.
Q1 FY23 saw Visa’s rebound from pandemic disruption approaching completion, as it enjoyed another quarter of strong double-digit underlying growth.
Visa Q1 FY23 Results Headlines
Visa’s growth in Q1 FY23 was exceptionally strong, thanks to a post-COVID rebound in cross-border volumes.
Including the impact of currency and the exit from Russia, Adjusted EPS still grew 20.6% year-on-year; excluding currency, Net Revenues grew 14.7% and Adjusted EPS grew 25.0%. If we exclude both currency and Russia, then Net Revenues grew 19.2% and Adjusted EPS grew 30.6% year-on-year:
|
Visa Headline Growth Rates (Q1 FY23) 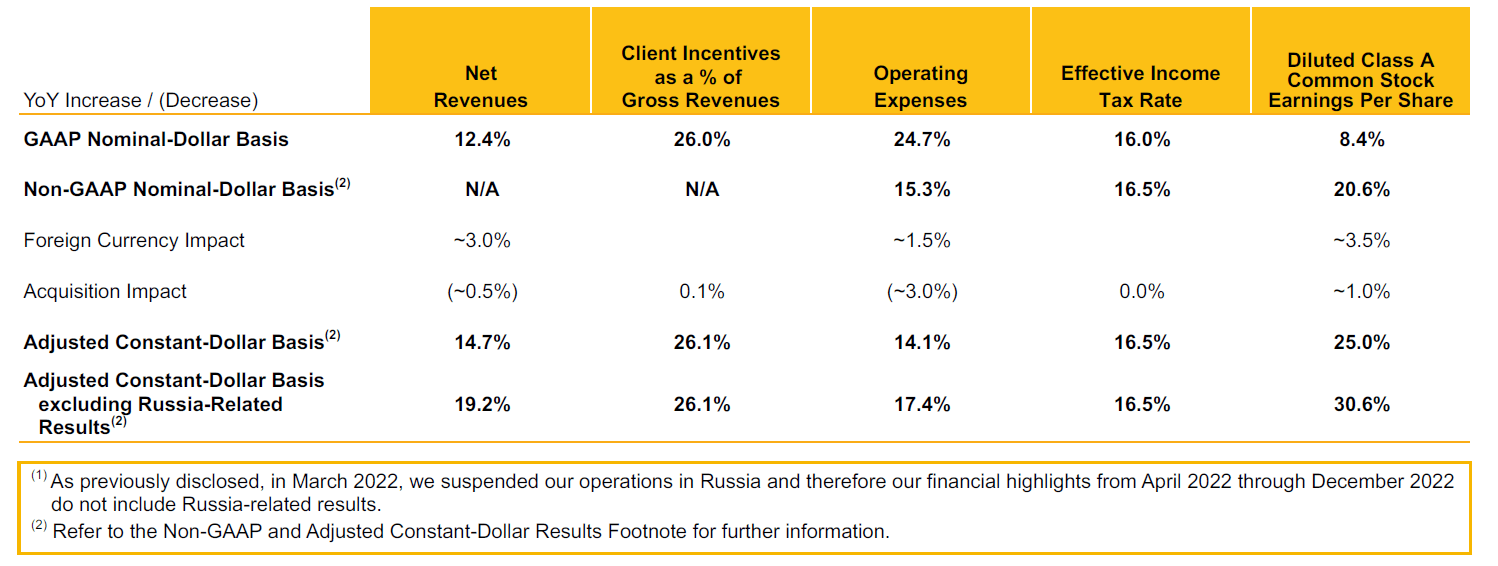 Source: Visa results presentation (Q1 FY23). |
The biggest source of revenue growth in Q1 FY23 was a post-COVID rebound in cross-border volumes, which pushed International Transaction Revenues up 28.7% year-on-year:
|
Visa P&L (Non-GAAP) (Q1 FY23 vs. Prior Periods) 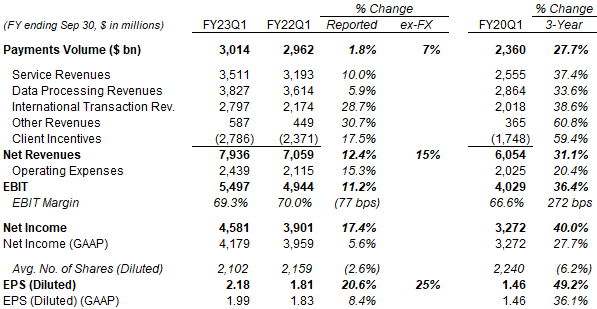 Source: Visa results releases. NB. Each quarter’s Service Revenues are based on volumes in the preceding quarter. |
Just as importantly, revenues from new flows and value-added services each grew by more than 20%.
New flows revenues are not directly observable from the P&L, but they contribute to the growth in Service Revenues and Data Processing Revenues. Value-added services revenues are about two thirds in Services Revenues and one third in Other Revenues, with the latter growing even faster than 20% because of marketing services and consulting revenues associated with the World Cup last year.
Volume Trends Remain Strong in January
Both U.S. Payments and Cross-Border Volume have remained strong in January so far.
Total U.S. Payments volume remained between 40% and 50% higher than 3 years ago through Q4, decelerating somewhat between October and December, but reaccelerating in January so far:
|
Visa U.S. Payments Volume Indexed to 3 Years Ago 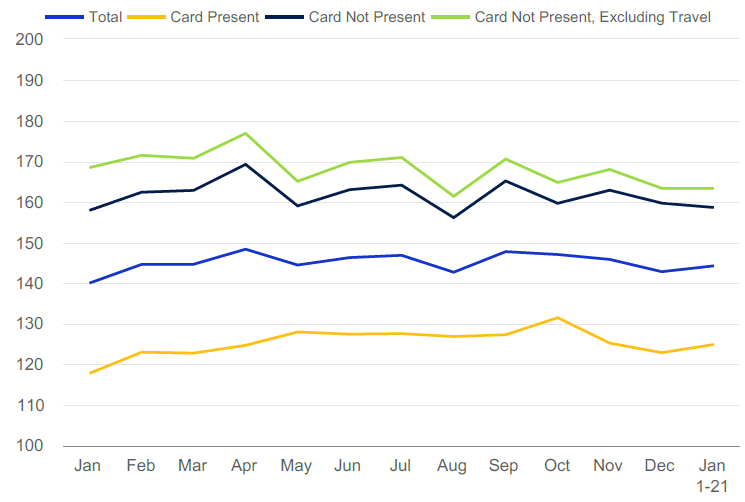 Source: Visa results presentation (Q1 FY23). |
The “deceleration” between October and December likely means little, as the same pattern was observed in Q1 FY22 results; holiday spending has been smoothing out across CYQ4 in recent years, and the fall in U.S. gasoline prices this year has likely also contributed.
Total Cross Border Volume, as indexed to 3 years ago, was still more than 30% higher as of January 1-21:
|
Visa Cross-Border Volume, Indexed to 3 Years Ago (Ex. Intra-Europe) 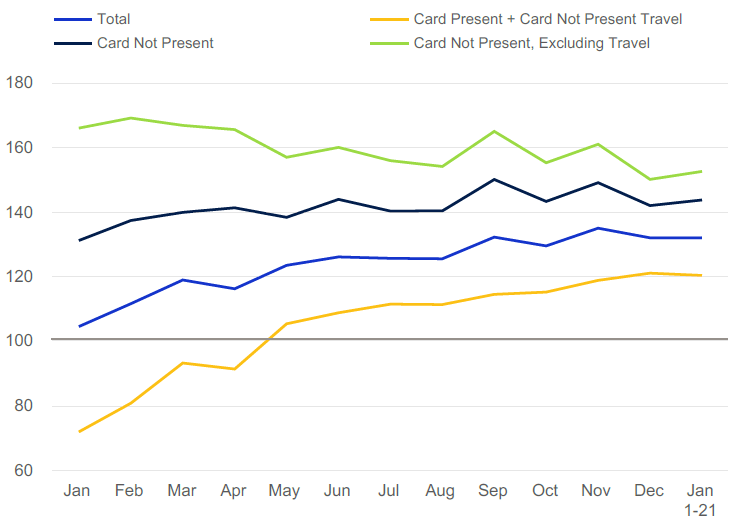 Source: Visa results presentation (Q1 FY23). NB. Growth rates are in local currency. |
Q1 FY23 likely represents the last quarter where Visa sees a material benefit from the recovery from COVID. As CFO Vasant Prabhu said on the earnings call:
“We are now past the pandemic recovery stage on domestic volumes and transactions … The cross-border recovery is still ongoing [but] … many corridors … are well above the 2019 level. [Among] the three that were not and are still not, U.S. inbound is approaching 2019 levels”
The other two corridors that have not yet fully recovered to pre-COVID levels are China-related, but contribute little to Visa revenues. (Prabhu stated that Visa’s exposure to China was “fairly close” to that of Mastercard, where China represented 1% of in-bound cross-border volume and 3% of out-bound cross-border volume back in Q4 2019.)
FY23 will thus likely see a return to Visa’s traditional growth trajectory, except the impact from exiting Russia.
Visa’s FY23 Outlook Now Improved
Visa’s FY23 outlook has been improved, with more cost control, a lower tax rate and a weaker dollar.
Recall that, at Q4 FY22 results, management has provided an FY23 outlook that included, on a Non-GAAP basis:
- Net Revenues growth to be at mid-teens on an underlying basis, but with 4 ppt of impact from currency and 2 ppt from the exit from Russia, so at high-single-digits in reported dollars
- OpEx growth to be low-double-digits excluding currency, but high-single-digits in nominal dollars
- Tax Rate to be 19.0-19.5%
This quarter, management has provided new details on its FY23 outlook, including:
- For Q2 FY23, Net Revenue growth to be mid-teens on an underlying basis, but with 2 ppt of impact from currency and 5 ppt from the exit from Russia, so at high-single-digits in reported dollars
- OpEx growth to decelerate by 2-3 ppt sequentially each quarter from Q2
- Tax Rate to be 18.5-19.0%, 0.5 ppt lower than before
The larger impact from Russia is Q2 is due to the recognition of two quarters of Service Revenues in the prior-year quarter. The weaker currency headwind is likely due to the significant weakening of the U.S. dollar since Q4 FY22 results (on October 25), including by 8% against the euro.
We believe the more detailed guidance implies a 12% growth in Net Revenues and an 11% growth in Operating Expenses, compared to both at 8% before:
|
Visa FY23 Non-GAAP P&L Outlook By Quarter (Our Estimates) 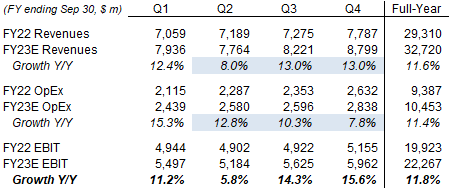 Source: Librarian Capital estimates. |
The outlook implies Visa’s EBIT growth should trough at around 6% in Q2 but accelerate thereafter, due to the deceleration in OpEx growth and the absence of the headwind from Russia after Q2.
For FY23, the current outlook implies a 12% growth in Net Income:
|
Visa FY23 Non-GAAP P&L Outlook (Our Estimates) 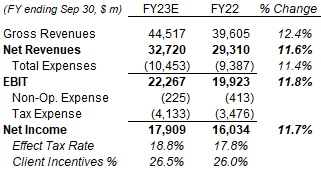 Source: Librarian Capital estimates. |
Changes in the macro environment, including the possibility of a U.S. recession in 2023, may mean that FY23 will turn out differently. However, what is important here is that cost growth is now being brought down to a lower level that will enable operational leverage and margin expansion even on lower revenue growth.
CFO Vasant Prabhu was explicit that, in the event of a recession, there would be cost cuts to offset weaker revenue growth:
“Should there be a recession or a geopolitical shock that impacts our business, slowing revenue growth below our planning assumptions in the second half, we will, of course, adjust our spending plans by reprioritizing investments, scaling back or delaying programs and pulling back as appropriate in personnel expenses, marketing spend, travel and other controllable categories.”
In any case, a recession would be a temporary headwind and would not alter Visa’s long-term growth trajectory.
Valuation – Is Visa Overvalued?
At $232.32, relative to CY22 financials, Visa shares are trading at a 29.2x P/E and a 3.5% Free Cash Flow (“FCF”) Yield; relative to FY22 financials, the valuation is a similar 30.5x P/E and 3.5% FCF Yield
|
Visa Net Income, Cash Flows & Valuation (FY19-CY22) 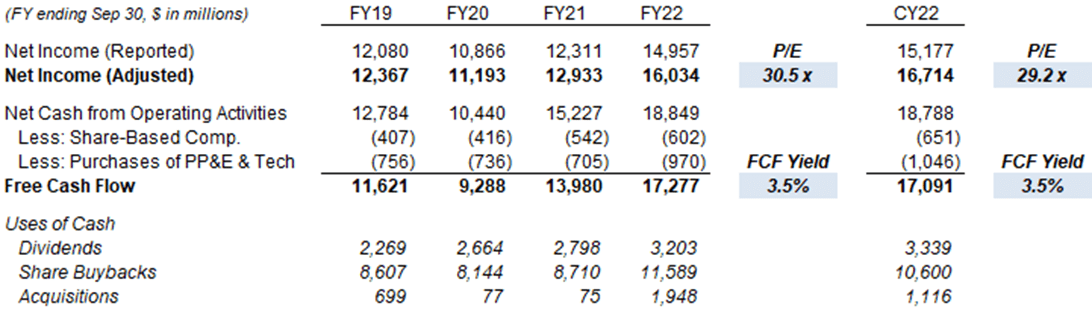 Source: Visa company filings. |
FCF in FY22 (and CY22) was higher than Adjusted Net Income due to less client incentives paid than accrued ($944m), accrued litigation charges ($476) and non-cash equity investment losses ($264m).
Visa has a Dividend Yield of 0.8%, based on a quarterly dividend of $0.45 ($1.50 annualized), raised 20% in October.
Compared to Mastercard, Visa has a lower P/E (29.2x CY22 EPS, vs. Mastercard’s 34.9x) and a slightly higher Dividend Yield (0.8% vs. 0.6%). They are both attractive investments, but we prefer Visa over Mastercard, because we prefer to be more conservative on valuation. Mastercard also carries the tail risk of an ongoing £14bn class action lawsuit in the U.K.
Visa carried out the equivalent of $12.5bn of share repurchases in FY22, equal to 2.6% of the current market capitalization, with $11.6bn of actual buybacks and another $850m added to the MDL litigation escrow account (which has the same effect as buybacks). Another $3.5bn was carried out during Q1 FY23.
Visa Stock Forecasts
We raised our FY23 forecast slightly but keep our other assumptions unchanged. Our key assumptions now include:
- FY23 Net Income growth of 11% (was 8%)
- From FY24, Net Income to grow at 12.5% each year
- Share count to fall by 1.5% each year
- From FY24, dividends to be on a 22.5% Payout Ratio
- P/E of 35x at FY26 year-end
Our new FY26 EPS forecast of $12.60 is 3% higher than before ($12.26):
|
Illustrative Visa Return Forecasts 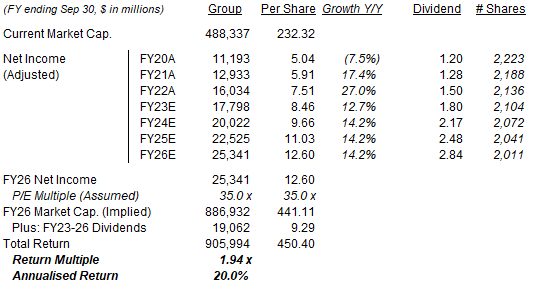 Source: Librarian Capital estimates. |
With shares at $232.32, our forecasts indicate a total return of 94% (20.0% annualized) by September 2026.
Is Visa Stock A Buy? Conclusion
We reiterate our Buy rating on Visa Inc. stock.
Be the first to comment