

bymuratdeniz/E+ via Getty Images
This article starts with an overview of Visa’s (NYSE:V) valuation and strategic situation, and then it goes through a more specific forecast of growth, profitability, and dividends, to show what kind of dividend return an investor can obtain in the long term.
Visa is the world’s largest digital payment service provider, with a market capitalization of $463bn and a 2021 revenue of over $24bn. In the latest quarter, ending in December ’21, revenues grew year-on-year by 24%. The company appears overvalued in terms of its sales, with a price to sales ratio of 19, 5 times the sector median.
The valuation is not as expensive if we look at earnings. Thanks to its huge profitability, with a net income margin of 52%, nine times the sector median. That is why the price-to-earnings ratio is only 30% higher than the sector median, at 37.80 (GAAP TTM).
If we look at other factors which contribute to a valuation, we can speak primarily of growth and stability. Visa’s growth score is similar to the sector median if we look at revenue and earnings, but we should remember that we are talking about the largest company in its sector with a long track record. In fact, if we compare it to its peers, we find similar valuations. Mastercard (MA), for example, the most comparable peer, has the same valuation score. Mastercard is slightly better on revenue growth and Visa is a little better on profitability and cash flow growth.
Visa’s growth score is far superior to the sector median in terms of cash flow. Levered free cash flow, for example, is growing at a rate of 48%, nearly three times the sector median. This suggests that Visa has achieved a relatively low need of funds for its operations, which allows for superior dividend distribution power and helps with keeping a stronger balance sheet.
The Business
One might have been concerned earlier this century that Visa could face heavy obstacles, given the fast-changing technological environment brought about by the worldwide mainstream adoption of the internet. Payment through digital devices rather than credit cards, and later, digital currencies, threatened to render traditional financial intermediation services such as Visa obsolete, from a pessimistic perspective.
The reality, however, is that the company has maintained a strong strategic position in both those areas and has managed to deliver consistent and high growth over the years. Payments through mobile devices continue to be made with Visa cards, as well as payments from crypto wallets. Visa has also declared a focus on new flows of payments and value-added services as part of its strategy, showing that it maintains the same growth mindset.
Visa Investor Relations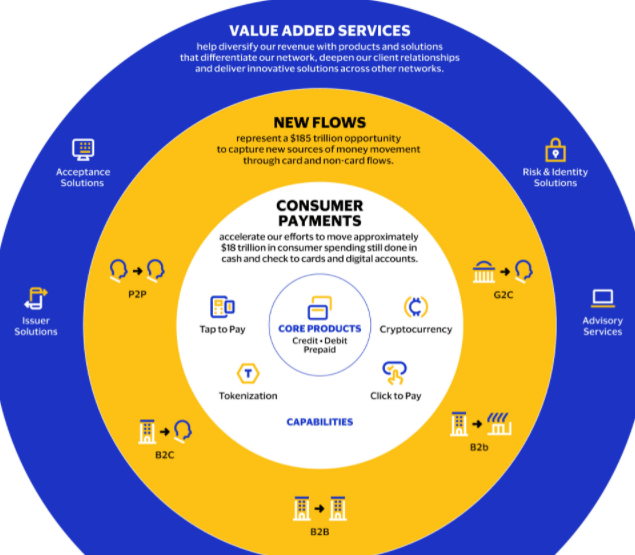
Growth
I have already discussed Visa’s growth strategy for the last years and its sustainability. Now I am going to explore the revenue trend in numbers and what we can extrapolate from it going forward. Taking yearly revenues from 2013 to 2021, I have made two trendlines, one including the last two years, 2020 and 2021, in blue, and the other including only until 2019, in orange.
Author’s work. Millions of USD
Both trendlines are exponential, which means they express a constant growth rate. The orange trendline describes a yearly growth rate of 9.45% and the blue one a yearly growth rate of 8.10%. I think the likeliest scenario is a transition back to the orange line, but either case promises a long-term growth close to the double digits.
Profitability
Moving on to profitability, I am going to keep things simple and plot the GAAP Net Income figure as a percentage of revenues for the last 10 years:
Author’s work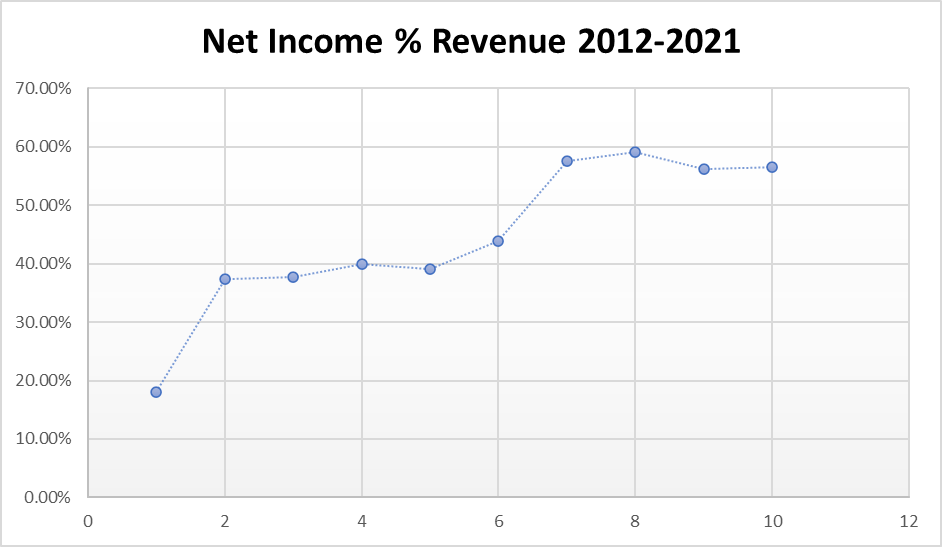
As you can see, although the margin has grown a lot over the years, it has not done so in a consistent way. There have been two main jumps, one in 2013 and one between 2016 and 2018. Because profitability increase is limited by nature, I am going to err on the side of caution and assume for calculations that it has reached its limit at the 58% level reached in 2021.
Dividend
After having established what I think is a reasonable expectation for Visa’s earnings going forward, there are two more things to consider as we move on to dividends. One is the conversion of earnings to dividends without weakening the balance sheet, and this depends on cash generation. Since cash flow is strong and growing faster than earnings, I am assuming that there will be no problem growing dividends by at least as much as revenue, with some margin to grow them faster for a limited time, as we have seen in the last years.
The other thing to consider is that Visa not only hands out dividends but also buys back shares each year. If we look at the following chart, you can see approximately what pattern the reduction in the number of shares has followed.
Author’s work. Millions of shares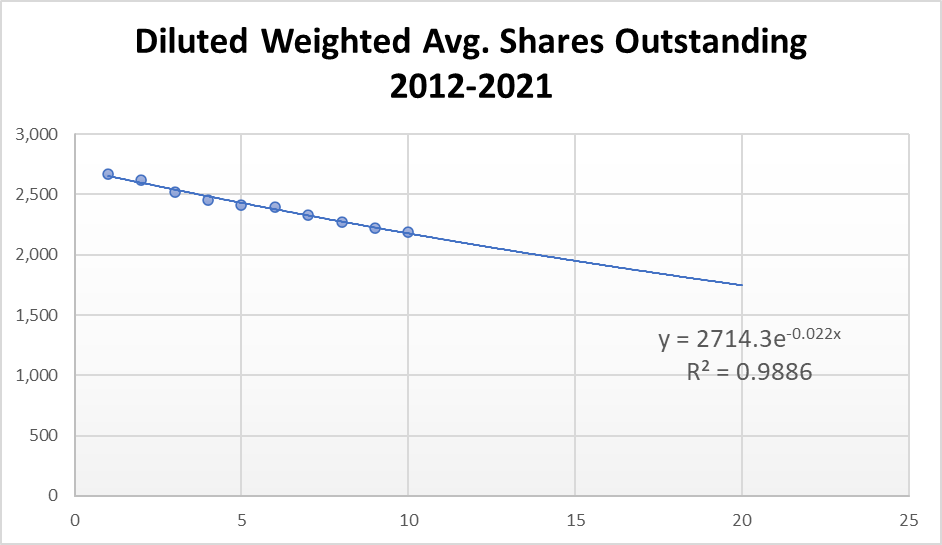
The trendline above estimates a decrease in the number of shares by 2.18% each year. With a dividend payout ratio of 22% and a strong cash flow relative to earnings, there should be no problem continuing along this path without taking a toll on the balance sheet, unless shares get too expensive, which is not something anyone with a long position should be too worried about.
Visa’s dividends have had extraordinary growth over the last years (18% CAGR over the last five years and 23% over the last ten), although it is true that the rate has been decreasing. There are two basic ways that dividends can increase at a higher rate than the company is growing. One is to increase profitability, and the other is to increase the payout ratio. Naturally, both of these are limited. Ultimately, a sustainable indefinite dividend growth rate will be limited to a sustainable indefinite revenue growth rate. As I have explained above, I estimate this rate to be somewhere between 8% and 9.5%.
The following table shows how the dividend yield would evolve, after accounting for an average inflation rate of 2%, for an investor who purchased shares today at $225 if the dividend per share grew at an annual rate of 10.5%. This 10.5% is the result of accounting for the lower range of my long-term sustainable growth estimate (8.1%) and my estimated rate of decrease in the number of shares of (2.18%).
|
Year |
Dividend per Share |
Yield |
Discounted yield |
Discounted yield after reinvestment* |
|
2022 |
$ 1.50 |
0.67% |
0.67% |
0.67% |
|
2027 |
$ 2.47 |
1.10% |
1.00% |
1.03% |
|
2032 |
$ 4.08 |
1.81% |
1.49% |
1.58% |
|
2037 |
$ 6.73 |
2.99% |
2.22% |
2.42% |
|
2042 |
$ 11.11 |
4.94% |
3.32% |
3.72% |
|
2047 |
$ 18.33 |
8.15% |
4.96% |
5.71% |
|
2052 |
$ 30.23 |
13.44% |
7.42% |
8.76% |
|
2054 |
$ 36.94 |
16.42% |
8.71% |
10.39% |
Source: Author’s work. All figures are forecasted. *Assuming all dividends are reinvested in shares which appreciate at a 10.53% yearly rate.
This is a speculation that goes many years into the future, and things could change along the way, but I believe that none of the criteria used in the forecasts are particularly optimistic, and it can give you an idea of what kind of yield the company can offer you just through dividends in the distant future.
Takeaway
In conclusion, I don’t think Visa is overvalued. While I don’t see the price skyrocketing, it is a household brand with a solid balance sheet, with sustainable growth, and very profitable. It is highly likely to increase in price well above inflation over long periods of time.
Looking at the long term and taking a more safety-oriented perspective, Visa can also become a high-yield dividend investment, depending on when you plan to start cashing in. Price increases will likely keep dividend yields low, but if held over a long period of time, I believe this stock will provide high yield, making it suitable for retirement-focused investments.
Be the first to comment