

Pgiam/iStock via Getty Images
Investment Thesis
Big money moves markets, but not always permanently. With active and evolving communications technology there is almost always TMI – – too much information. Some, lacking credibility, can mislead even if that’s not the intent.
The sorting key is comparisons. But they must be of like features, ultimately winding up in their impact on coming market prices for specific investment issues.
We find volume trade orders by institutional investors have high credibility, are current, and provide good comparability when viewed through the active screen of derivative securities markets. The specific reasoning behind trade orders does not have to be evident when substantial costs are undertaken to protect market-makers in their implementation when Billion-dollar portfolios are to be adjusted.
It turns out that the limits of coming price change expectations provide dynamic measures of specific stock changes in reward~risk balances, which in turn offer active investment guidance to portfolio management. Guidance which is usually ignored by passive-investing buy&holders.
Today’s example is in Vicor Corporation (NASDAQ:VICR).
Description of the Subject Company
Vicor Corporation, together with its subsidiaries, designs, develops, manufactures, and markets modular power components and power systems for converting electrical power in the United States, Europe, the Asia Pacific, and internationally. The company offers a range of brick-format DC-DC converters; complementary components; and input and output voltage, and output power products, as well as electrical and mechanical accessories. It also provides custom power systems solutions. The company serves independent manufacturers of electronic devices, original equipment manufacturers, and their contract manufacturers in the aerospace and aviation, defense electronics, industrial automation and equipment, instrumentation, test equipment, solid state lighting, telecommunications and networking infrastructure, and vehicles and transportation markets. Vicor Corporation was incorporated in 1981 and is headquartered in Andover, Massachusetts.”
Source: Yahoo Finance
Yahoo Finance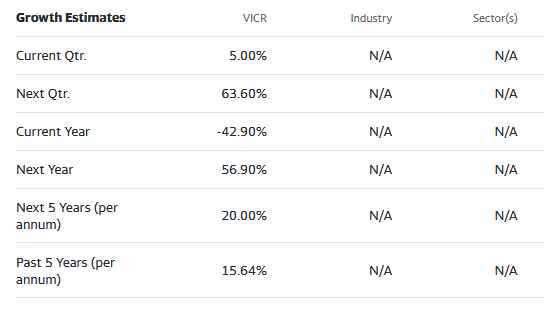
These estimates are offered by sometimes-less well-informed “street analysts” and benefit from comparative data from analysts employed by or serving “institutional investment” organizations and Market-Making volume-transaction trade firms.
Risk~Reward Comparisons of Equipment Producer Stocks
Figure 1
blockdesk.com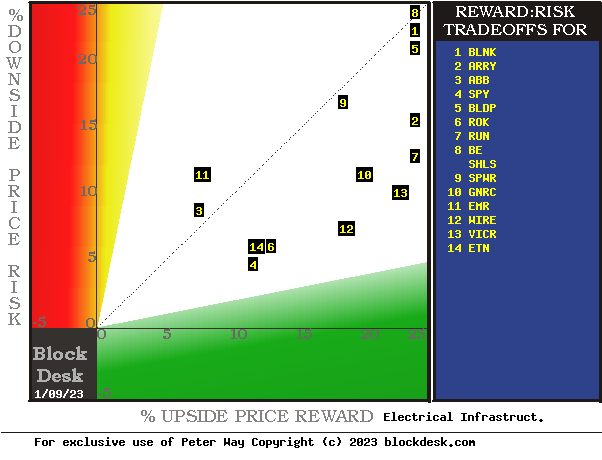
(used with permission)
The tradeoffs here are between near-term upside price gains (green horizontal scale) seen worth protecting against by Market-makers with short positions in each of the stocks, and the prior actual price drawdowns experienced during holdings of those stocks (red vertical scale). Both scales are of percent change from zero to 25%.
The intersection of those coordinates by the numbered positions is identified by the stock symbols in the blue field to the right.
The dotted diagonal line marks the points of equal upside price change forecasts derived from Market-Maker [MM] hedging actions and the actual worst-case price drawdowns from positions that could have been taken following prior MM forecasts like today’s.
Our principal interest is in VICR at location [13]. A “market index” norm of reward~risk tradeoffs is offered by SPDR S&P500 index ETF at [4].
Those forecasts are implied by the self-protective behaviors of MMs who must usually put firm capital at temporary risk to balance buyer and seller interests in helping big-money portfolio managers make volume adjustments to multi-billion-dollar portfolios. The protective actions taken with real-money bets define daily the extent of likely expected price changes for thousands of stocks and ETFs.
This map is a good starting point, but it can only cover some of the investment characteristics that often should influence an investor’s choice of where to put his/her capital to work. The table in Figure 2 covers the above considerations and several others.
Comparing Alternative Investments
Figure 2
blockdesk.com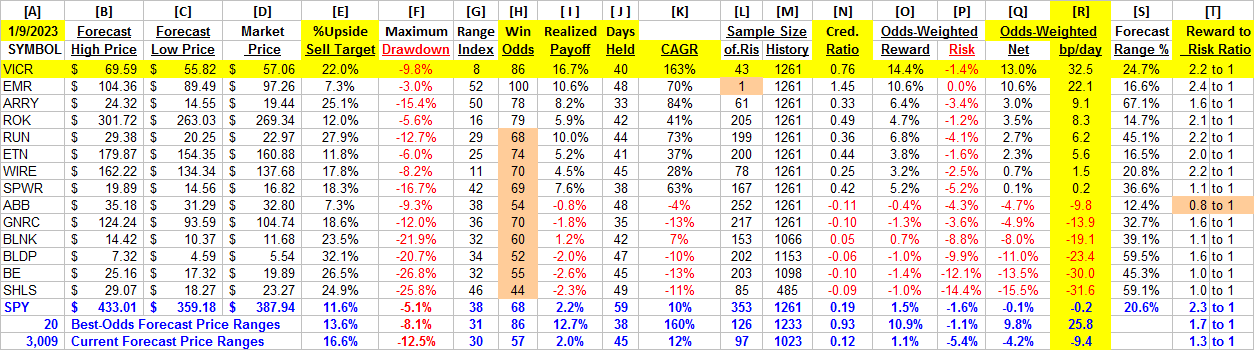
(used with permission)
Why do all this math?
Figure 2’s purpose is to attempt universally comparable answers, stock by stock, of a) How BIG the prospective price gain payoff may be, b) how LIKELY the payoff will be a profitable experience, c) how SOON it may happen, and d) what price drawdown RISK may be encountered during its holding period.
Readers familiar with our analysis methods after quick examination of Figure 2 may wish to skip to the next section viewing Price range forecast trends for VICR.
The price ranges of Figure 2 implied by the day’s transactions activity are in columns [B] and [C], typically surrounding the day’s closing price [D]. They produce a measure of risk and reward we label the Range Index [G], the percentage of the B to C forecast range which lays between D and C.
Today’s Gs are used for each stock’s past 5-years of daily forecast history [M] to count and average prior [L] experiences. Fewer than 20 of Gs or a shorter history of Ms are regarded as statistically inadequate.
[H] tells what percentage of the L positions were completed profitably, either at range-top prices or by market close above day after forecast close price entry costs. The Net realization of all Ls is shown in [ I ].
[ I ] fractions get weighted by H and 100-H in [O,P, & Q] appropriately conditioned by [J] to provide investment ranking [R] in CAGR units of basis points per day.
The pink cell highlighting provides fatal investment evaluation conditions for several candidates, occasionally including the market-index ETF SPY. Additional market perspective is provided by the 3,000+ securities for which price range forecasts are available. They currently suggest that while market recovery is under way, it is still far from generally attractive.
On the other hand, R column scores for VICR and the top 20 forecast population support the primary candidate’s competitive capability and notes the presence of several other demonstrated prospects.
Recent Trends of PriceRange Forecasts for VICR
Figure 3
blockdesk.com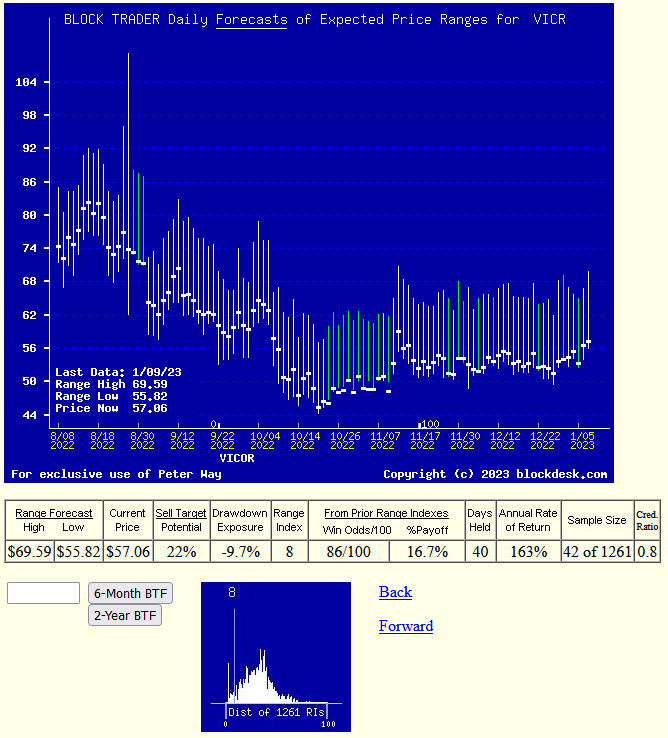
(used with permission)
This picture is not a “technical chart” of past prices for VICR. Instead, it is the past 6 months of daily price range forecasts of market actions yet to come in the next few months. The only past information there is the closing stock price on the day each forecast was made.
That data splits the price range’s opposite forecasts into upside and downside prospects. Their trends over time provide additional insights into coming potentials, and helps keep perspective on what may be ahead.
The small picture at the bottom of Figure 3 is a frequency distribution of the Range Index’s appearance daily during the past 5 years of daily forecasts. The Range Index [RI] calculation tells how much the downside of the forecast range occupies of that percentage of the entire high to low price range each day, and its frequency suggests what may seem “normal” for that stock, in the expectations of its evaluators’ eyes.
Here the present level is near its infrequent, lowest-cost presence, encouraging the acceptance that we are looking at a realistic evaluation for VICR. With nearly all past RIs above the present RI than below there is ample room for an even more positive outlook.
Investment Candidates’ Prior Profitability Prospect
Figure 4
blockdesk.com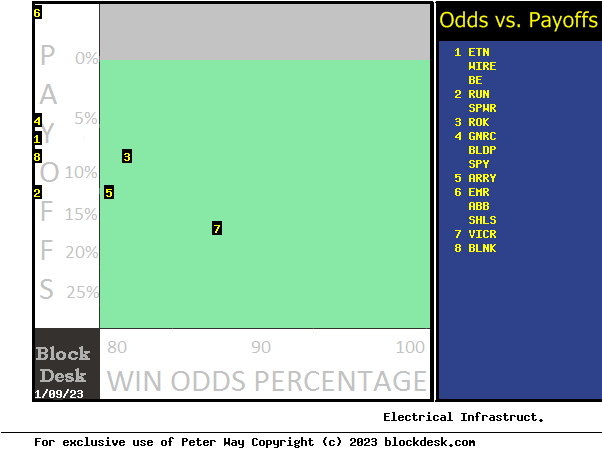
(used with permission)
This comparison map uses an orientation similar to that of Figure 1, where the more desirable locations are down and to the right. Instead of just price direction, the questions are more qualitative: “how big” and “how likely” are price change expectations now?
Our primary interest is in VICR’s qualitative performance, particularly relative to alternative investment candidate choices. Here VICR is at location [7], the intersection of horizontal and vertical scales of +16.7% gain and +86% assurance (odds of a “win”).
As a market norm, SPY is at location [4] with a +5% payoff and a 68% assurance of profitability. This is an unusual posture for that ETF index most often considered to be an overall image of equities’ valuations.
The turmoil being created internationally by Russia’s invasion of Ukraine is undoubtedly a contributing factor here. SPY at a Range Index of 38 suggests 5/8ths of the prospective price changes for the market ETF may occur to the upside. While the “Odds of a gain” from this level may be 62 out of 100, that is never a certainty and if the gain may be only 5% the overall market offers little support encouragement. And the reach of a market rise to the maximum may be momentary, offering little time or capacity to turn share holdings into cash at the peak.
Conclusion
Among these alternative investments explicitly compared, Vicor Corporation (VICR) appears to be a logical buy preference now for investors seeking near-term capital gain.
Be the first to comment