

utah778/iStock via Getty Images
Dear Fellow Investors,
For the twelve months ended 31 December 2021 (CY21), VGI Partners Global Investments Limited (ASX: VG1) generated a net return of -2.5%. VG1’s post-tax Net Tangible Assets (NTA) per share stood as at $2.34 as at 31 December 20211. This is a very disappointing result and has been driven by select core long-term investments performing poorly over the second half of calendar 2021. Nonetheless, we have taken advantage of depressed prices in key portfolio positions to add to our existing holdings and build new positions in businesses we believe will deliver attractive returns to the portfolio in the years ahead.
We continue to focus on owning great businesses exposed to a long runway of secular growth that are attractively priced, based on our assessment of fair value. At writing, on our estimates, our Top 10 holdings are trading at 70-75 cents on the dollar with some holdings trading below 50 cents, and we believe our valuations are conservative. Our Top 10 Holdings represent approximately 74% of total portfolio capital.
Our long portfolio is predominately made up of high-quality compounders that operate within favourable industry structures. Alongside these are a series of businesses that are earlier on in their evolution, but where we see great potential in the years ahead. We believe these businesses have a unique opportunity to grow, enhance their moats and thus evolve into high-quality growth compounders. This was the case with Amazon when we first purchased it in 2014 – it was not viewed as a high-quality compounder with its ongoing heavy investments (and associated prima facie accounting losses), yet looking a few years out we could see a profitable trajectory for its core e-commerce business while many market participants only saw losses. Interestingly, today we see several situations in the digital business landscape where high- quality businesses are very attractively priced based on our estimates of future earnings growth. We touch more on this later in the letter.
We observed some striking market dynamics during 2021, which included an incredible dispersion of stock returns. Certain parts of the market, such as COVID winners and “unprofitable” technology2, experienced significant valuation pressure. Market indices ended the year at their highs (before selling off in January at writing) but looking underneath the surface paints a different picture – for example, key US indices (namely the S&P 500 and Nasdaq) have largely been held up by mega cap technology and a handful of other businesses which have witnessed substantial multiple expansion coupled with strong earnings growth. The top five winners in the Nasdaq-100 (Microsoft, Apple, Alphabet, Nvidia and Tesla) contributed two-thirds of the overall Nasdaq 2021 return of +27% and excluding these five the Nasdaq would have instead generated a +9% return in 2021. Furthermore, over a third of the ~3,600 companies in the Nasdaq Composite are down by well over 50% from their 52-week highs. It is here where we see a number of opportunities rising to the surface.
“Unprofitable” technology had a particularly poor period of performance over the second half of 2021 and this has flowed into 2022. Pockets of exuberance that we witnessed earlier last year have washed out with the prospect of rising inflation and higher interest rates. This has led to a significant de-rating of growth stocks especially those securities that lack earnings or free cash flow. For example, we saw this having an outsized impact on new IPOs. The chart below encapsulates this dynamic, showing the divergent performances between large tech (the Nasdaq-100) and “unprofitable” technology. This has created some attractive opportunities but has also caused some of our key holdings, like Pinterest and Qualtrics, to perform poorly; in addition our longer tail of smaller positions was also caught up in this sell- off, which we discuss in more detail later in the letter.
Non-Profitable Tech Stock Index in 2021 vs the Nasdaq-100
Source: Bloomberg, Goldman Sachs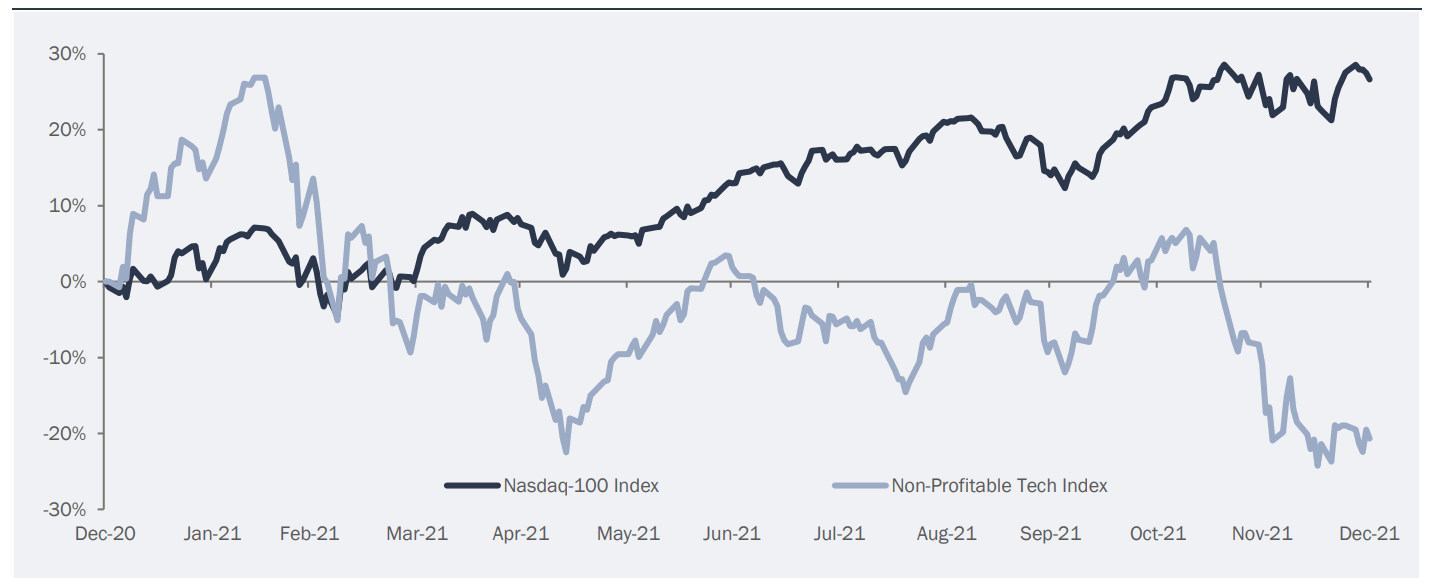
Note: The Non-Profitable Tech Index is a market value weighted index based on a Goldman Sachs basket of 60 non-profitable US-listed tech companies.
Related to this dynamic has been the increasing market concentration amongst large tech companies. FANGMAN (Facebook, Apple, Nvidia, Google, Microsoft, Amazon, Netflix) now account for 25% of the S&P500, up from just 15% three years ago. Most large tech companies had stellar years, with Alphabet (Google) +65%, Microsoft +52% and Apple +35% (the only company to disappoint was Amazon, which frustratingly is also the only one we own). Some of these FANGMAN performances have been underpinned by material multiple expansion, which seems unlikely to sustain itself. In fact, during January 2022, we have already seen some sharp declines in FANGMAN constituents. It is possible we are seeing a “Nifty Fifty” scenario emerge as per the 1960s (where the Top 50 US stocks entirely drove market returns) with the current case being rather different given the narrow skew to mega tech and assortment of other household name mega caps.
We observe we are in a market that is willing to pay stark premiums for stocks that have strong historical visibility and perceived predictability of earnings while companies deemed to have lower predictability are being heavily penalised. Beyond mega cap tech, we are seeing other pockets of “blue chip” securities where valuations are head-scratching. For instance, in the consumer goods space, companies such as Nestle and PepsiCo are trading at all-time high multiples. These are solid businesses, but they have limited ability to reinvest capital at high rates of return and are entering a period of having to rely on price increases to offset inflationary cost pressures in order to maintain their margins. Despite this, these securities are trading at free cash flow yields comparable to other digital businesses that have durable growth and the ability to reinvest large amounts of capital into their business. More broadly, after the recent investor “rotation” out of growth securities, we believe many ordinary, analog businesses look outright expensive whereas many advantaged tech-enabled businesses and many of tomorrow’s future winners look highly attractive.
Amazon’s share price performance has suffered because it has less predictability of earnings in the short term and continues to reinvest heavily. We like the fact that Amazon is continuing to invest aggressively and remains focused on deepening and widening its moat, and therefore we remain highly optimistic about the trajectory for the business. On top of this, there are concerns that Amazon is facing headwinds in the near term due to the pull-forward in e-commerce during COVID. We are less concerned about this given our focus on the longer-term trajectory of the business and the inevitable secular growth in e- commerce and cloud penetration. Nonetheless, the fact that Amazon’s share price was flat during 2021 was a key drag to our portfolio returns (Mastercard, one of our other key holdings at 9%, was also flat). While disappointing, particularly when many other securities performed so strongly, we accept that this is the nature of running a concentrated portfolio – we simply cannot pick the precise timing nor magnitude of individual stock returns over a discrete time period. Nonetheless, we do expect both Amazon and Mastercard to contribute strongly to portfolio returns over the years ahead and we believe the probability of this has increased after recent price action, especially given the continued strong underlying business performance and secular growth drivers.
Our approach is bottom-up and focused on identifying high-quality businesses with a long growth runway and ability to reinvest capital into their business at attractive rates of return.
As we have discussed in previous letters, our investment approach is bottom-up and focused on identifying high-quality businesses with a long growth runway coupled with the ability to reinvest capital into their business at attractive rates of return. This philosophy leads us to businesses that tend to have pricing power (such as Richemont in super luxury jewellery and watches and SAP in enterprise solutions) or have pricing models based on a take-rate or ad valorem model (such as Mastercard in payments and Amazon in e-commerce/advertising), meaning that the businesses we own are generally shielded from inflationary pressures. We also have a large position in the CME Group (~8% weighting), which we have owned in VGI Partners’ global strategy since 2008. We believe CME will be a major beneficiary in an inflationary environment due to its monopoly position on trading US interest rates futures (CME volumes should grow substantially in an environment with higher interest rate volatility) and key commodities.
Nonetheless, thinking about inflation and the outlook for its trajectory is very important for all investors as it is a key determinant in valuing a future stream of business cash flows. The question today is, are we currently seeing a transitory, supply-induced inflation spike that will normalise beyond COVID before deflationary forces such as technology and automation resume putting downward pressure on inflation, or are we in an environment with more persistent inflation driven by shortages in labour, materials and housing? While we do not presume to have an answer, this question has important ramifications for discount rates and multiples, which in turn impact the valuations of our holdings and prices we are willing to pay for new holdings. Our approach involves stress testing valuations so that we are comfortable owning a business even if there is a 100bps to 200bps change in discount rates.
As per our previous letters, we have been shifting the portfolio away from capped upside in lower growth, analog world businesses. We are thus gradually moving away from businesses with lower, albeit more predictable, growth where in many cases valuations are relatively high (especially in terms of price for growth), and allocating more of our portfolio towards structural growth (that is in some or perhaps most cases, under-appreciated or even camouflaged) and where the price for growth is highly attractive.
Albeit not a pure digital world example, the large outperformance of Richemont over other luxury stocks over the last 12 months is a good example – Richemont had hidden value through its loss-making online business and under-appreciated growth within jewellery compared to say LVMH, which was viewed as the consensus quality player in the luxury sector. Over time, we believe that the companies that possess less obvious growth (and are therefore underappreciated by the market) but have inherently high-quality business models and industry structures, will outperform today’s consensus quality/growth stocks.
We are excited by the current opportunity set in global listed markets especially digital businesses in the sub US$50 billion market capitalisation region – a zone which, as discussed above, has come under considerable valuation pressure over the past 3 to 6 months. This suggests that M&A activity is likely to gain momentum given the war chests that many corporates and private equity funds are holding (at writing, the bid by Microsoft for Activision reiterates this view).
Today, we see many companies we greatly admire that are deemed “loss-making” and being sharply marked down. Many of these companies choose to be loss-making in the short to medium term purely because these companies are not optimising their revenue algorithm (they are biding their time as they build their business flywheel) and they are simultaneously aggressively over-investing in their business via operating costs, namely research & development and sales & marketing.
The ongoing sell-off in digital/technology companies, especially “loss-making” companies, is creating substantial opportunities for those who are genuinely long-term investors and are able to withstand short- term price volatility or, as some say, a capacity for investing pain (that is, being able to withstand a stock halving over a 12-month period and not get bluffed out, due to the conviction in your analysis). A capacity for investing pain is required to then experience the satisfaction of seeing, often when there is conviction in the analysis, the same security recover rapidly and move to new highs.
As far back as 2014, when we first bought Amazon, we have been asked: why do you invest in loss-making companies? Amazon was a “loss-making” company for many years. The reality was that it did not make losses due to a flawed business model – rather its management simply chose the long game and thus constantly reinvested in the customer experience and the business itself. This investment came through the profit and loss statement via foregoing certain revenues (for example via a low initial Amazon Prime fee) or growing operating costs via high rates of research and development.
Similarly, today we see many companies we greatly admire that are deemed “loss-making” and being sharply marked down. Many of these companies choose to be loss-making in the short to medium term purely because their management teams (usually led by founders with large equity ownership) are not optimising their revenue algorithm (they are biding their time as they build their business flywheel) and they are simultaneously aggressively over-investing in their business via operating costs, namely research & development and sales & marketing. If these line items were treated the same way as an analog business treats its investment in physical improvements to say a factory or manufacturing equipment – it would be via capex and thus capitalised on the balance sheet only to be depreciated in the years ahead – and “accounting profits” would ensue. The overall point being that camouflaged quality can come in many forms and we are searching for those attributes and trying to assess the long-term free cash flow generation such a business can produce.
Today we own a handful of smaller size investments in our portfolio that are at earlier stages of their growth phase but we think will develop into extremely durable business franchises with favourable industry structures and unit economics. Some of these businesses are already generating free cash flow while others do not. These positions were a drag to performance in the second half of 2021, as they are generally in the technology space – nonetheless we remain confident in the long-term prospects of the businesses and are therefore willing to tolerate volatility near-term and believe they will deliver meaningful returns to the portfolio in the years ahead. In most cases we have taken advantage of share price weakness to make additional purchases. We believe many of these holdings will prove to be the future compounders for the portfolio and be worth multiples of their current valuation. We will continue to allocate a portion of the portfolio to smaller weightings in businesses that we believe can be future multi- year winners.
As aforementioned, for the twelve months ended 31 December 2021 (CY21), VG1 generated a net return of -2.5%. VG1’s post-tax Net Tangible Assets (NTA) per share stood at $2.34 as at 31 December 2021. For reference, the MSCI World Total Return Index (AUD) of +28.8% over the same period.
Since inception in September 2017, VG1 has generated a net return of +26.4% after all fees. This represents a compound annual net return to investors of +5.7% over this period with a net equity exposure of 59% (compared to 100% invested for the index). As we have highlighted in prior letters, we took a cautious approach when getting invested in the initial years of the portfolio, which was a negative drag on performance.
Portfolio Update
Below we provide an update on some of our key holdings.
Current Portfolio
The table below shows our Top 10 holdings as at 31 December 2021. Consistent with our concentrated approach, the top 10 holdings account for 74% of our total capital.
|
Top 10 Long Investments as at 31 December 2021 |
% of Portfolio |
|
Amazon.com Inc. |
16% |
|
Cie Financière Richemont SA |
9% |
|
Mastercard Inc. |
9% |
|
CME Group Inc. |
8% |
|
SAP SE |
7% |
|
Olympus Corporation |
7% |
|
Pinterest Inc. |
6% |
|
Qualtrics International Inc. |
5% |
|
Française des Jeux |
4% |
|
IAC/InterActiveCorp |
3% |
Source: VGI Partners analysis.
Pinterest (NYSE: PINS) ~6% weighting

Pinterest is a holding we have discussed in detail previously but, given it was the largest portfolio detractor in 2021, we believe it warrants a detailed update.
We continue to believe Pinterest is a unique visual search engine with its ~450 million monthly active users (MAUs), and is a highly differentiated platform, uniquely combining search with the network effects of a social media platform.
Most users visit the platform with a specific purpose and typically use the platform for inspiration. Compared to other social networks, purchase intent is high, with approximately 55% of Pinterest users on the platform there to find or purchase products or services. The high purchase intent of the user has made Pinterest an increasingly attractive place for brands to advertise – it is arguably the only platform where advertisements do not damage the user experience and in fact improve it (arguably alongside Google). It also happens to be a relatively safe space to advertise online, with minimal to no abusive or controversial content present on the platform.
This has resulted in significant improvement in monetisation, with revenues growing by over 5 times since 2016 and by almost 50% in both 2020 and 2021. Notwithstanding this, the stock has performed poorly over the last 12 months due to user growth coming to a halt. As users were locked down at home during COVID outbreaks, Pinterest benefited from rapid growth in engagement, for instance users stuck at home looking for inspiration on a home renovation. On the other side of lockdowns, some of Pinterest’s more casual users have returned to normal routines and reduced their usage of the platform.
We believe the market is overly focused on a small, and what appears to be temporary, slowdown in Pinterest’s user growth. Ultimately, we believe Pinterest is different to other social media platforms like Facebook, Instagram, Snapchat and TikTok, all of which thrive on daily users effectively addicted to each platform. Pinterest on the other hand is, for the most part, not a habitual platform, therefore some of the casual users that were introduced to Pinterest during the last 12 months have stopped using the platform (and most of these have been web-based PC users, which are a lot less valuable to advertisers than mobile users). More importantly, we are encouraged that millions of new users tested the platform as we think in the future, when these consumers are looking for their next purchase or project, they are more likely to return to Pinterest.
Key Pinterest Metrics
Source: VGI Partners analysis.
Over time, Pinterest also has a unique opportunity to tap further into a clear e-commerce opportunity. Pinterest has rolled out a native checkout button and a Shopify partnership to allow users to make purchases directly on the Pinterest app. Pinterest is also in the process of rolling out features to improve the experience for merchants, for example they now have an application interface to allow merchants to fully upload their catalogues to Pinterest. This initiative is at early stages, but we are excited about the potential.
At writing we are extremely surprised that Pinterest has fallen to US$30 (an enterprise value of US$18bn), particularly when there has been speculation of multiple takeover approaches over US$70 (an enterprise value of US$50bn) by both Microsoft and PayPal just in the last 12 months. Pinterest is not a loss-making or cash-burning business (a common misconception) – rather it is generating significant free cash flow as its margins have scaled very rapidly over the last 12 months, and the stock is now trading on a FY23 free cash flow yield of almost 4% on our estimates, coupled with strong growth prospects. We remain optimistic about the future of the business, its earnings power and thus, the share price upside. We have taken advantage of the recent volatility to add to our position. While it has been a substantial round-trip, which is frustrating, we are around our cost base on the investment and see material upside.
Pinterest Free Cash Flow to Firm (FCFF) (US$m)
Source: VGI Partners analysis.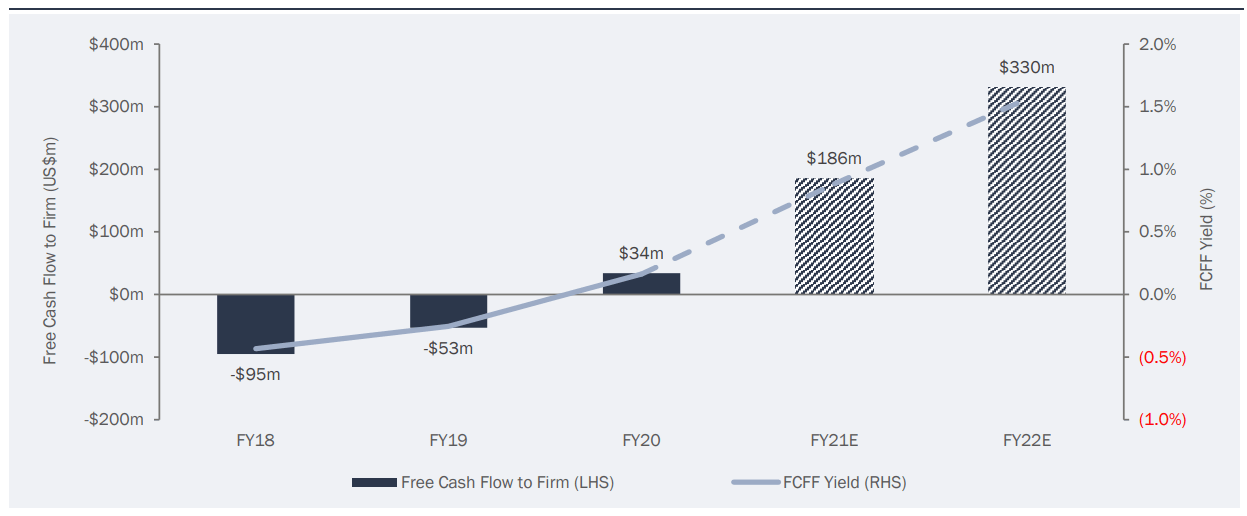
Note: FCFF is tax-adjusted and does not add back stock-based compensation.
Qualtrics (NASDAQ: XM) ~5% weighting

Our analysis shows Qualtrics is the world leader in experience management (EM) software. EM software is a category that has been turbocharged by the pandemic as corporations and governments are striving to better understand their customers and employees in order to improve satisfaction, retention and in turn maximise the dollar return on each customer. Customer experience was previously assessed via surveys and other forms of analog feedback. Today Qualtrics allows its clients to assess their customers’ feedback and improve the experience with more sophisticated tools (e.g. Net Promoter Scores) and in real time via multiple data feeds which include call centre conversations, emails, online chatbots, social media feeds and so on.
A good example of a Qualtrics customer is JetBlue Airlines, a major American low-cost airline. JetBlue use the platform to analyse customer feedback and in turn better tailor pricing for flights and also improve the in-flight experience, in order to expand Net Promoter Scores (NPS) and increase customer retention through this real-time feedback. For example, by combining flight frequency and pricing studies, JetBlue found that 82% of their passengers didn’t care about free bags and instead preferred cheaper ticket prices. JetBlue responded by rolling out different rate structures and pricing options for passengers, which were well received. By taking a deep dive into passengers’ feedback in Philadelphia, JetBlue was able to trace dissatisfaction to the lack of airport shops and amenities open early in the morning, where JetBlue responded quickly by simply passing out water, juice, and coffee at the gate to boost customer satisfaction.
Large corporations are accelerating their usage of Qualtrics software with 85% of the Fortune 100 using the platform. The incremental spend with Qualtrics by existing customers is impressive and continues to grow in excess of 20%. This is underpinned by expanding usage along with the adoption of additional modules which allow clients to gain greater depth and breadth of data from the Qualtrics platform. In addition, new customers add to the growth of existing customers resulting in what we believe will be revenue growth of over 30% p.a. over the coming years.
Qualtrics Revenue (US$m)
Source: VGI Partners analysis.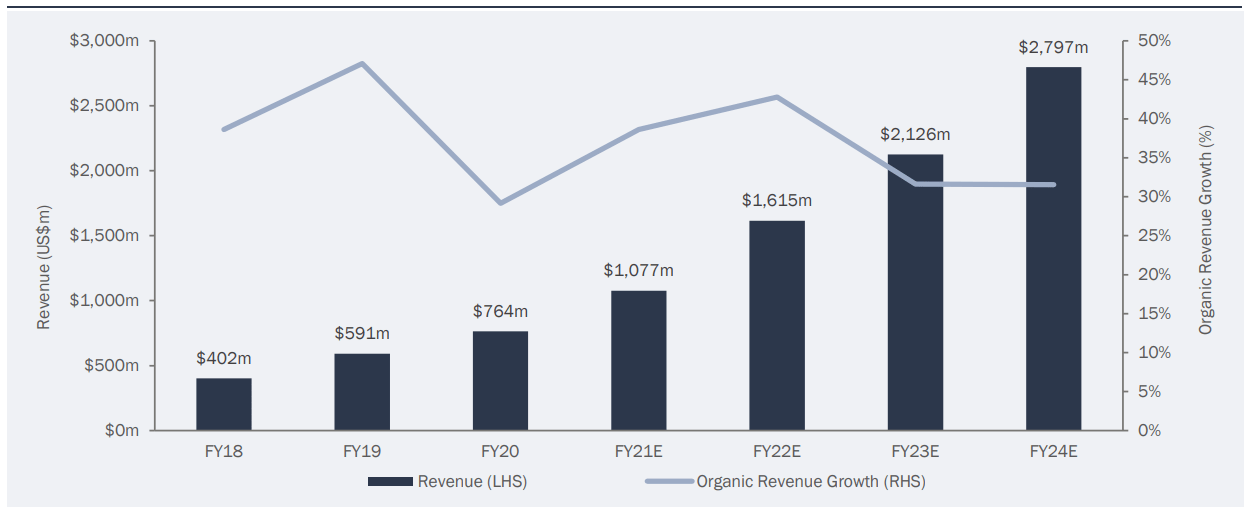
The economics of an enterprise software business like Qualtrics are highly attractive and result in gross profit margins of almost 80%. Qualtrics expenses all R&D and other costs associated with building its platform and capability set – as discussed previously in this letter, if Qualtrics was a manufacturing business many of these business growth costs would be capitalised (expanding its manufacturing facilities, acquiring new plant, land & buildings, etc) allowing costs to be lower and produce optically pleasing accrual prima facie “profits”. We believe Qualtrics is on a fast track to substantially grow earnings and free cash flow as it reaches a tipping point in its cost structure – in our view free cash flow should rapidly accelerate in the years ahead (as seen in the chart below) and we believe the share price will invariably follow.
Qualtrics Free Cash Flow to Firm (FCFF) (US$m)
Source: VGI Partners analysis.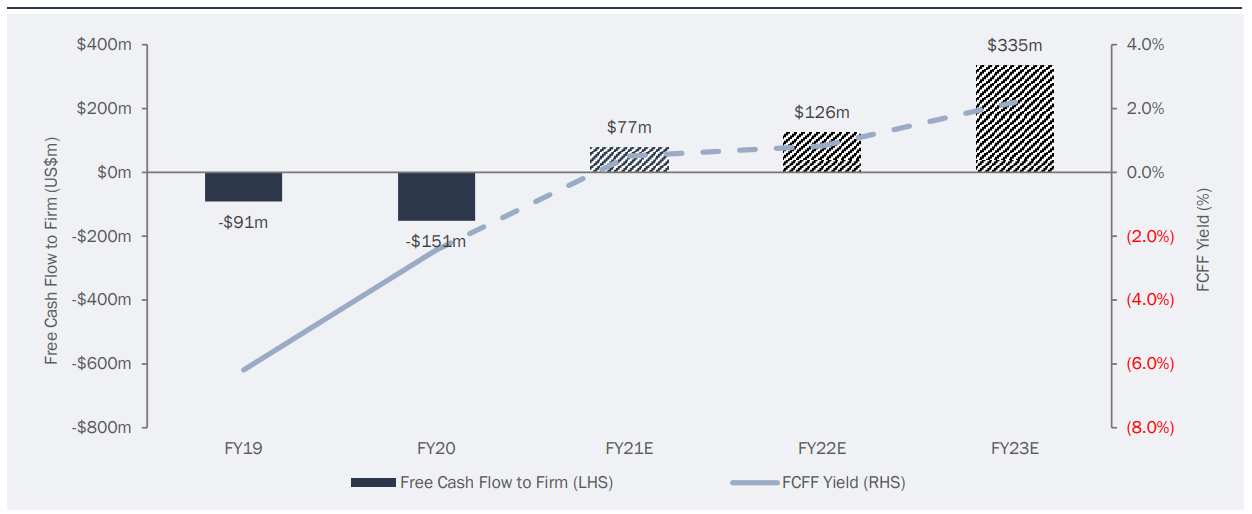
Note: FCFF is tax-adjusted and does not add back stock-based compensation.
Our Qualtrics holding was a detractor to performance during 2021. We have added to our holding recently, including this month, as the stock has sold off further. We deem the business extremely attractively priced on an absolute basis given the growth profile in free cash flow. In our view, the fair value for Qualtrics is materially above the current share price.
Richemont (SWX: CFR) ~9% weighting

Richemont was the largest positive contributor to performance in 2021, delivering a total shareholder return of 75%, and is thus now our second largest position. The business has continued to execute very well, particularly in its core super luxury jewellery segment. Revenues have recovered to well above pre- COVID levels and the lack of travel has not been a drag on luxury spend – in fact a lot of the spend has been repatriated domestically (e.g. Chinese consumers buying Cartier jewellery in China rather than when they travel to New York, London or Paris).
On top of this, operating margins in jewellery reached 38% in the most recent half, the highest level ever achieved. Management did comment these results were exceptional and hinted at the fact that they should not be extrapolated, but it is clear that Richemont has substantial untapped runway for margin improvement.
Richemont Jewellery Segment Revenue and EBIT Margin
Source: VGI Partners analysis.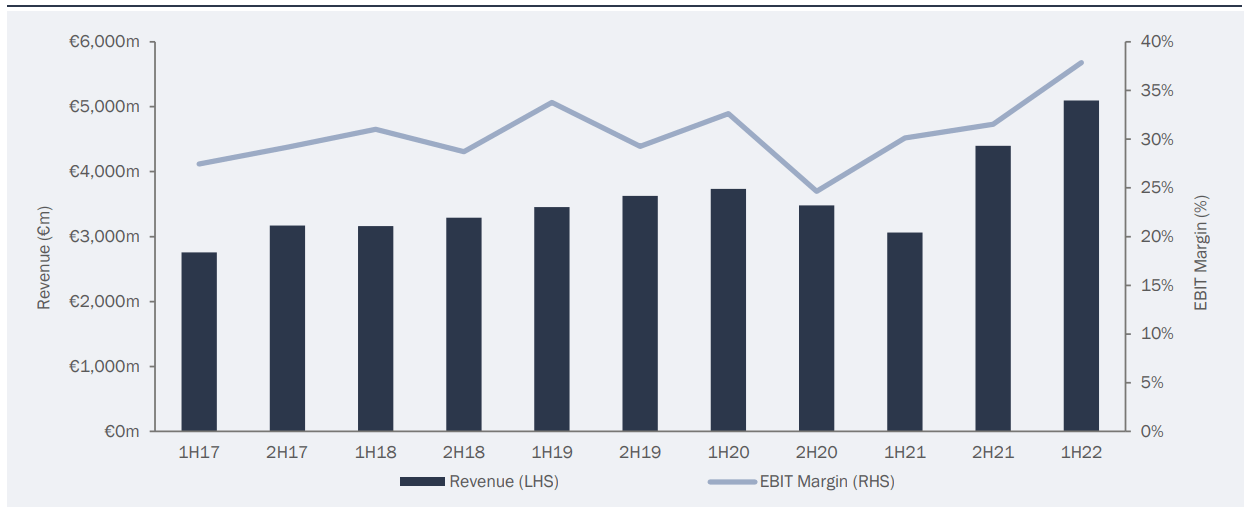
Even Richemont’s smaller watches division (which includes brands such as Panerai, IWC, Vacheron Constantin, Jaeger-LeCoultre, A. Lange & Sohne) has started to turn around after years of underperformance, as Richemont has cleaned up inventory in the wholesale channel, reduced discounting and is now dealing with fewer distribution partners. Management should be applauded that there is now a waitlist for many of Richemont’s watch brands – an incredible transformation for brands that used to be prone to discounting and weak sales.
Another recent and important development was the announcement that Richemont is considering strategic options for Yoox Net-a-Porter (YNAP), its under-performing online division. Richemont are looking at a range of structures, which may involve a deal with Farfetch (a leading luxury e-commerce platform); the intention appears to be broadening the ownership of YNAP to get industry buy-in and position it as the leading luxury e-commerce platform. We are excited by this, as we have long argued that the market was failing to ascribe any value to Richemont’s e-commerce operations (and actually capitalising the losses from this division).
While the market has started to appreciate some of Richemont’s hidden value that we have outlined in prior letters, we continue to see upside and a favourable risk/reward. Richemont is one of those business that ideally we would never sell given its pricing power, long growth runway, upside optionality and aligned, long-term focused family ownership (and is a business that we expect to continue to prosper even in an inflationary environment). Should valuation start to materially exceed our estimate of fair value, we will act promptly to reduce the size of our holding but we still see ample room to surprise to the upside and we are encouraged by the upcoming catalysts to unlock value.
Mastercard (NYSE: MA) ~9% weighting

Mastercard has been a core constituent of the VGI Partners global strategy since 2009. Mastercard is a global payments processor and in an effective duopoly with Visa. The industry benefits from a strong secular trend toward electronic payments over cash and cheques and the COVID pandemic has accelerated this shift.
Mastercard’s share price increased +1% in calendar 2021 despite more than 25% earnings growth. This was due to Mastercard’s market multiple de-rating due to short-term concerns about cross-border volumes and long-term concerns about disintermediation from fintechs such as PayPal and Square (see the chart below showing Mastercard’s EV/EBITDA multiple during 2021 de-rating from >30x to ~26x).
Mastercard EV/EBITDA (Next 12 Months Forward)
Source: Bloomberg.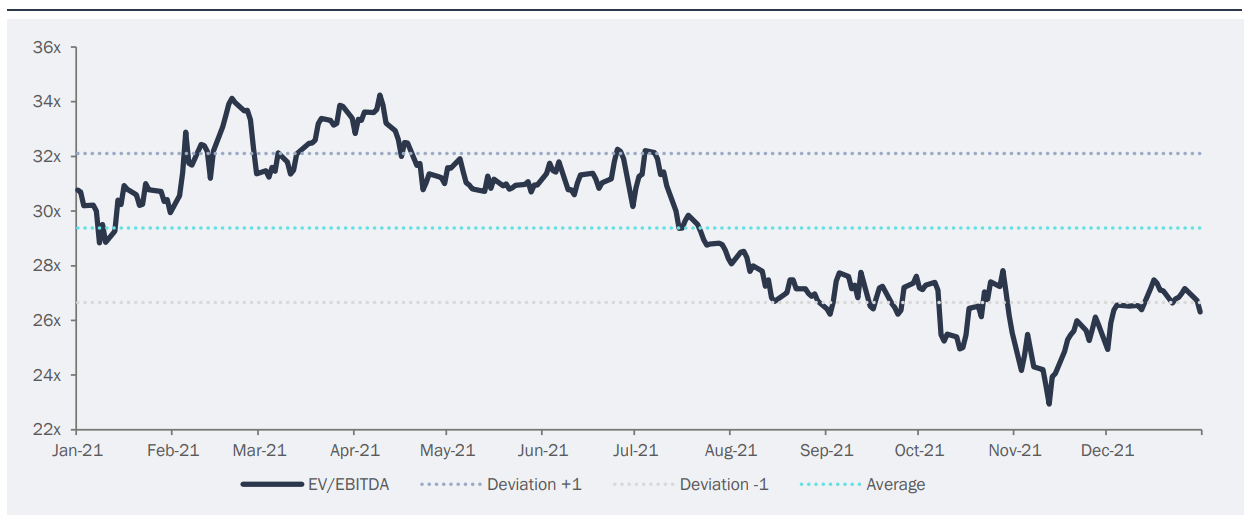
Whilst the full recovery in cross-border travel has been delayed by the onset of Delta and Omicron, we believe there is significant pent-up demand for travel and that cross-border transaction volumes can exceed 2019 levels by 2023. Interchange fees have long been a point of contention between the payment processors and merchants so the news that Amazon UK would no longer accept Visa credit cards rekindled fears that there would be a race to the bottom in merchant discount rates. Amazon and Visa have since come to a resolution and we think it is highly unlikely that other merchants will take a similar step. Nevertheless, we are closely monitoring the situation for further developments.
Back to Mastercard, we believe that fears of fintech disintermediation are misguided. In fact, fintechs accelerate the secular trend toward electronic payments and usually partner with the global payments processors to gain merchant acceptance. Mastercard leads the market in partnering with fintechs winning over 250 new partnership deals with an over 70% win-rate in the US and UK markets in 2021. And for all the fears surrounding Buy Now Pay Later (BNPL), BNPL is a benefit to the networks as the vast majority of BNPL transactions are funded with credit or debit cards.
We conclude that Mastercard’s fundamentals are strong with cross-border set to rebound, underappreciated tailwinds from fintech partnerships, and rapid growth in new services such as cybersecurity and data analytics. We also consider Mastercard as an attractive hedge against inflation – a higher cost of goods purchased will benefit the company’s bottom line as it charges an ad valorem fee and has significant pricing power.
IAC (NASDAQ: IAC) ~3% weighting

IAC is an investment we have held since November 2020. We were attracted to the business because of its excellent management team and impeccable track record. Led by Barry Diller, one of the best capital allocators in recent times, IAC is an investment holding company that is likely unfamiliar to many. Despite this, the businesses that have grown out of IAC, and that have then been spun off to IAC shareholders over the years are likely to ring a bell. These include Expedia, TripAdvisor, Live Nation (formerly Ticketmaster) and Match Group, which operates in the dating vertical with well-known properties such as Tinder. Collectively, IAC has spun-out to its shareholders almost $100bn worth of value over 25 years.
Source: IAC Investor Presentation, June 2021.
IAC has a unique investment philosophy. Unlike other conglomerates or holding companies, IAC prefers to part ways with its businesses once these businesses are able to self-sustain. IAC strives to constantly reinvent itself. Therefore, IAC is very shareholder-friendly and thinks of itself as an anti-conglomerate, where the businesses are regularly spun-out to its shareholders rather than held within one large corporate structure (imagine Expedia, TripAdvisor and Match were all housed under the same entity).
Barry Diller has also introduced a system where talent is identified early, and management is empowered to make mistakes and test rapidly. IAC has been and remains a talent factory and the more we have learnt and studied IAC, the more we have come to appreciate that this unique philosophy and culture is its key moat.
When we first bought IAC, we were essentially not paying anything for its ownership in Vimeo, a Software- as-a-Service (SAAS) provider of video solutions. Given the holding company structure, the assets within IAC are often missed or overlooked by investors until closer to being spun-out, which eventually draws attention to the broader investment community. This was the case with Vimeo, which started to grow rapidly as the tailwinds from COVID lockdowns led to a sharp rise in demand for video solutions. Vimeo was subsequently spun out to IAC shareholders in May 2021. Thus far, Vimeo’s performance has disappointed due to the combination of a growth slowdown and the broader tech sell-off. Nonetheless, we think Vimeo could be in the early days of a multi-year growth opportunity and therefore we have retained the small holding that we received as part of the IAC spin-out. Despite weakness in SaaS securities and the sell-off in Vimeo, we have still made money on our IAC investment.
Historically, a key area of success for IAC has been capitalising on the shift from offline to digital. They were early in identifying this trend, as seen by IAC’s success in categories such as travel (with Expedia/TripAdvisor) and dating (with Match Group). IAC is now attempting to do the same in the home services category with Angi Homeservices, which is one of the main assets owned by IAC today.
Angi is the leading digital marketplace in the US for all types of home renovation and repair jobs. IAC is investing heavily behind this business (which includes the original Angie’s List property) to transition away from being a classifieds lead-generation marketplace, towards a transactional, fixed-price marketplace. Under this model, consumers can instantly book online a home repair job at a known price, thereby providing convenience (instant booking) and price transparency to a process that otherwise involved exchanging multiple quotes with tradies, haggling on price and painfully coordinating calendars.
Angi is having some success with this shift but it is still early days. In the near term, it is facing a particularly tough environment given tight supply conditions, meaning tradies are fully booked for many months in advance. We view this as a temporary bottleneck and that over time, the new proposition will prove superior such that tradies will shift to where the eyeballs are (in this case, Angi). The market is not attributing Angi a high probability of success in their ability to flip the revenue model and become the dominant player in the category. They are already the largest player by far with over 220,000 tradies using the platform. This is also a category that is still at the very early stages of moving to online. Therefore, Angi seems best placed to dominate the category and with IAC’s stewardship and just a US$4bn market capitalisation, we believe that Angi has the potential to be worth many multiples of its current value if it successfully executes on its strategy.
Beyond Angi, IAC has a portfolio of other attractive businesses. One is Dotdash, which owns online properties across a range of verticals such as food, health, investing and entertainment. They recently announced the acquisition of a similar business (Meredith) that is highly complementary at an attractive price and we are excited by the potential of this combination. IAC also owns Care.com, the leading marketplace in the US for finding and booking care-takers. This is another classic IAC category where it can roll out its typical playbook and turn the business into a lasting franchise (Care.com was acquired for just US$500m in February 2020 after a period of mismanagement).
In August 2020, IAC also invested in MGM Resorts just as COVID lockdown concerns were starting to ease. IAC are particularly attracted by the sports betting category and have expressed additional interest in the category, although they have remained disciplined and have yet to allocate further capital given what has been a relatively frothy environment in the sports betting vertical. IAC also own a 25%-30% stake in Turo, which is often referred to as the “Airbnb of cars”. Turo is a marketplace that facilitates car-sharing and where individuals with idle vehicles can place their car on Turo so that drivers can use these vehicles at short notice (effectively as an on-demand alternative to car rentals). Turo has just recently announced that they will IPO in the US, so we look forward to IAC crystallising further value from their investment portfolio.
Beyond these assets, IAC has a tail of earlier-stage investments that are today not being attributed any value by the market and that provide upside optionality should they become larger businesses over time. Since we purchased IAC in November 2020, IAC has generated a return of 41% and 14% when including the Vimeo spin-off. We are excited by the long-term opportunity of IAC itself as well as many of the underlying assets that it owns.
Portfolio Changes
Below we outline some other recent portfolio changes.
We have taken advantage of recent volatility amongst tech securities and added to existing core positions, particularly Pinterest and Qualtrics. We also reinitiated a small holding in Spotify, a business we have owned previously.
We also exited some core holdings during the year. We sold our OTIS position, which has been a strong performer but decided to exit based on valuation coupled with a deteriorating outlook for construction in China. China represents almost 20% of OTIS revenue but an even higher proportion of future growth; in recent months we have started to see some of these concerns play out with multiple signs pointing to a prolonged slowdown in China property construction.
Another divestment over the period was Pernod Ricard which we sold in 3Q21 – this was again driven primarily by the elevated valuation and what we believed to be more attractive opportunities elsewhere. Pernod is a business we will continue to track closely as we do like how it is positioned and how management runs the business.
An additional position that we have exited is Reckitt Benckiser. Overall Reckitt has been a disappointing investment for us and thankfully we sold down part of our holding near its all-time highs in 2020. More recently we sold down our remaining holding – we re-assessed the business moat as shrinking given an inherent deterioration in the industry structure for consumer goods companies, and a key reason why we have chosen to focus our investment efforts away from these kinds of businesses going forward.
Short Selling
Our short portfolio was the single largest detractor during 2021, with a total drag of ~4%. It has not been a favourable environment for our type of fundamental short selling, which is normally based on accounting red flags or identifying structurally challenged industries, particularly in an environment with ongoing multiple expansion across many sectors and businesses.
As we highlighted in our prior investor letter, we temporarily shifted the short portfolio to include more market and portfolio insurance given the rise in meme stocks and sporadic short squeezes. We did so in order to provide downside protection to the portfolio in an environment where speculation was rising and our style of single stock shorting was not working. Nonetheless, these positions have turned out to be the biggest drag to our short portfolio.
We did progressively resume single-stock shorting throughout the year in addition to using baskets to avoid the risk of short squeezes. Logitech, the manufacturer of office and gaming equipment, was an example of a successful short for us during 2021. The business was a large beneficiary of stay-at-home orders which drove a demand spike for home office and video communication equipment as most employees shifted to working remotely. This not only drove a pull-forward of growth, but margins also experienced a step-up due to the lack of promotions. The market started to extrapolate these dynamics as a permanent change in Logitech’s economics, whereas we took the opposite view which has proved closer to reality given a string of disappointing results.
In a similar vein, we currently have a short basket consisting of businesses that have been large beneficiaries of the abnormal step-up in durable goods consumption (e.g. recreational vehicles, power tools, white goods), which in our view, have experienced an unsustainable demand boost in terms of both growth and margins. We are also starting to see weakness emerge in US retail data, which we are watching closely as this will not only impact durable goods categories but also adjacent markets like housing.
US Durable Goods Personal Consumption Expenditure (US$bn, Seasonally Adjusted Annual Rate)
Source: US Bureau of Economic Analysis.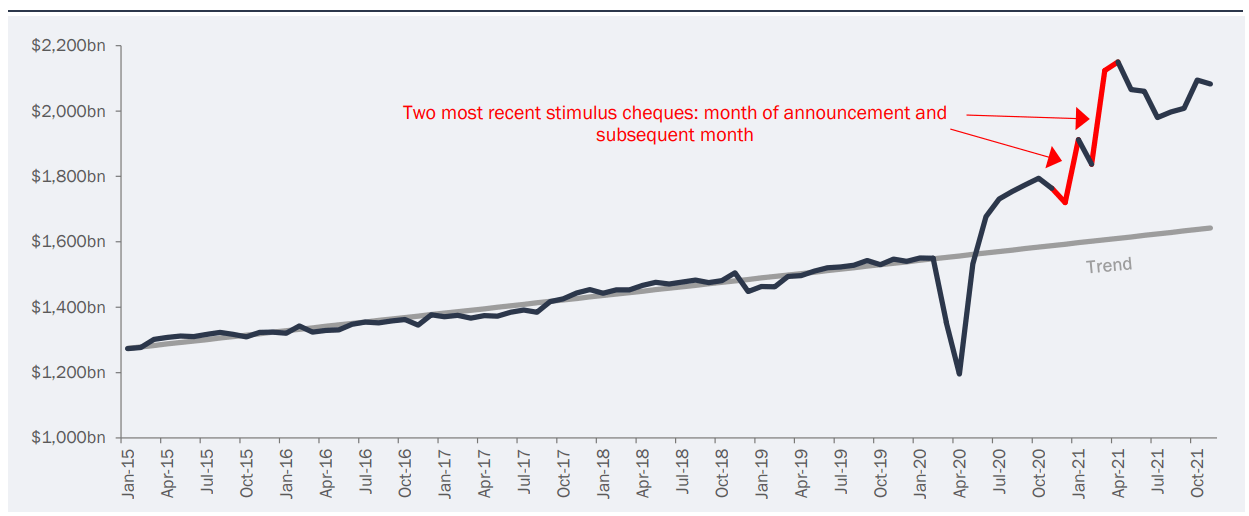
Note: Trend has been extrapolated from 2015 to 2019 actual data.
Late in the year we also had some successes as we continued to adapt our short process. Something that worked well for us was a hand-picked short basket focused on US unprofitable tech companies that were trading on egregious valuations, which contributed positively to returns in 2021 and has continued to do so at the time of writing.
When we founded VGI in 2008 we decided to operate an active short portfolio as we believed it would provide us with a partial hedge to our core long portfolio, while also generating positive absolute returns. We have demonstrated our short selling capabilities over time, generating positive returns in our short portfolio in the years leading up to the COVID outbreak, despite the market increasing substantially over this period.
As we look forward today, we continue to see substantial value in having an active short portfolio. We believe a short portfolio is additive to our analytical abilities and in turn enhances our long-term investing capabilities and returns, in addition to being a valuable risk management tool, which is particularly useful in the current market environment.
Given the growing uncertainty regarding inflation and rising bond yields it may turn out that short selling becomes a larger part of our activities and acts as a core driver of portfolio returns in the future.
Currency
The Fund remains fully hedged to Australian Dollars (AUD).
We may move back to an unhedged or partially hedged position – as we take an active view on the currency – but only when we believe there is a clear mispricing based on our fundamental analysis.
In Closing
We take alignment of interest between ourselves and our investors seriously. We collectively have a meaningful investment in VG1 and continue to add to our investments. As a result, VG1 investors should be confident that our investment team’s energy and effort is focused on a singular outcome – to maximise returns over the long term while preserving capital for our collective portfolio in what is a highly challenging investment environment.
At VGI Partners we are entirely focused on managing our portfolio. Our commitment is to preserve and grow your capital over the long term, regardless of the market environment, by owning a portfolio of high- quality businesses which have been purchased with a margin of safety coupled with a series of businesses that have under-appreciated or even camouflaged quality characteristics.
We cannot eliminate short-term volatility from our returns; however we are more confident than ever that our process and investment philosophy positions our portfolio to produce attractive returns over the long term and through the cycle.
We remain optimistic about our existing portfolio and will continue to take advantage of opportunities that present themselves. We are very grateful that we have long-term oriented investors who entrust us with their capital.
Once again, we thank you for your investment with VGI Partners.
Yours faithfully,
VGI Partners
Be the first to comment