

Oleksii Liskonih/iStock via Getty Images
Author’s note: All figures listed in Canadian currency unless otherwise noted.
Investment Thesis
As the second installment in my series reviewing of Vanguard’s series of Canadian ETFs, I am looking at the Vanguard S&P 500 Index ETF (TSX:VFV:CA). For many investors, buying and holding a low-cost, diversified broad index ETF is one of the best long-term decision one can make. For investors in their accumulation phase, the S&P 500 is an indispensable core component of a diversified portfolio.
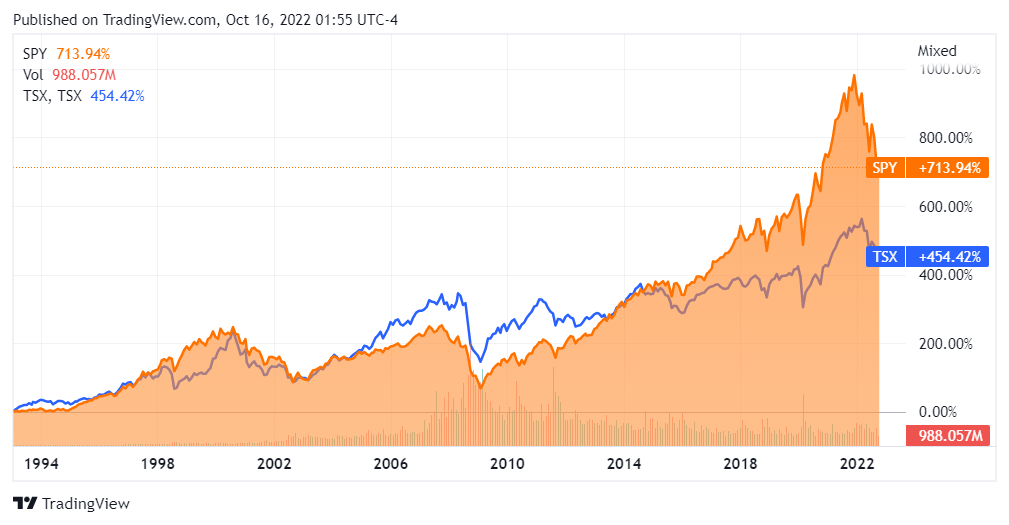
Even if you consider yourself a skilled stock picker, adding an index fund to supplement your portfolio is not throwing in the towel on your DIY strategy. VFV has achieved an average annualized return of 15.33% since the fund’s inception in 2012. This is the equivalent of turning a $100,000 investment in August 2012 into $410,343 today. If your returns haven’t kept pace with that, then it would be worth considering VFV in your portfolio. Canadian investors, in particular, can benefit from holding VFV to add some essential international portfolio diversification and address the pervasive home bias common among Canadian portfolios.
ETF Objectives
VFV’s objective is to track the performance of a broad U.S. equity index that measures the investment return of large-capitalization U.S. stocks. The S&P 500 Index is a market-capitalization-weighted index. Specifically, VFV seeks to replicate the performance of the S&P 500 Index net of fees and expenses. By investing indirectly in stocks, VFV has an error-tracking rate of 0.33% ensuring a very close approximation to the returns of the index. VFV pays a quarterly distribution and has average daily trading volume of approximately 460,000 units.
VFV is the Canadian version of the Vanguard S&P 500 ETF (VOO) offered by Vanguard U.S. VFV is denominated in Canadian dollars and is listed on the Toronto Stock Exchange, while VOO is listed on the New York Stock Exchange and is traded in U.S. dollars. VFV is structured to hold units of VOO, which in turn owns individual stocks directly. For investors based in Canada, there are tax implications on holding VOO vs VFV in certain accounts. For registered accounts, holding VOO directly will be more tax efficient than holding VFV.
The S&P 500
The Standard & Poor’s 500 is regarded as the best single measure of the large-cap U.S. equity market and is the world’s most tracked index measured by assets under management. The S&P 500 accounts for approximately 80% of the U.S. equity market’s available market cap.
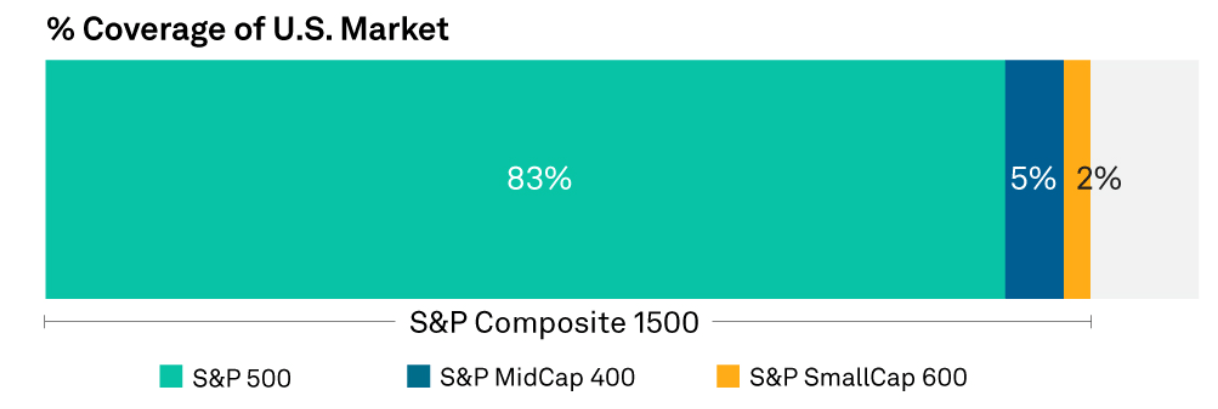
S&P 500 vs S&P 1500 (S&P Global)
The Standard & Poor’s 500 index was launched on March 4, 1957, with the goal of tracking the performance of the 500 leading U.S. firms at the time. In 1957, the S&P 500 represented a market capitalization of $172B, comprised of 425 industrial, 15 rail and 60 utility stocks. Eligibility for inclusion in the S&P 500 index requires constituents to be a U.S. company, meet market capitalization requirements of approximately $14B USD, have strong liquidity and a public float of at least 10% of its shares outstanding. Additionally, companies must have a history of recent positive earnings.
In August 1976, John C. Bogle launched Vanguard’s first retail index mutual fund, the Vanguard First Index Investment Trust. This concept of tracking an index rather than actively managing a fund proved to be hugely successful. Today, the successor of this fund Vanguard 500 Index Fund Investor Shares (VFINX) has a market capitalization of $770B.
Holdings
VFV holds the 503 stocks that comprise the 500 companies of the S&P 500. These extra three holdings are due to companies such as Alphabet Inc. that have multiple classes of shares (GOOG & GOOGL).
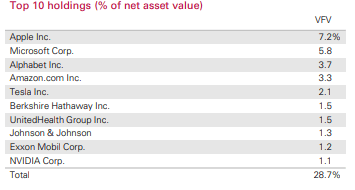
Top Ten Holdings (Vanguard)
VFV has representation from all eleven stock sectors as defined by the Global Industry Classification Standard: Energy, Materials, Industrials, Consumer Discretionary, Consumer Staples, Health Care, Financials, Information Technology, Communication Services, Real Estate, and Utilities.
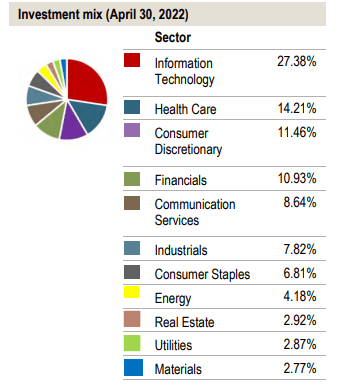
Sector allocation (Vanguard)
Information Technology, Health Care and Consumer Discretionary account for a little over half of the total index. The S&P has been dominated by the FAANG tech giants since Apple Inc (AAPL) first overtook Exxon Mobil Corporation (XOM) in 2012 as the largest holding in the index. The composition of the S&P 500 has evolved significantly in recent decades. In 2009 for instance, energy accounted for 13% of the index, today it is just 4%. This change makes the index less cyclical than it was before the global financial crisis. The growth in Information Technology from 18% in 2009 to 27% today is largely driven by a handful of tech companies with growthy valuations. While this sector continues to dominate the S&P 500, the sector’s relative weighting in the index is still less than in 2000 prior to the dotcom bubble.
Canadian Home Bias
The S&P 500 index is so ubiquitous that most of the largest ETFs and index mutual funds are designed to replicate it. Even many general equity mutual funds will hold a portion of an ETF that tracks the S&P 500 to provide some ballast to the index that the fund is measured against. The U.S. stock markets accounts for approximately 55% of the total world’s equity market, far ahead of the next largest market of Japan with 7.4%.
|
Country |
Market share (%) of total world equity market value |
|
United States |
55.90% |
|
Japan |
7.40% |
|
China |
5.40% |
|
UK |
4.10% |
|
France |
2.90% |
|
Switzerland |
2.60% |
|
Germany |
2.60% |
|
Canada |
2.40% |
|
Australia |
2.10% |
|
South Korea |
1.80% |
|
Taiwan |
1.70% |
Source: Finbold
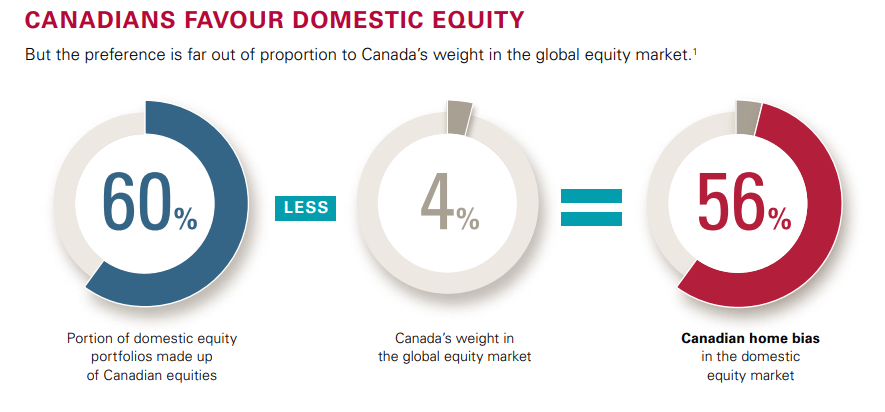
The Canadian stock market accounts for less than 3% of the world’s equity market and is dominated by the Financial and Energy sectors. According to a 2014 study by Vanguard, Canadian investors have an unhealthy bias towards investing in domestic Canadian equities. This study indicated that Canadian equities accounted for 60% of average Canadian investors. There are probably many reasons for this preference including human psychology and preferential dividend taxation rules.
Canadian Home Bias (Vanguard)
This is concerning for many Canadian investors, as an overweight allocation to Canadian equities could lead to poor diversification and underperformance. The Canadian stock market tends to underrepresent many important sectors including Technology, Healthcare, Consumer Discretionary, Consumer Defensive and Industrials. From a performance perspective, many Canadian investors are also missing out on the average outperformance of U.S. equities relative to Canadian equities. For the 30 years ended December 2021, Canadian equities averaged 8.84% annually, compared to U.S. equities, which returned an average of 11.02% annually.
S&P 500 Performance (Seeking Alpha)
Market Capitalization Considerations
The Standard & Poor’s 500 for most people is synonymous with the U.S. market, however the S&P 500 is not the whole market. The S&P 500 is broader and more diversified than the Dow Jones Industrial Average or the Nasdaq 100 Index; however, it is not as broad as the Russell 2000 or the Wiltshire 5000 which contain many mid-cap and small-cap names. Over the very long-term, small-cap stocks have tended to outperform large-cap stocks (especially small-cap value stocks). VFV’s holdings limited to only the largest publicly listed companies in the U.S. precludes participation in small companies engaging in niche industries.
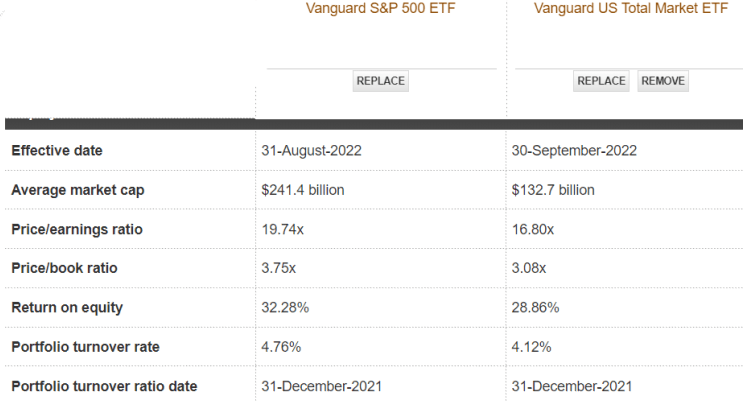
VFV vs VUN (Vanguard)
I am a proponent of total market ETFs that include small-cap names along with the largest listed companies in a particular market. When compared to the total U.S. market as represented by Vanguard US Total Market ETF VUN, VFV has a both a higher P/E ratio and a higher P/B ratio. On an earnings basis, this suggests that the largest 500 U.S. firms that are held within VFV are 17% more expensive than the total market average. The average market capitalization of stocks held within VFV is over $240B, compared to $132B for VUN. With a higher concentration of mature dividend paying stocks, VFV also has a higher 12-month yield than VUN at 1.34% compared to 1.21%.
How Vanguard’s S&P 500 ETF Compares to Peers
The largest providers of S&P 500 index tracking ETFs in Canada are Vanguard, iShares, Bank of Montreal (BMO) and Horizons. All four of these providers also offer similar versions hedged to CAD$. Most studies suggest that over the long-term currency hedging for Canadian listed ETFs does not add value or lead to outperformance. The MER of these S&P 500 index funds are all very competitive and the differences between them is negligible.
|
ETF Provider |
Ticker (TSX) |
Net Assets |
MER |
FEE |
Annual Cost per $100K invested |
|
Vanguard |
(VFV:CA) |
$6.29B |
0.09% |
0.08% |
$ 90 |
|
iShares |
$4.22B |
0.10% |
0.09% |
$ 100 |
|
|
BMO |
$8.86B |
0.09% |
0.08% |
$ 90 |
|
|
Horizons |
$2.17B |
0.10% |
0.10% |
$ 100 |
International Diversification
While VFV’s holdings are entirely categorized as U.S. equity, the vast majority of the S&P 500 are large multinational companies that have significant overseas operations. According to Morningstar, 62% of revenues for S&P 500 companies come from the United States and as much as 38% are derived from outside the U.S. This compares to the Russell 2000 index, where 81% of the revenues are domestic. Small and mid-cap stocks tend to be more domestically focused which can be an advantage during periods when the U.S. market is outperforming international markets.
Investor Takeaways
Canadian based investors need to look beyond the TSX S&P 60 to construct a diversified portfolio. Over the long-term, U.S. equities have outperformed Canadian equities and offered less sector concentration. Vanguard’s VFV offers an easy, low-cost way to own the world’s largest and most dynamic equity market. VFV’s average annualized return of 15.33% is a strong endorsement for owning and holding the S&P 500. Vanguard’s VFV makes this very easy to add to your portfolio.
Be the first to comment