

AndreyPopov
A Quick Take On Vertex
Vertex (NASDAQ:VERX) reported its Q2 2022 financial results on August 9, 2022, beating expected revenue estimates.
The company provides tax calculation and compliance software to businesses worldwide.
A combination of slower-trending top line growth and negative earnings results is not too compelling.
I’m on Hold for VERX until it can ignite faster growth while achieving profitability.
Vertex Overview
King of Prussia, Pennsylvania-based Vertex was founded to create hybrid software solutions for sales tax, seller’s use tax, consumer use tax and value added taxes, among others.
Management is headed by president and Chief Executive Officer Mr. David DeStefano, who has been with the firm since 2015 and was previously Principal and Vice President at The Mid Atlantic Companies.
The company has more than 4,000 customers worldwide, including over half of the Fortune 500 firms, while providing tax support in more than 130 countries.
The company’s primary offerings include:
-
Tax determination
-
Compliance
-
Reporting
-
Data management
-
Document management
Vertex’s Market & Competition
According to a 2019 market research report, the global market for sales tax software was $6.2 billion in 2018 and is expected to reach $13.1 billion in 2027.
This represents a forecast CAGR of 8.8% from 2019 to 2027, a reasonably strong growth rate.
The main drivers for this expected growth are a growing complexity in indirect tax requirements and an increasing number and selection of solutions available to companies.
Also, as companies transition to the cloud, they will be able to offset retraining costs with lower upfront software costs in certain situations.
Major competitive or other industry participants include:
Vertex’s Recent Financial Performance
-
Total revenue by quarter has risen as shown in the chart below:
9 Quarter Total Revenue (Seeking Alpha)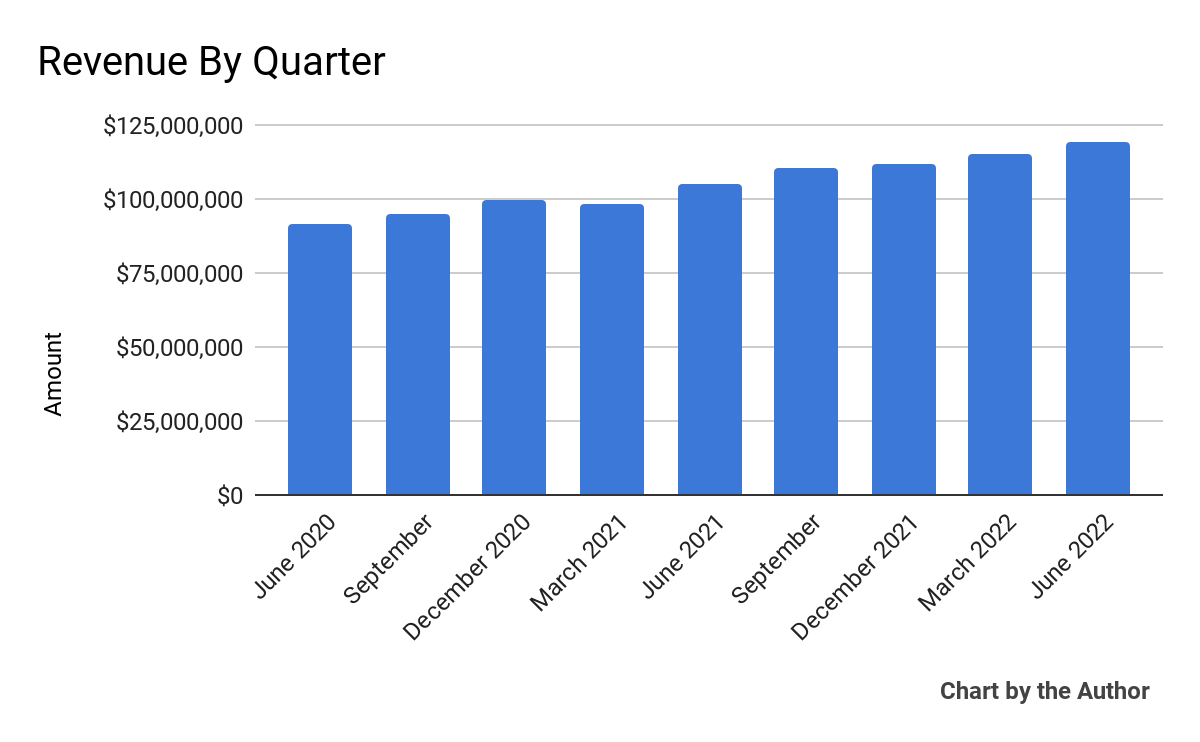
-
Gross profit by quarter has also grown accordingly:
9 Quarter Gross Profit (Seeking Alpha)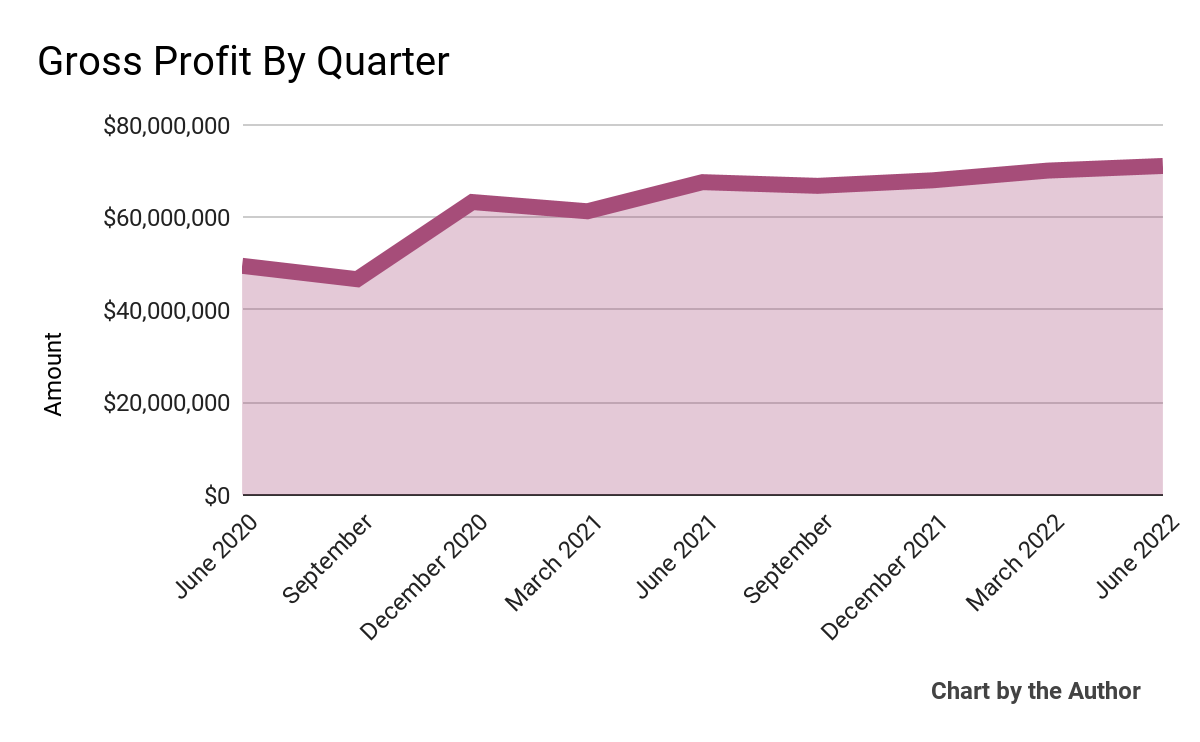
-
Selling, G&A expenses as a percentage of total revenue by quarter have remained relatively stable in recent quarters:
9 Quarter Selling, G&A % Of Revenue (Seeking Alpha)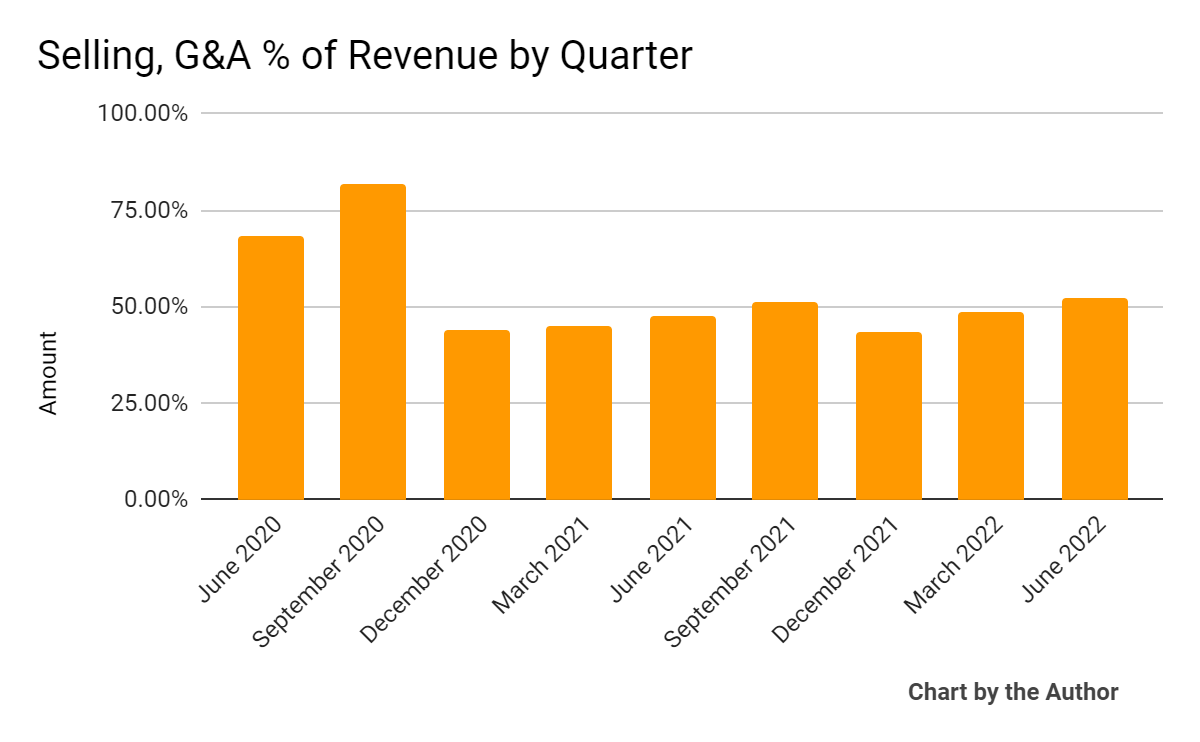
-
Operating income by quarter has fluctuated around breakeven in recent reporting periods:
9 Quarter Operating Income (Seeking Alpha)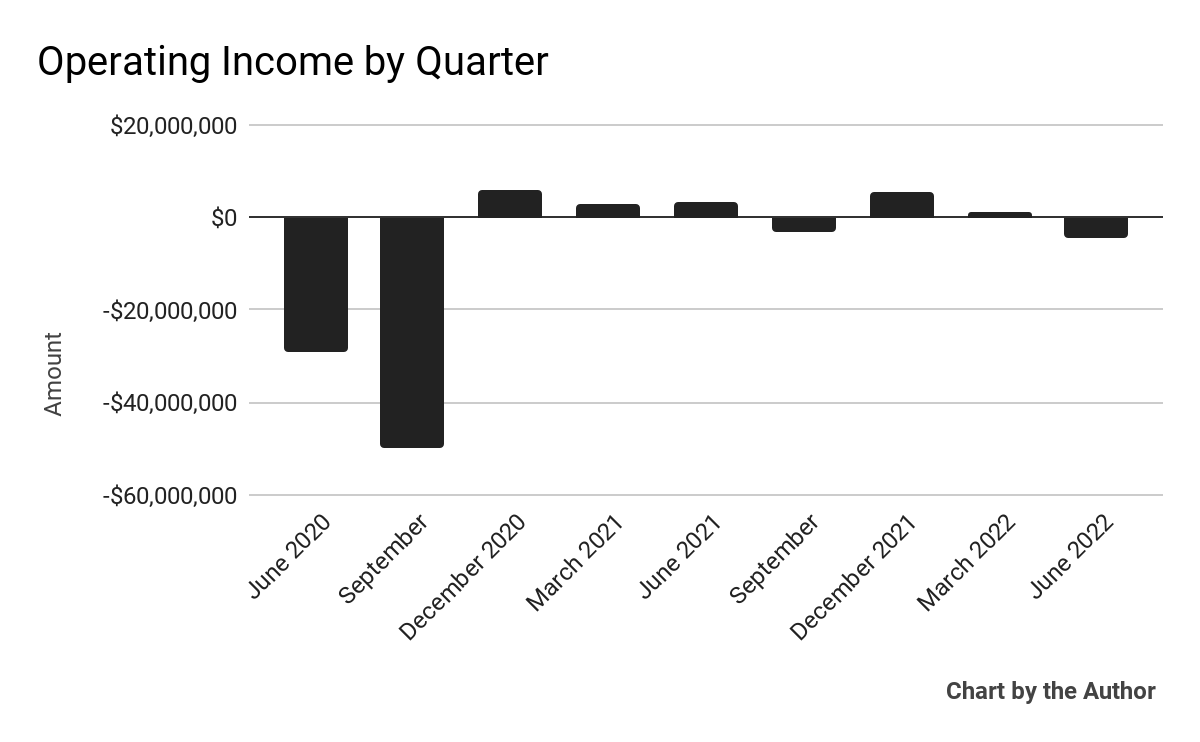
-
Earnings per share (Diluted) have also remained close to breakeven in recent quarters:
9 Quarter Earnings Per Share (Seeking Alpha)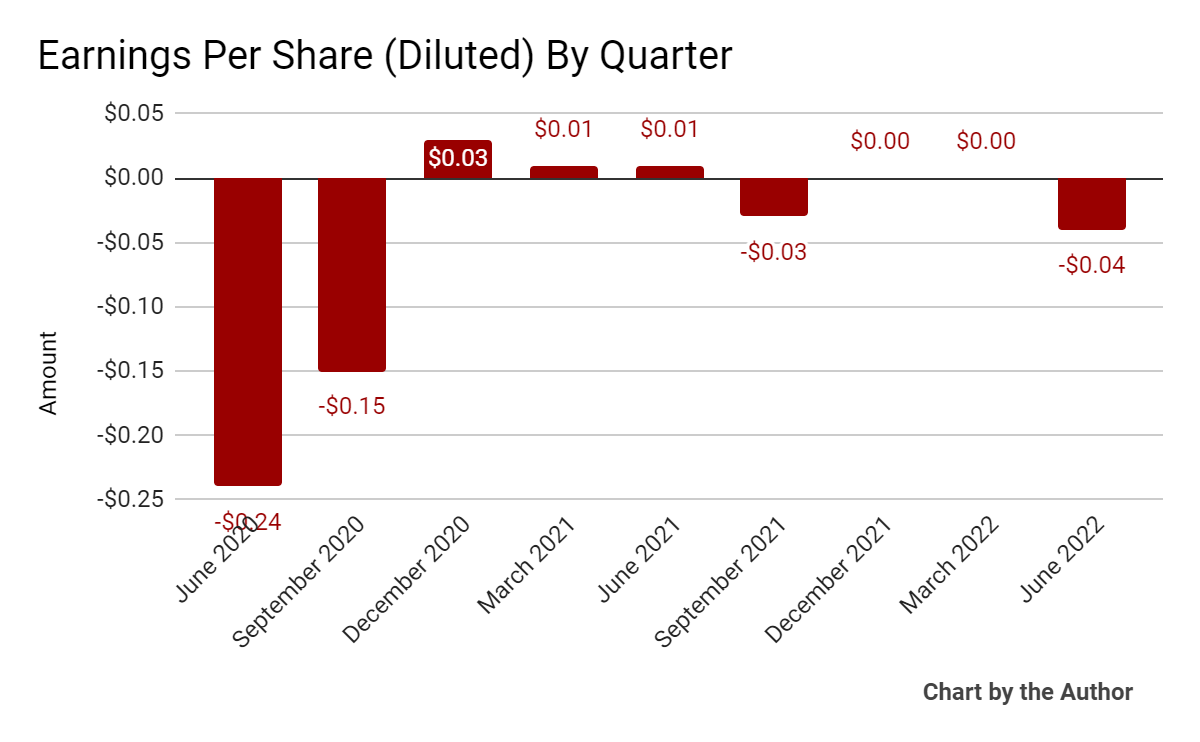
(All data in above charts is GAAP)
In the past 12 months, VERX’s stock price has fallen 26% vs. the U.S. S&P 500 index’s drop of around 16.6%, as the chart below indicates:
52 Week Stock Price (Seeking Alpha)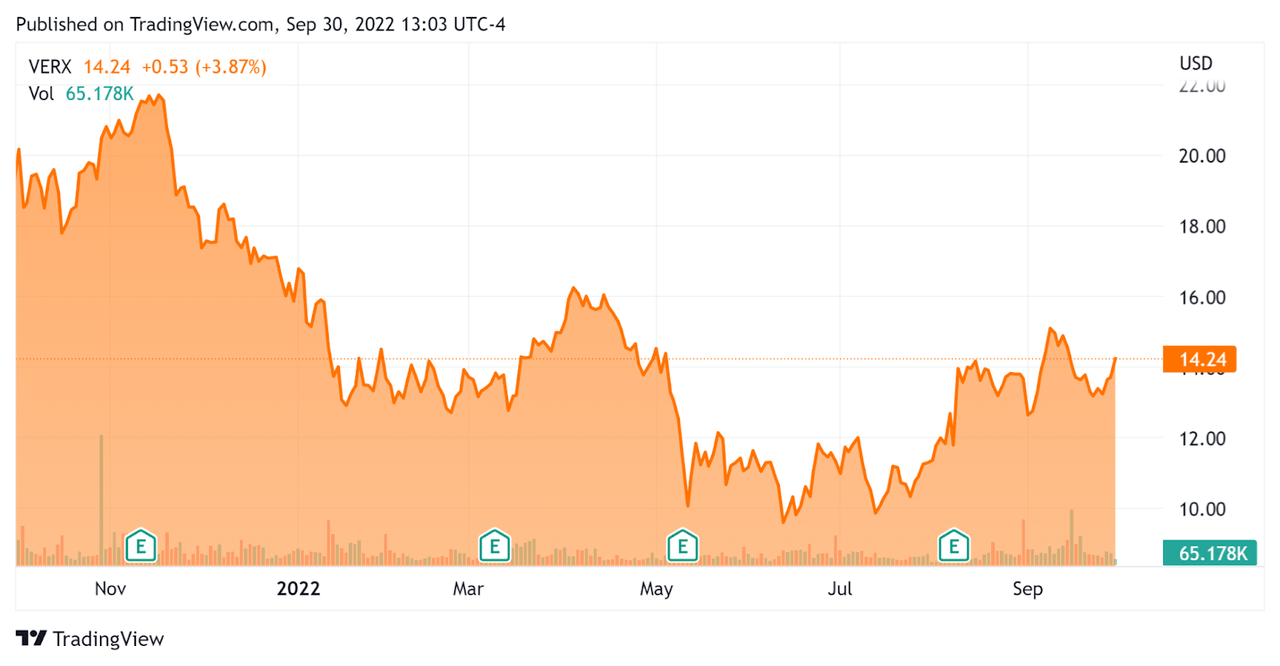
Valuation And Other Metrics For Vertex
Below is a table of relevant capitalization and valuation figures for the company:
|
Measure [TTM] |
Amount |
|
Enterprise Value / Sales |
4.45 |
|
Revenue Growth Rate |
14.9% |
|
Net Income Margin |
-2.3% |
|
GAAP EBITDA % |
2.3% |
|
Market Capitalization |
$2,040,000,000 |
|
Enterprise Value |
$2,030,000,000 |
|
Operating Cash Flow |
$80,080,000 |
|
Earnings Per Share (Fully Diluted) |
-$0.07 |
(Source – Seeking Alpha)
As a reference, a relevant partial public comparable would be Avalara; shown below is a comparison of their primary valuation metrics:
|
Metric |
Avalara |
Vertex |
Variance |
|
Enterprise Value / Sales |
9.75 |
4.45 |
-54.4% |
|
Revenue Growth Rate |
32.6% |
14.9% |
-54.2% |
|
Net Income Margin |
-20.6% |
-2.3% |
89.0% |
|
Operating Cash Flow |
$19,950,000 |
$80,080,000 |
301.4% |
(Source – Seeking Alpha)
A full comparison of the two companies’ performance metrics may be viewed here.
The Rule of 40 is a software industry rule of thumb that says that as long as the combined revenue growth rate and EBITDA percentage rate equal or exceed 40%, the firm is on an acceptable growth/EBITDA trajectory.
VERX’s most recent GAAP Rule of 40 calculation was 17.3% as of Q2 2022, so the firm is in need of improvement in this regard, per the table below:
|
Rule of 40 – GAAP |
Calculation |
|
Recent Rev. Growth % |
14.9% |
|
GAAP EBITDA % |
2.3% |
|
Total |
17.3% |
(Source – Seeking Alpha)
Commentary On Vertex
In its last earnings call (Source – Seeking Alpha), covering Q2 2022’s results, management highlighted its confidence in a large addressable market opportunity as companies seek to track and understand their indirect tax exposure.
Digital commerce and real-time reporting are newer areas of focus for an increasing number of companies, adding to demand potential for Vertex.
The firm has prioritized integrating its solutions into major platforms such as Microsoft, Salesforce, SAP, NetSuite, Coupa and Oracle.
As to its financial results, revenue grew by 14% year-over-year, higher than previous guidance, but lower than previous periods.
The company’s net dollar retention rate was 110%, indicating growing product/market fit and increased sales & marketing efficiency.
VERX’s Rule of 40 results have been only so-so and need significant improvement to be best-in class.
SG&A expense as a percentage of revenue has risen, and operating income turned negative as the company turned in its worst earnings result in the last seven quarters.
For the balance sheet, the firm ended the quarter with $92.5 million in cash, equivalents and short-term investments and $49.5 million in total debt.
Over the trailing twelve months, free cash flow was $34.8 million as the company spent $45.3 million on capital expenditures.
Looking ahead, for full year 2022, management expects total revenue growth of 13.5% at the midpoint of the range, with cloud revenue rising 33%.
Adjusted EBITDA is expected to be $73.5 million at the midpoint.
Regarding valuation, the market is valuing VERX at an EV/Sales multiple of around 4.5x.
The SaaS Capital Index of publicly held SaaS software companies showed an average forward EV/Revenue multiple of around 6.8x at August 31, 2022, as the chart shows here:
SaaS Capital Index (SaaS Capital)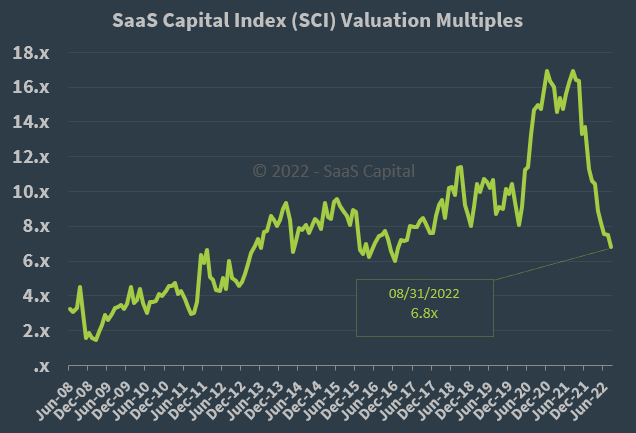
So, by comparison, while the firm is not a pure SaaS play, VERX is currently valued by the market at a discount to the broader SaaS Capital Index, at least as of August 31, 2022.
This discount is likely due to its lower revenue growth trajectory.
The primary risk to the company’s outlook is the growing likelihood of a macroeconomic slowdown or recession, which may slow enterprise sales cycles and reduce its revenue growth trajectory.
Vertex has traded at a lower valuation to Avalara for good reason, it is growing more slowly.
The company’s net results have worsened in the most recent quarter.
So, the combination of slower top line growth than in previous years and negative net results is not too compelling.
I’m on Hold for VERX until it can ignite faster growth while earning profitability.
Be the first to comment