

Thomas Barwick
iShares MSCI Global Agriculture Producers ETF (NYSEARCA:VEGI) is an exchange-traded fund that provides investors with direct exposure to publicly traded companies that produce fertilizers and agricultural chemicals, farm machinery, and packaged foods, and meats. The expense ratio is 0.39%, mostly in line with other sector-specific ETFs offered by iShares, and assets under management are $313 million as of November 9, 2022. That follows positive net fund flows of just under $250 million over the past year (see chart below).
ETFDB.com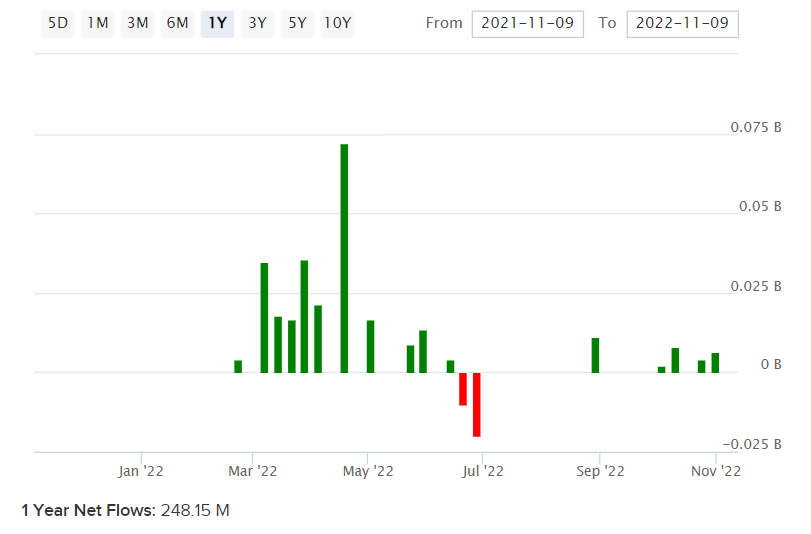
That is a substantial increase in net assets under management. The fact that equities have broadly fallen this year while VEGI has appreciated is a good indication of the level of funds that have flowed into VEGI’s portfolio, whether through VEGI or more directly into the stocks that VEGI holds. VEGI has a global investment mandate, with 158 holdings as of November 9, 2022. Key country exposures include the United States (61% as of November 9, 2022), Canada (7%), India (4%), Norway (4%), and Japan (4%).
iShares.com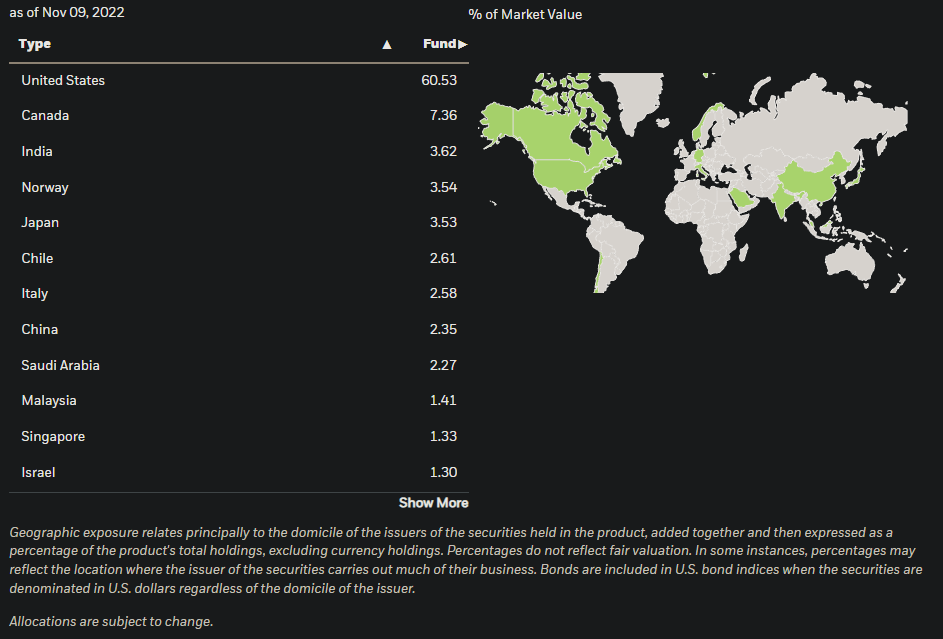
My last piece covering VEGI was dated June 9, 2022; at the time, I thought that VEGI was undervalued (a “strong buy”). Since then, the fund has appreciated 2.87% on a price-only basis against the S&P 500 U.S. equity index’s change of -1.61%. In spite of strong “post-pandemic” performance, I thought the fund was still undervalued, with an IRR of 12-16% per annum being possible on the data available at the time (including basic consensus earnings projections).
Some time has passed, and VEGI has out-performed. However, so far the out-performance is modest (just under 5% on a price-only basis), so it makes sense that further out-performance is still possible. It probably helps somewhat also that characteristically VEGI’s portfolio has some heavier-than-average weightings toward defensive sectors.
Morningstar.com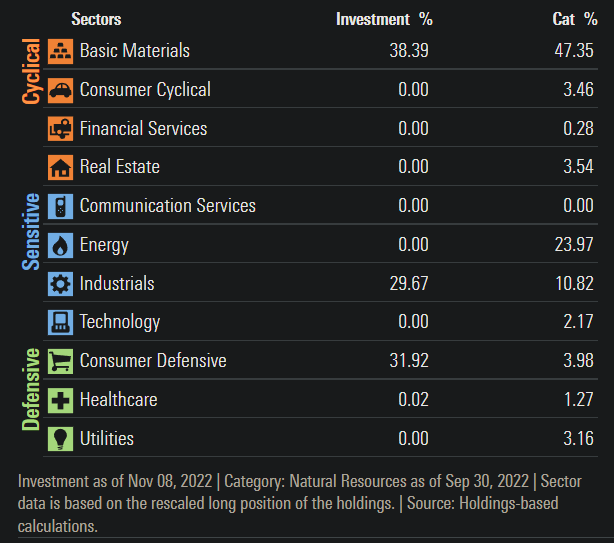
This can help reduce the fund’s beta and thus enable a greater chance of out-performance during bear markets. iShares also offer a short breakdown of sector exposures (see below), describing the sectors as Materials (38% of the fund as of November 9, 2022), Consumer Staples (32%), and Industrials (30%).
iShares.com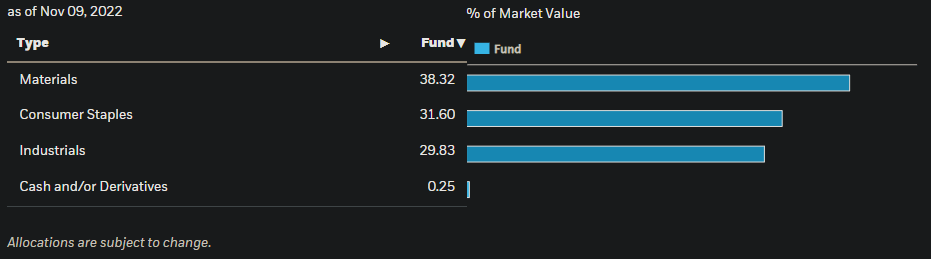
As of Q4 2022, the global business cycle is largely heading into a contractionary period, and so it makes sense for funds with heavier exposures to defensive sectors to out-perform.
Fidelity.com
VEGI seeks to track the performance of its benchmark index, the MSCI ACWI Select Agriculture Producers IMI Index, which as of October 31, 2022, reported trailing and forward price/earnings ratios of 12.16x and 10.57x, respectively. The price/book ratio was 2.38x. That implies a forward return on equity of 22.5%, which is very strong, coupled with a forward earnings yield of 9.46%.
On a weighted basis, I have estimated the risk-free rate as of November 10, 2022, for the VEGI portfolio (weighting 10-year bond yields of each country by VEGI’s exposure to those countries, but rebalanced for cash holdings) of 3.80%. If we then add an equity risk premium of 4.2-5.5%, and a small country risk premium of 25 basis points (this is also following a weighting methodology using country risk premiums provided by Professor Damodaran), I arrive at a cost of equity range of 8.0-9.3%.
Using all the information above, including the fund’s benchmark index’s factsheet for financial data, I arrive at an estimated IRR of about 15%. That is based on underlying earnings power.
Author’s Calculations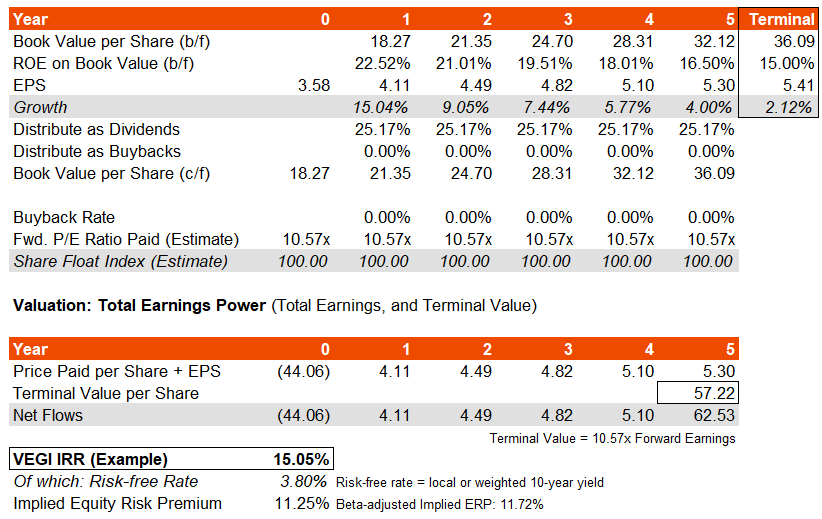
The implied ERP of over 11% is high. While the portfolio composition and earnings estimates may have changed modestly, ultimately this is a very similar base IRR to my prior estimate, which makes sense given a minor price change since then. I am also assuming, as before, that the return on equity falls back to a more modest 15%, which is possibly conservative. My model implies three- to five-year average earnings growth of about 8.20-10.50%, against the consensus estimate of just over 11.50%.
You could also argue that, given even a 2% nominal growth rate in earnings in the long run, and a cost of equity of 8.0-9.3% (as estimated above) that the long-term earnings multiple could be the inverse of the cost of equity net of growth of 13.70-16.67x. That makes VEGI significantly undervalued, not just based on earnings growth potential but also the long-term valuation multiple. The current multiple is only 10.57x which I have held constant in the model above.
In summary, I would opt to continue to take a very bullish view on VEGI.
Be the first to comment