

gesrey
I want to start by stating that the Vanguard High Dividend ETF (NYSEARCA:VYM) is part of my ETF investment mix. I have been invested in VYM since 11/8/17. I didn’t want to allocate 100% of that account’s capital to an S&P fund and wanted a mixture of funds. I had selected VYM for three investment focuses, 1st as a higher dividend yield ETF to generate larger than average income, 2nd for capital appreciation, and 3rd to achieve a modest yield without single stock exposure. VYM has accomplished all my investment goals, but it’s not packing the same punch as some of the other funds I had selected. I have nothing against VYM, as I plan on holding and reinvesting all future dividends, but I won’t be adding fresh capital to this position. As a component of an overall ETF strategy, VYM has done well for me as I am a fan of diversification, but it’s not a portfolio standout in any category. There isn’t much to complain about, and VYM has a track record of meeting its objectives, but with the markets potentially forming a sustainable rally, VYM isn’t positioned to deliver the wow factor.
Maybe the markets are setting up for a sustainable 2nd half rally
It’s almost impossible to predict the exact time the markets have bottomed when you’re in the moment, and most bottoms aren’t formed for several months after they occur. Looking at the charts, the markets seem to have formed a temporary bottom on or around June 16th; the real question becomes, is the rally sustainable? Since June 16th, the Invesco QQQ ETF (QQQ) has appreciated by 17.63%, the SPDR S&P 500 Trust ETF (SPY) has rallied 12.32%, and the SPDR Dow Jones Industrial Average ETF (DIA) is up 8.97%.
Seeking Alpha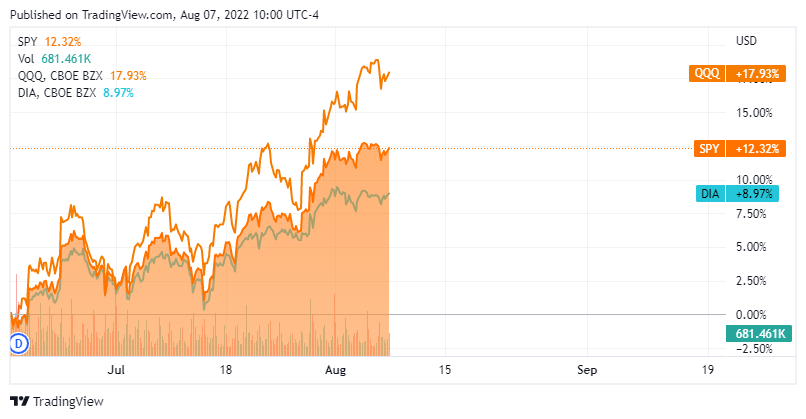
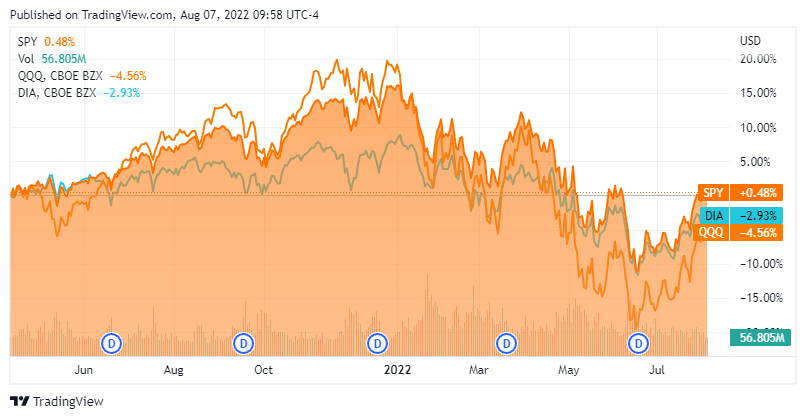
Looking at SPY, QQQ, and DIA in a 3-month and since the spring of 2021, it does look like a floor is forming. Just because the markets are starting to trend upward doesn’t mean that they will continue to do so.
Seeking Alpha Seeking Alpha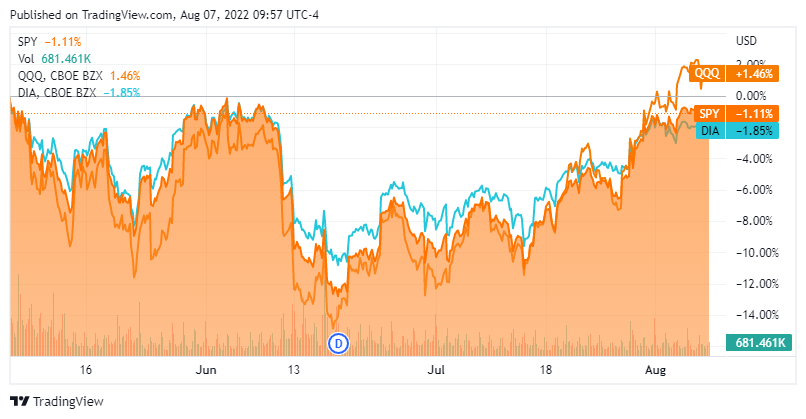
While the U.S is technically in a recession, as the definition is 2 consecutive negative quarters of GDP growth, many economic indicators are signaling that costs are declining, and we could be in for a lower CPI print this week. Inflation came in extremely high at 9.1% for June, but the core CPI, which excludes energy and food, declined for 3 consecutive months. Gas prices in the U.S look as if they topped out between June 14th – June 19th, as the average price of gas has declined from roughly $5.02 to $4.11 while diesel declined from $5.82 to $5.19. Crude oil has declined from $126.42 to $88.46 per barrel since the beginning of June, and we’re starting to see other commodities and agricultural prices decline as Lumber is down -24.54% on the month, wheat is down -3.48% on the month and milk is down -10.59% on the month.
The U.S. economy added 528K jobs in July of 2022, surpassing market forecasts of 250K and above an upwardly revised 398K in June. The labor market looks strong while commodity prices continue to decline. On 8/10, we get the July CPI and Core CPI numbers, and on 8/11, the initial jobless claims come out. Based on declining commodity prices, there is a good chance that the CPI print will show a decline from the 9.1% June print. If that occurs, we could see the markets rally and commentators ready to call a bottom.
Trading Economics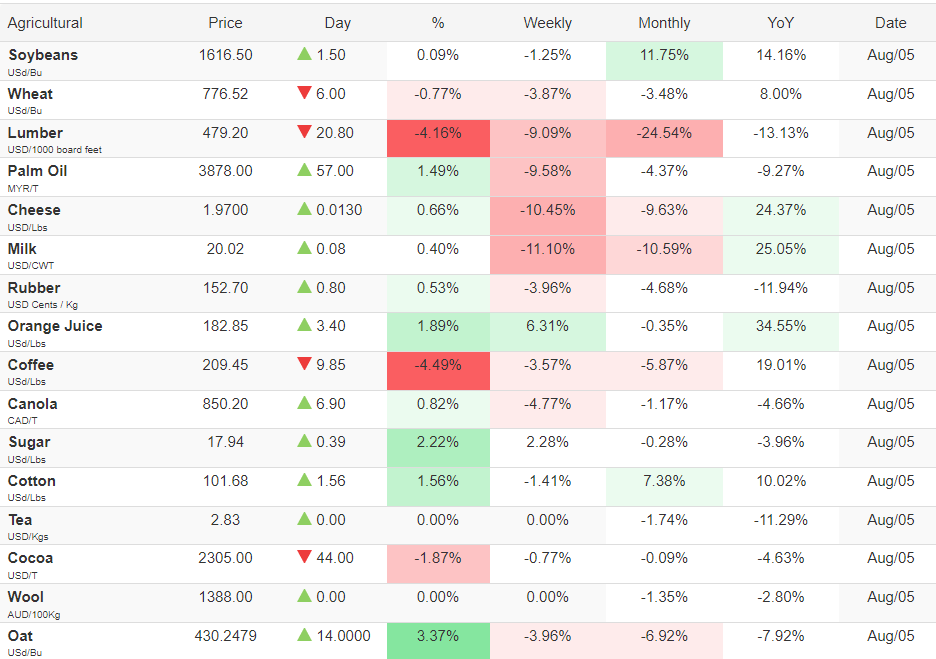
My investment goal for VYM was to generate more income than a standard index fund while capturing some capital appreciation, but it hasn’t been the best option
In my comparison, I am going to look at the following funds:
- SPDR S&P 500 Trust (SPY) – The Baseline For Appreciation
- Vanguard High Dividend Yield ETF (VYM)
- SPDR Portfolio S&P 500 High Dividend ETF (SPYD)
- Invesco S&P 500 High Dividend Low Volatility Portfolio (SPHD)
- iShares Core High Dividend ETF (HDV)
- iShares Select Dividend ETF (DVY)
- Schwab U.S. Dividend Equity ETF (SCHD)
- iShares Core Dividend Growth ETF (DGRO)
|
Company Name |
Ticker |
Share Price |
Dividend Per Share |
Dividend Yield |
|
SPDR Portfolio S&P 500 High Dividend ETF |
SPYD |
$40.89 |
$1.57 |
3.84% |
|
Invesco S&P 500 High Dividend Low Volatility Portfolio |
SPHD |
$44.67 |
$1.52 |
3.40% |
|
iShares Select Dividend ETF |
SCHD |
$74.61 |
$2.43 |
3.26% |
|
iShares Core High Dividend ETF |
HDV |
$102.03 |
$3.16 |
3.10% |
|
Vanguard High Dividend Yield ETF |
VYM |
$105.60 |
$3.20 |
3.03% |
|
iShares Select Dividend ETF |
DVY |
$120.92 |
$3.63 |
3.00% |
|
iShares Core Dividend Growth ETF |
DGRO |
$50.68 |
$1.05 |
2.07% |
|
SPDR S&P 500 Trust |
SPY |
$413.47 |
$6.01 |
1.45% |
When looking at the dividend yield compared to SPY, which I use as my baseline index fund, it’s more than double. From an income perspective, VYM is generating substantially more yield than an index fund, but when you look at other dividend ETF funds, its income is around the midrange point. If your main focus is on income, then SPYD is certainly more attractive as it’s generating a 3.84% yield compared to VYM’s 3.03% yield.
If I was going to select 1 dividend fund right now, VYM is in the conversation from a yield perspective, but it’s not at the top of the list. Based on my logic about what could drive the markets higher in the back half of 2022, I want to look at how these funds have faired compared to SPY over extended periods and shorter periods of time.
Since the recent bottom on June 16th SPY has appreciated by 12.32%, while VYM has appreciated by 5.48%. This is to be expected as VYM is not an index fund and doesn’t have companies such as Amazon (AMZN) or Alphabet (GOOGL) within its portfolio. VYM was trailing SCHD, DVY, and DGRO on capital appreciation since June 16th also. Out of these 3 funds, SCHD is the only one with a larger yield than VYM.
Seeking Alpha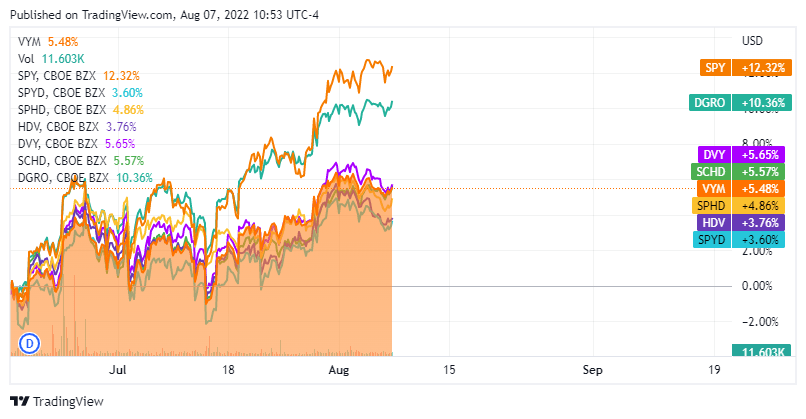
Going back 6-months to right when the war in Ukraine became a global crisis, VYM has declined by -6.1%, which has outpaced SPY’s decline of -7.95%. SPHD, HDV, DVY, SCHD, and DGRO all declined less (-1.28% to -5.83%) than VYM in this period. This puts SCHD, DVY, and DGRO in a stronger position for short-term appreciation and downside mitigation than VYM, and out of these 3, SCHD is the only one with a larger yield than VYM.
Seeking Alpha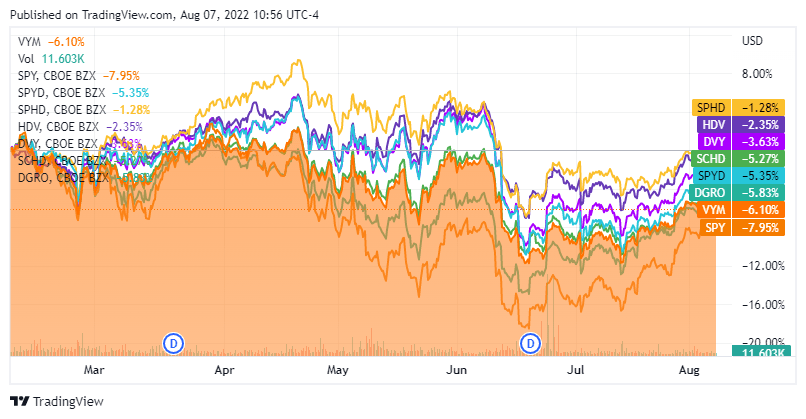
Nobody knows if we’re going to enter into a new bull cycle, but historically every 3-5 year period after a recession has ended with the markets ending positive, excluding 2020 and now 2022, data pending. Historically, 91% of the time since 1953, returns have been positive after a recession in the following year and 82% of the time 2 years after a recession.
Darrow Wealth Management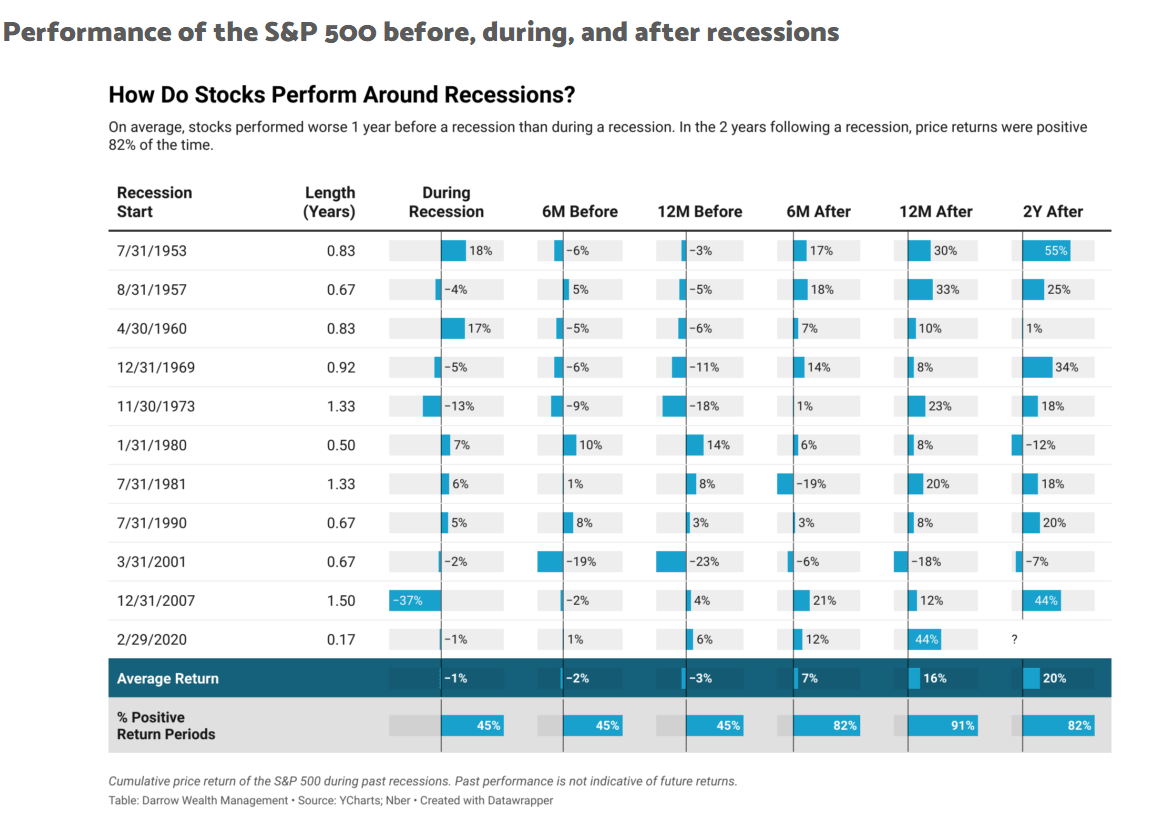
Given the historical data, I want to go back 10 years and look at the long-term track record of VYM compared to SPY and SCHD since both funds have been in existence for more than a decade. VYM hasn’t lost money and appreciated by 113.2% over this period but compared to SPY and SCHD, a respectable amount of appreciation has been left on the table. SCHD has appreciated by an additional 47.58% compared to VYM over the past 10-years. I don’t expect any of these funds to exceed the S&P’s returns, but if I was going to pick just 1 of these ETFs, SCHD would be my pick over VYM. SCHD has a track record of generating larger amounts of appreciation and more downside mitigation ability while having a larger yield.
Seeking Alpha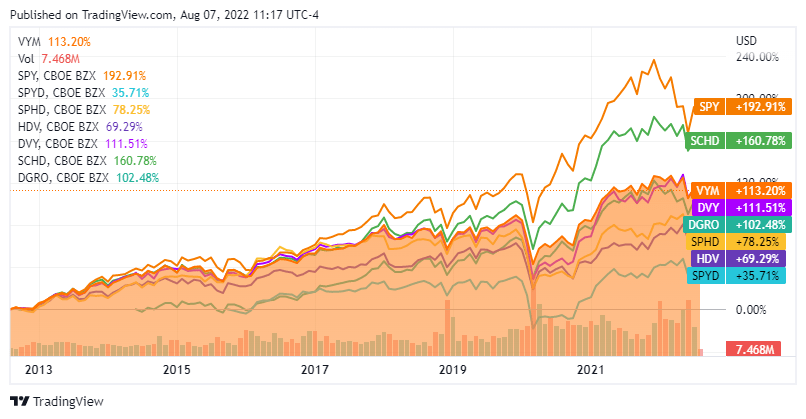
The Vanguard High Dividend Yield ETF is still a quality dividend fund even if its trailing SCHD in the categories I evaluated
VYM provides investors with a basket of individual equities to generate yields that outpace traditional index or total market funds through a passively managed fund. VYM tracks the FTSE High Dividend Yield Index, which consists of common stocks of companies that pay dividends that generally are higher than average. Vanguard takes an indexing approach and attempts to replicate the FTSE High Dividend Yield Index by investing in many, if not all, its underlying holdings. By investing in VYM, your gaining exposure to this index while sitting back and focusing on other endeavors while the team at Vanguard monitors and makes future decisions about VYM’s investment mix. Investors are paying next to nothing with a 0.06% expense ratio for the professionals at Vanguard to handle the inner workings of this fund. VYM’s 0.06% expense ratio compared to an average expense ratio of similar funds of 0.92% is a no-brainer in my opinion. Over a 10-year period, your expenses at a 9% average rate of return would be $142 with VYM compared to $2,090 from the category average.
Vanguard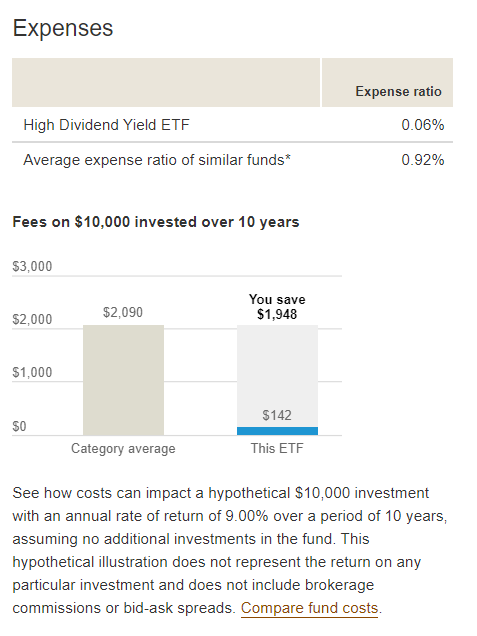
VYM has 443 stocks which creates a large level of diversification, the median market cap is $130 billion, and there are $55.6 billion in total net assets within VYM. Looking at the top ten holdings, you find nothing but blue chips from The Coca-Cola Company (KO) to Procter & Gamble (PG). VYM also does a great job spreading out the capital and not concentrating on a single sector as financials are their largest holdings at 19.40%. When I look at a funds level of diversification, unless I am investing in a sector-specific theme, I like to see no more than 20% for the largest sector and 5% for the largest holding.
Vanguard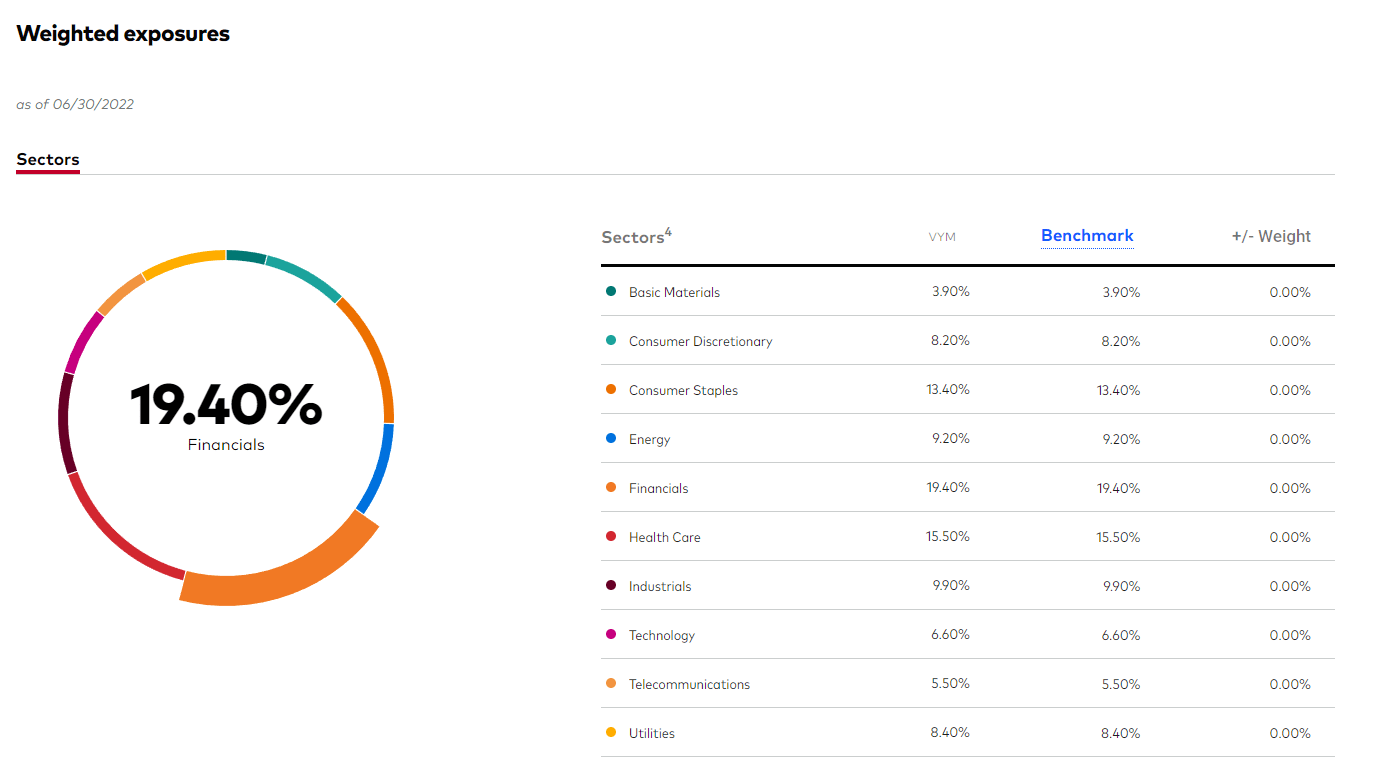
Conclusion
VYM is a solid income fund that can complement a diversified investment mix. I am a shareholder, and VYM is a component of my income strategy from ETFs. If I was constructing my portfolio today or picking a single income-focused ETF to achieve a larger than average yield while capturing capital appreciation, VYM would not be my first choice. I would place a larger emphasis on SCHD, and if I was selecting just 1 income ETF as part of a smaller basket of ETFs, I would select SCHD over VYM. VYM is a quality dividend fund, but SCHD has a larger yield and has done better over the time periods I reviewed. I am not unhappy with VYM, and I have no reason to cut it loose, but it’s not a fund I will be adding to any time soon.
Be the first to comment