

benedek/E+ via Getty Images
Earnings of Valley National Bancorp (NASDAQ: VLY) will likely continue to trend upwards this year on the back of acquisitions. The outlook for organic loan growth is also bright given the economic strength in the country. Further, the net interest income is moderately sensitive to interest rate changes; therefore, the topline will benefit from a rising interest-rate environment. Overall, I’m expecting Valley National to report earnings of $1.21 per share in 2022, up 7.6% year-over-year. Compared to my last report on Valley National, I have slightly revised upward my earnings estimate because of revisions in both loan growth and margin expansion. The year-end target price suggests a high upside from the current market price. Therefore, I’m maintaining a buy rating on Valley National Bancorp.
Outlook on Both Acquired and Organic Loan Growth Remains Positive
Valley National’s loan portfolio grew by a remarkable 4.7% in the fourth quarter of 2021 (19% annualized), partly on the back of the acquisition of Westchester Bank. Further growth through acquisition is on the cards because of the upcoming acquisition of Bank Leumi, USA. The transaction is now scheduled to close on April 1, 2022, according to a recent press release. The acquisition will likely add around $5.4 billion worth of loans, boosting Valley National’s loan portfolio by around 15.8%.
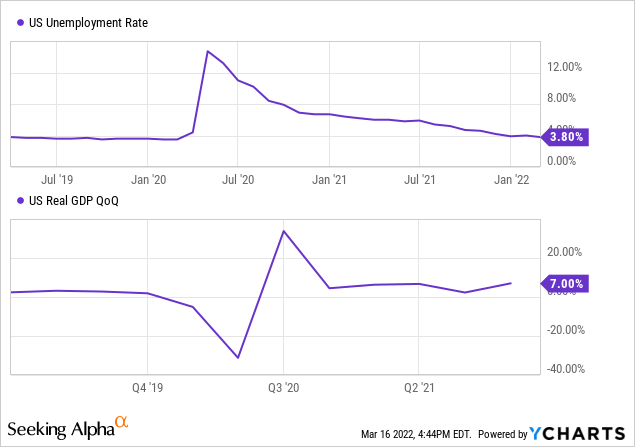
The outlook for organic loan growth is also bright. The company achieved annualized organic, non-PPP (Paycheck Protection Program) loan growth of approximately 13% in the fourth quarter, as mentioned in the earnings presentation. This momentum is likely to continue through 2022 because of the economic recovery. Valley National Bancorp operates in several states, namely New Jersey, New York, Florida, and Alabama. Due to this geographical diversity, nationwide economic metrics are appropriate to gauge future credit demand. Both the unemployment rate and the GDP growth rate show that the economic activity is robust.
The management mentioned in the presentation that it is targeting organic loan growth of 7% to 9% in 2022. In my previous report on Valley National, I had expected low-single-digit organic loan growth. Considering the good performance in the last quarter, and economic recovery, I now believe the organic loan growth this year may be closer to a mid-single-digit range. Combining the anticipated organic and acquired loan growth, I’m expecting the loan portfolio to increase by 21% by the end of December 2022 from the end of 2021. Other balance sheet items will likely grow in line with loans. The following table shows my balance sheet estimates.
| FY17 | FY18 | FY19 | FY20 | FY21 | FY22E | ||||
| Financial Position | |||||||||
| Net Loans | 18,211 | 24,884 | 29,537 | 31,877 | 33,794 | 40,992 | |||
| Growth of Net Loans | 6.4% | 36.6% | 18.7% | 7.9% | 6.0% | 21.3% | |||
| Securities | 3,525 | 4,030 | 4,199 | 4,913 | 5,855 | 6,894 | |||
| Total assets | 24,002 | 31,863 | 37,436 | 40,686 | 43,446 | 54,679 | |||
| Deposits | 18,153 | 24,453 | 29,186 | 31,936 | 35,632 | 45,085 | |||
| Borrowings and Sub-Debt | 3,064 | 3,773 | 3,271 | 3,500 | 2,136 | 2,515 | |||
| Common equity | 2,323 | 3,141 | 4,174 | 4,382 | 4,874 | 6,276 | |||
| Book Value Per Share ($) | 8.8 | 9.4 | 12.3 | 10.8 | 11.8 | 12.4 | |||
| Tangible BVPS ($) | 6.0 | 5.9 | 8.0 | 7.2 | 8.1 | 9.4 | |||
|
Source: SEC Filings, Author’s Estimates (In USD million unless otherwise specified) |
|||||||||
Moderate Interest-Rate Sensitivity to Further Increase the Topline
The management’s interest-rate sensitivity analysis given in the 10-K filing shows that the current balance sheet is moderately sensitive to interest rate changes. A 100-basis points increase in interest rates can boost the net interest income by 5.13% over twelve months.
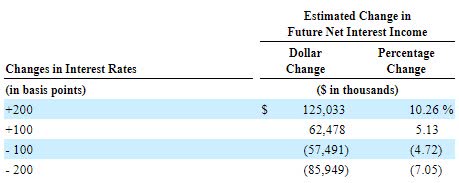
2021 10-K Filing
The above analysis is based on a static balance sheet. Valley National has the opportunity to improve its balance sheet further, which will add to the margin expansion. The excess cash on Valley National’s books increased during 2021. Interest-bearing deposits with other banks, a cash component, increased to $1.8 billion at the end of December 2021 from $1.1 billion at the end of December 2020. Valley can swiftly move the excess cash into higher-yielding securities after a rate hike.
Considering these factors, I’m expecting the margin to improve by seven basis points in 2022. In my last report on Valley National, I had expected the margin to increase by five basis points this year. I have somewhat revised upward my margin estimate because of economic data released since the publishing of my last report on Valley National.
Expecting Earnings of $1.21 per Share
The anticipated loan growth and margin expansion will likely drive earnings growth this year. On the other hand, the provision expense will likely increase this year, which will restrict earnings growth. The additions to the loan portfolio will likely drive the provisioning required for expected loan losses. The existing allowance level appears enough to cover the portfolio’s credit risk; therefore, I’m not expecting the existing portfolio to result in higher provisioning for this year. Allowances made up 1.1% of total loans while non-accrual loans made up 0.7% of total loans by the end of December 2021, as mentioned in the earnings release. Overall, I’m expecting the provision expense to remain at a normal, pre-pandemic level this year. I’m expecting the provision expense to make up around 0.09% of total loans in 2022, which is the same as the average provision-expense-to-total-loan ratio for 2017 to 2019.
Further, the non-interest expenses will likely rise in line with the increase in revenue. However, the Bank Leumi acquisition will likely result in some cost savings. The management mentioned in the conference call that it expects to preserve the efficiency ratio below 50% in 2022.
Considering these factors, I’m expecting Valley National to report earnings of $1.21 per share in 2022, up 7.6% year-over-year. The following table shows my income statement estimates.
| FY17 | FY18 | FY19 | FY20 | FY21 | FY22E | ||||
| Financial Summary | |||||||||
| Net interest income | 660 | 857 | 898 | 1,119 | 1,210 | 1,484 | |||
| Provision for loan losses | 10 | 33 | 24 | 126 | 33 | 36 | |||
| Non-interest income | 112 | 134 | 215 | 183 | 155 | 244 | |||
| Non-interest expense | 509 | 629 | 632 | 646 | 692 | 847 | |||
| Net income – Common Sh. | 152 | 249 | 297 | 378 | 461 | 613 | |||
| EPS – Diluted ($) | 0.58 | 0.75 | 0.87 | 0.93 | 1.12 | 1.21 | |||
|
Source: SEC Filings, Author’s Estimates (In USD million unless otherwise specified) |
|||||||||
In my last report on Valley National, I expected the company to report earnings of $1.19 per share in 2022. I have slightly increased my earnings estimate because I have revised upwards both my loan growth and margin expansion estimates. I have also raised my estimate for operating expenses.
Actual earnings may differ materially from estimates because of the risks and uncertainties related to the COVID-19 pandemic and the magnitude of interest rate hikes.
Year-End Target Price Signals a Good Capital Appreciation Opportunity
VLY is offering a dividend yield of 3.2% at the current quarterly dividend rate of $0.11 per share. The earnings and dividend estimates suggest a payout ratio of 40% for 2022, which is below the five-year average of 59%. Despite the below-average payout ratio, I’m not expecting an increase in the dividend payout because 40% is still high. Further, Valley National has maintained its dividend at $0.11 per share since the last quarter of 2013. It seems unlikely that the company will break its tradition this year.
I’m using the historical price-to-tangible book (“P/TB”) and price-to-earnings (“P/E”) multiples to value Valley National. The stock has traded at an average P/TB ratio of 1.61 in the past, as shown below.
| FY17 | FY18 | FY19 | FY20 | FY21 | Average | |
| T. Book Value per Share ($) | 6.0 | 5.9 | 8.0 | 7.2 | 8.1 | |
| Average Market Price ($) | 11.7 | 11.8 | 10.7 | 8.4 | 13.2 | |
| Historical P/TB | 1.95x | 1.99x | 1.34x | 1.16x | 1.64x | 1.61x |
| Source: Company Financials, Yahoo Finance, Author’s Estimates | ||||||
Multiplying the average P/TB multiple with the forecast tangible book value per share of $9.37 gives a target price of $15.1 for the end of 2022. This price target implies a 9.0% upside from the March 16 closing price. The following table shows the sensitivity of the target price to the P/TB ratio.
| P/TB Multiple | 1.41x | 1.51x | 1.61x | 1.71x | 1.81x |
| TBVPS – Dec 2022 ($) | 9.37 | 9.37 | 9.37 | 9.37 | 9.37 |
| Target Price ($) | 13.2 | 14.2 | 15.1 | 16.1 | 17.0 |
| Market Price ($) | 13.9 | 13.9 | 13.9 | 13.9 | 13.9 |
| Upside/(Downside) | (4.5)% | 2.2% | 9.0% | 15.8% | 22.5% |
| Source: Author’s Estimates |
The stock has traded at an average P/E ratio of around 13.7x in the past, as shown below.
| FY17 | FY18 | FY19 | FY20 | FY21 | Average | |
| Earnings per Share ($) | 0.58 | 0.75 | 0.87 | 0.93 | 1.21 | |
| Average Market Price ($) | 11.7 | 11.8 | 10.7 | 8.4 | 13.2 | |
| Historical P/E | 20.3x | 15.8x | 12.2x | 9.0x | 10.9x | 13.7x |
| Source: Company Financials, Yahoo Finance, Author’s Estimates | ||||||
Multiplying the average P/E multiple with the forecast earnings per share of $1.21 gives a target price of $16.5 for the end of 2022. This price target implies a 19.1% upside from the March 16 closing price. The following table shows the sensitivity of the target price to the P/E ratio.
| P/E Multiple | 11.7x | 12.7x | 13.7x | 14.7x | 15.7x |
| EPS 2022 ($) | 1.21 | 1.21 | 1.21 | 1.21 | 1.21 |
| Target Price ($) | 14.1 | 15.3 | 16.5 | 17.7 | 18.9 |
| Market Price ($) | 13.9 | 13.9 | 13.9 | 13.9 | 13.9 |
| Upside/(Downside) | 1.6% | 10.4% | 19.1% | 27.8% | 36.5% |
| Source: Author’s Estimates |
Equally weighting the target prices from the two valuation methods gives a combined target price of $15.8, which implies a 14.0% upside from the current market price. Adding the forward dividend yield gives a total expected return of 17.2%. Hence, I’m maintaining a buy rating on Valley National Bancorp.
Be the first to comment