

USD/JPY Analysis:
- USD/JPY prolongs rise after a strong showing in USD into early trading on Monday
- After such a drastic move, USD/JPY may see ST pullback: over-bought (RSI)
- Client Sentiment supports a continuation of the bullish theme
US Dollar and US 10 Year Treasury Yields Rise
The US dollar has strengthened against many of its peers in the wake of the elevated 10-year US treasury yield, which hit 1.6% during early trade on Monday. The relatively high yield remains at similar levels which may be the result of the recently approved $1.9 trillion stimulus package through the US Senate.
The sell-off in bonds could potentially be interpreted as an indication of optimism around an expected economic recovery, as investors and institutions tend to become more risk-seeking in an attempt to maximize returns.
Chart prepared by Richard Snow. Source: Tradingview
USD/JPY Risk Events in the Week Ahead
Major risk events for the USD/JPY pair include Japanese Q4 GDP on Tuesday and US inflation data for February.

For all market-moving data releases and events see the DailyFX Economic Calendar
Key Technical Levels for USD/JPY
The recent break above the resistance (topside of the bullish channel) adds to the bullish posture of the market since the January swing low. The recent move however has thrown the relative strength index (RSI) well into overbought territory which may result in a short term pullback towards trendline support (previous resistance) around the 108.00 or even 107.80 level. However, this may serve as a launchpad for bulls to enter the market as it may offer a better entry level.
It must also be noted that Fed Chair Jerome Powell, did little to address the surging bond yields which may support the current bullish move even higher. Market participants will however monitor the press conference following the Federal Open Market Committee (FOMC) meeting next week regarding the official position of the Fed on current bond yields, recent dollar strength and inflation expectations. The nearest levels of resistance stand at 109.30 and 109.85.
USD/JPY Daily Chart
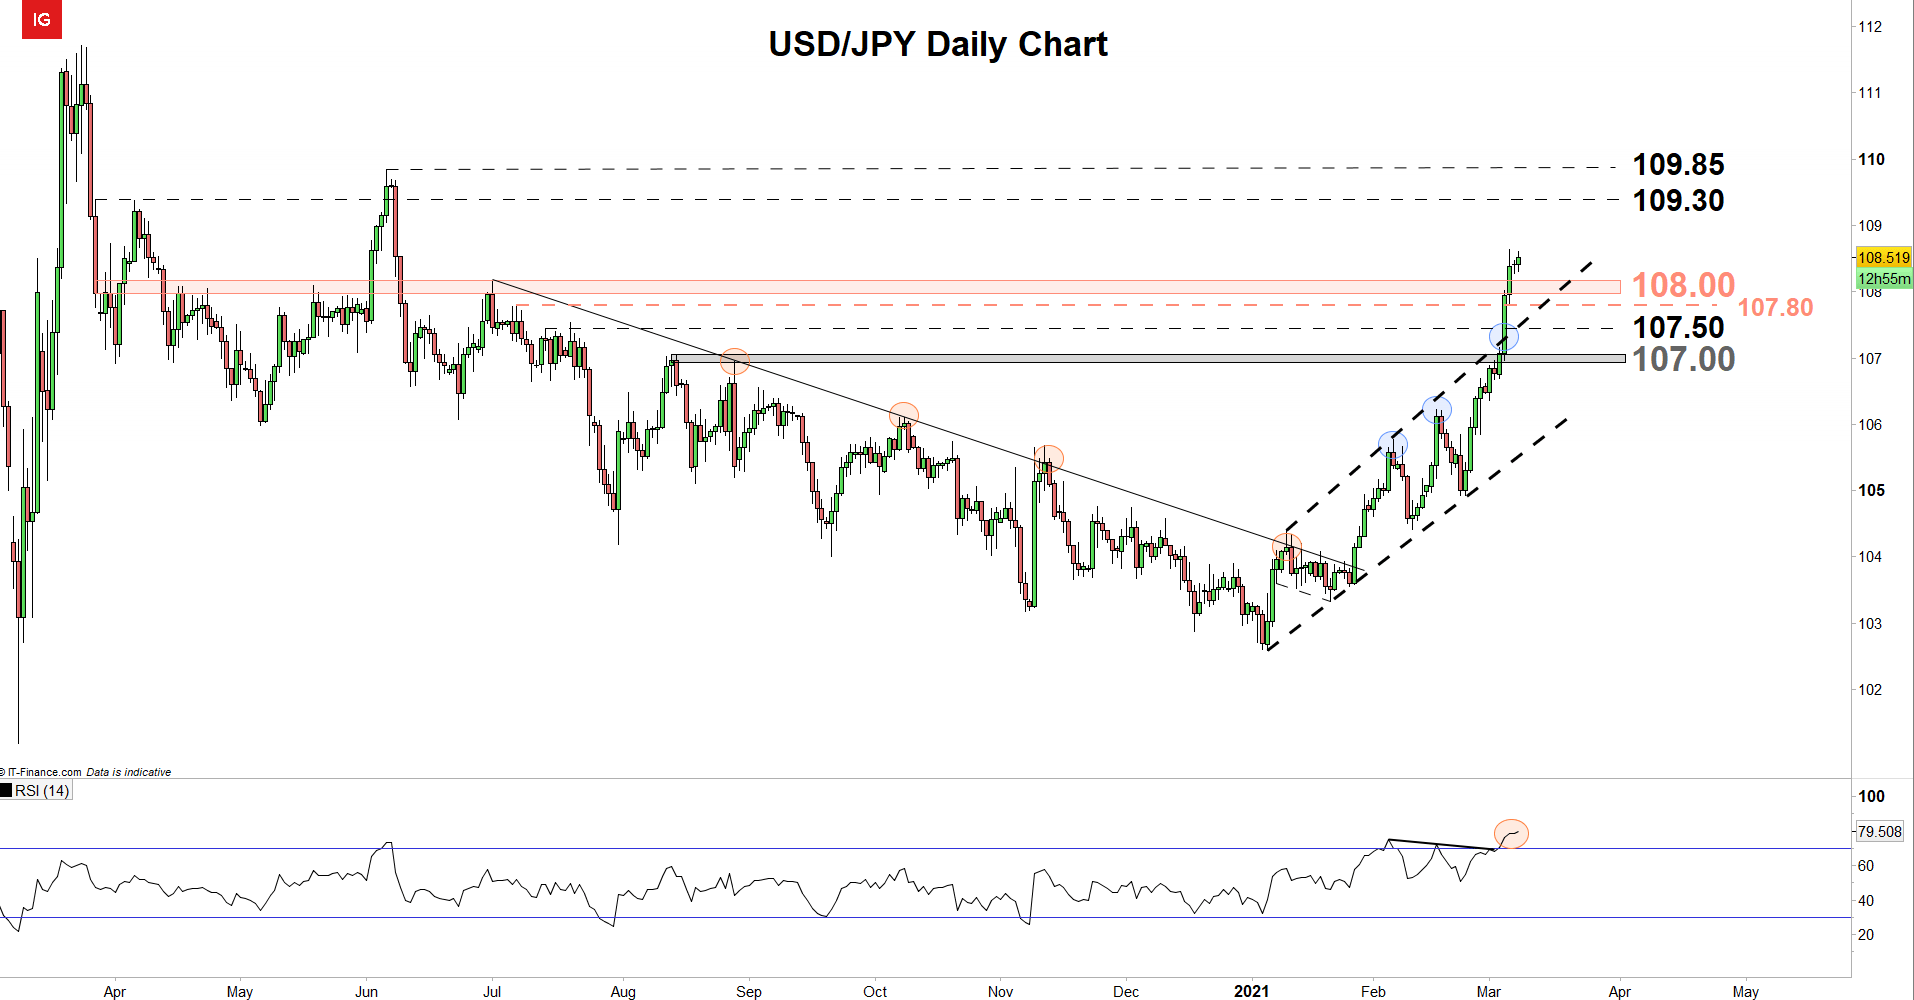
Chart prepared by Richard Snow, IG

Recommended by Richard Snow
See what our analysts forecast for JPY
IG Client Sentiment Points to Continued Bullish Momentum
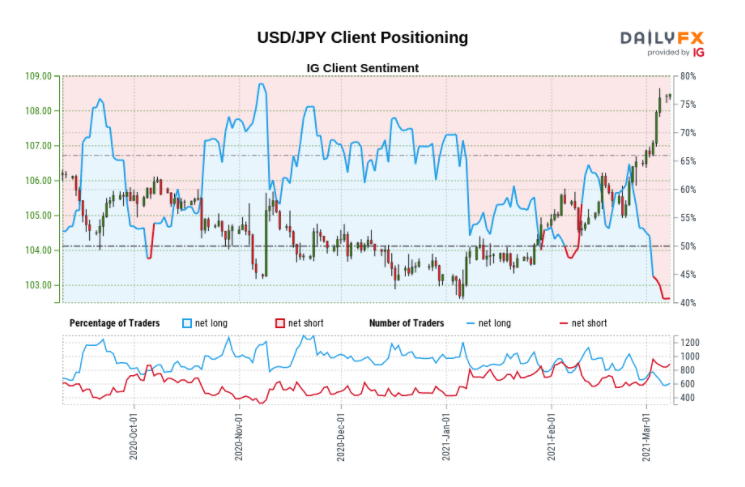
- USD/JPY: Retail trader data shows 40.45% of traders are net-long with the ratio of traders short to long at 1.47 to 1.
- We typically take a contrarian view to crowd sentiment, and the fact traders are net-short suggests USD/JPY prices may continue to rise.
| Change in | Longs | Shorts | OI |
| Daily | 25% | 12% | 17% |
| Weekly | -9% | 28% | 9% |
- The number of traders net-long is 11.81% higher than yesterday and 9.80% lower from last week, while the number of traders net-short is 12.72% higher than yesterday and 39.82% higher from last week.
- Traders are further net-short than yesterday and last week, and the combination of current sentiment and recent changes gives us a stronger USD/JPY-bullish contrarian trading bias.
— Written by Richard Snow for DailyFX.com
Contact and follow Richard on Twitter: @RichardSnowFX
Be the first to comment