

USD/ZAR ANALYSIS
- U.S. 10Y treasury yields coming off yesterday’s highs
- Numerous economic announcements scheduled later today
- Possible inside bar candle pattern on the horizon
RAND FUNDAMENTAL BACKDROP
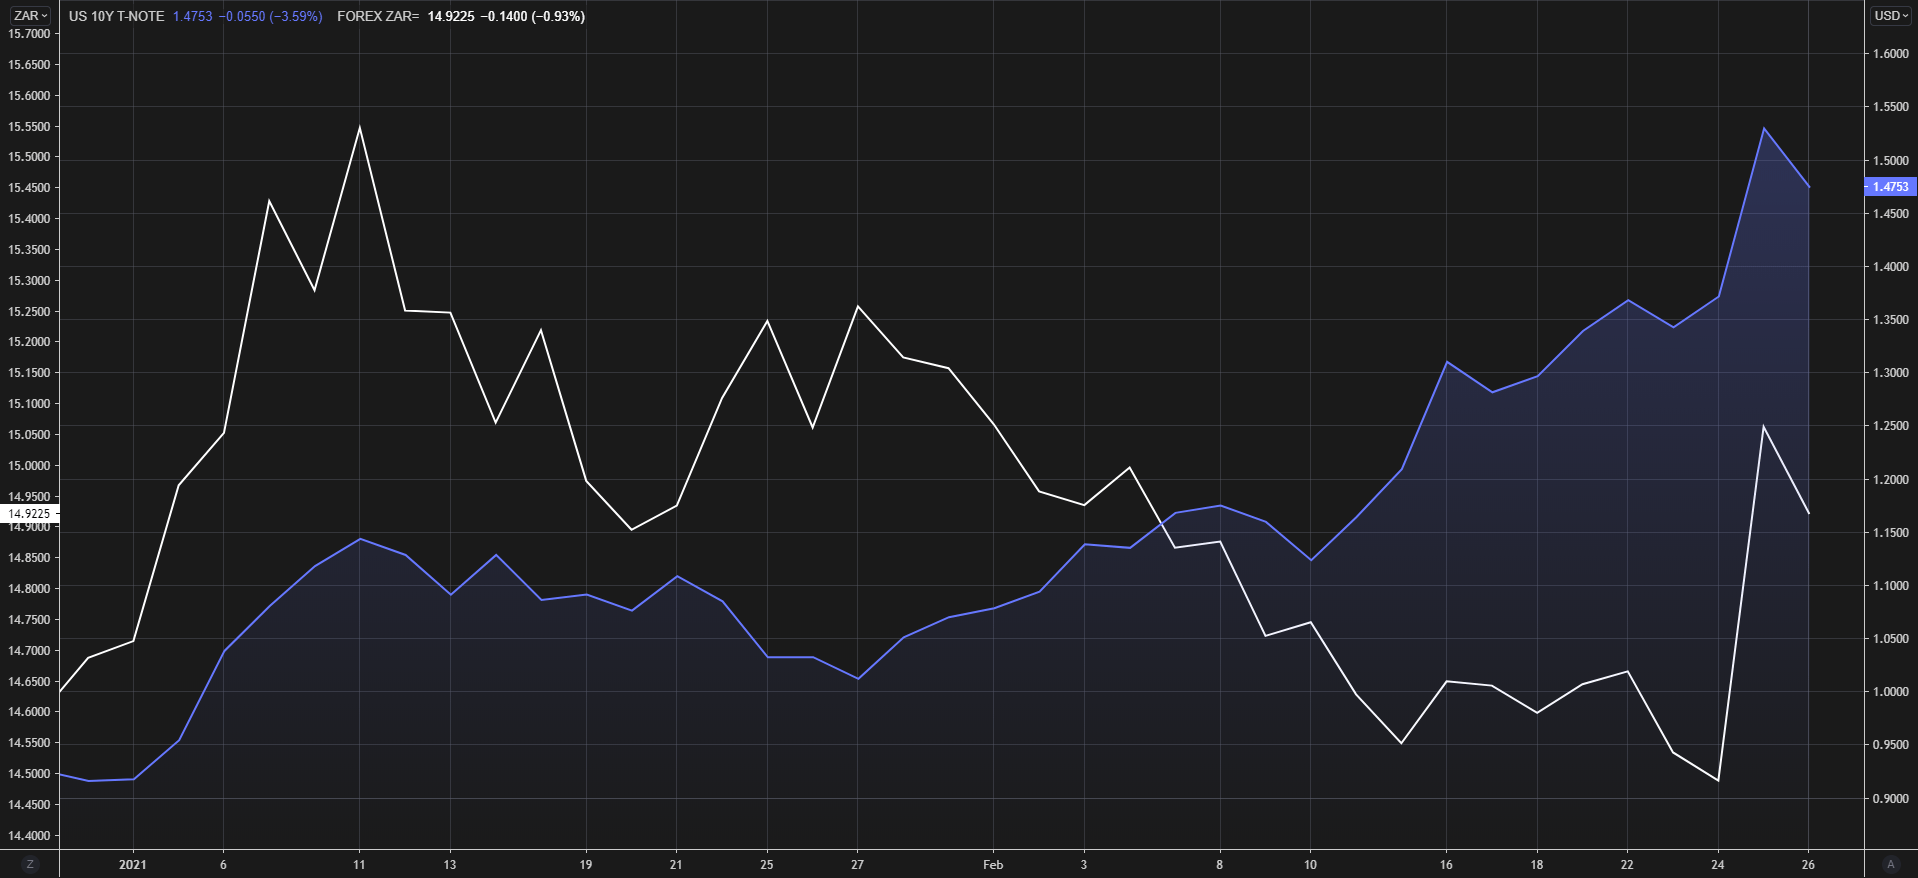
The Rand gave back most of its February gains yesterday as U.S. yields surged following poor bids in the U.S. government debt auction. This demonstrates the powerful correlation between the bond and FX market respectively. FX markets usually follow suit from the bond market and the correlation is reflected in the chart below.
U.S. BENCHMARK 10Y TREASURY YIELD vs USD/ZAR SPOT RATE (2021)
Chart prepared by Warren Venketas, Refinitiv
Emerging Market (EM) currencies across the globe tumbled against the greenback with the South African Rand being one of the standouts. This slide underlines the power of the U.S. Dollar on EMs and how susceptible they can be to external factors. The Rand held its own after the National Budget Speech earlier this week which outlined many detrimental ZAR factors however, a spike in U.S. treasury yields withered away any recent gains.
This being said, an injection of liquidity via the U.S. stimulus package could halt USD gains in the weeks to come which could be positive news for risk seeking investors, and consequently Rand bulls.
ECONOMIC ANNOUNCEMENTS
Later today there are several economic releases which could cause price volatility on the USD/ZAR pair. With the Dollar being in the spotlight today, U.S. based announcements will likely be more influential on the pair as opposed to South Africa’s balance of trade data. However, any notable deviation from estimates could result in significant price fluctuations.
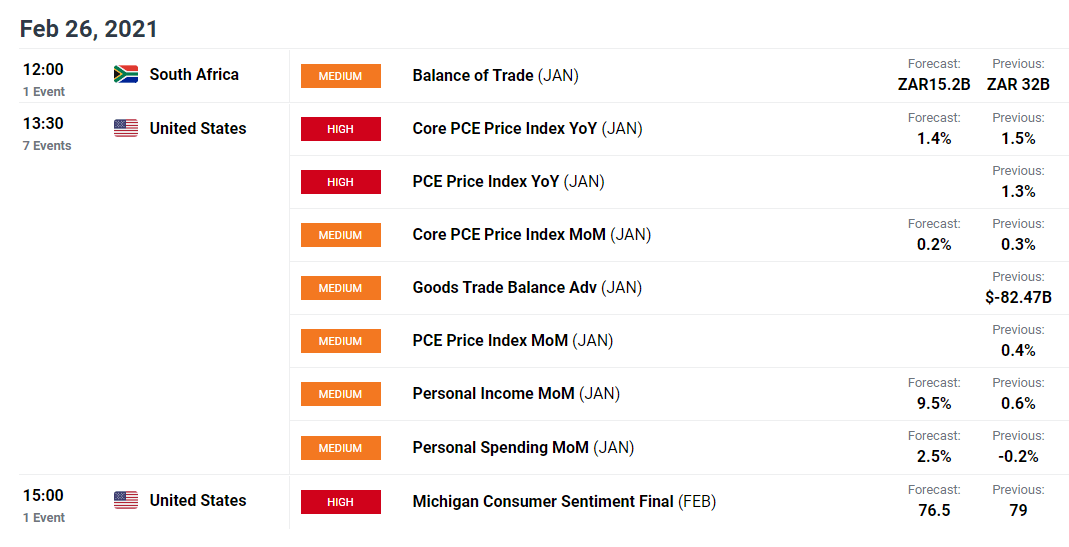
Source: DailyFX economic calendar

Recommended by Warren Venketas
Trading Forex News: The Strategy
TECHNICAL ANALYSIS
USD/ZAR DAILY CHART
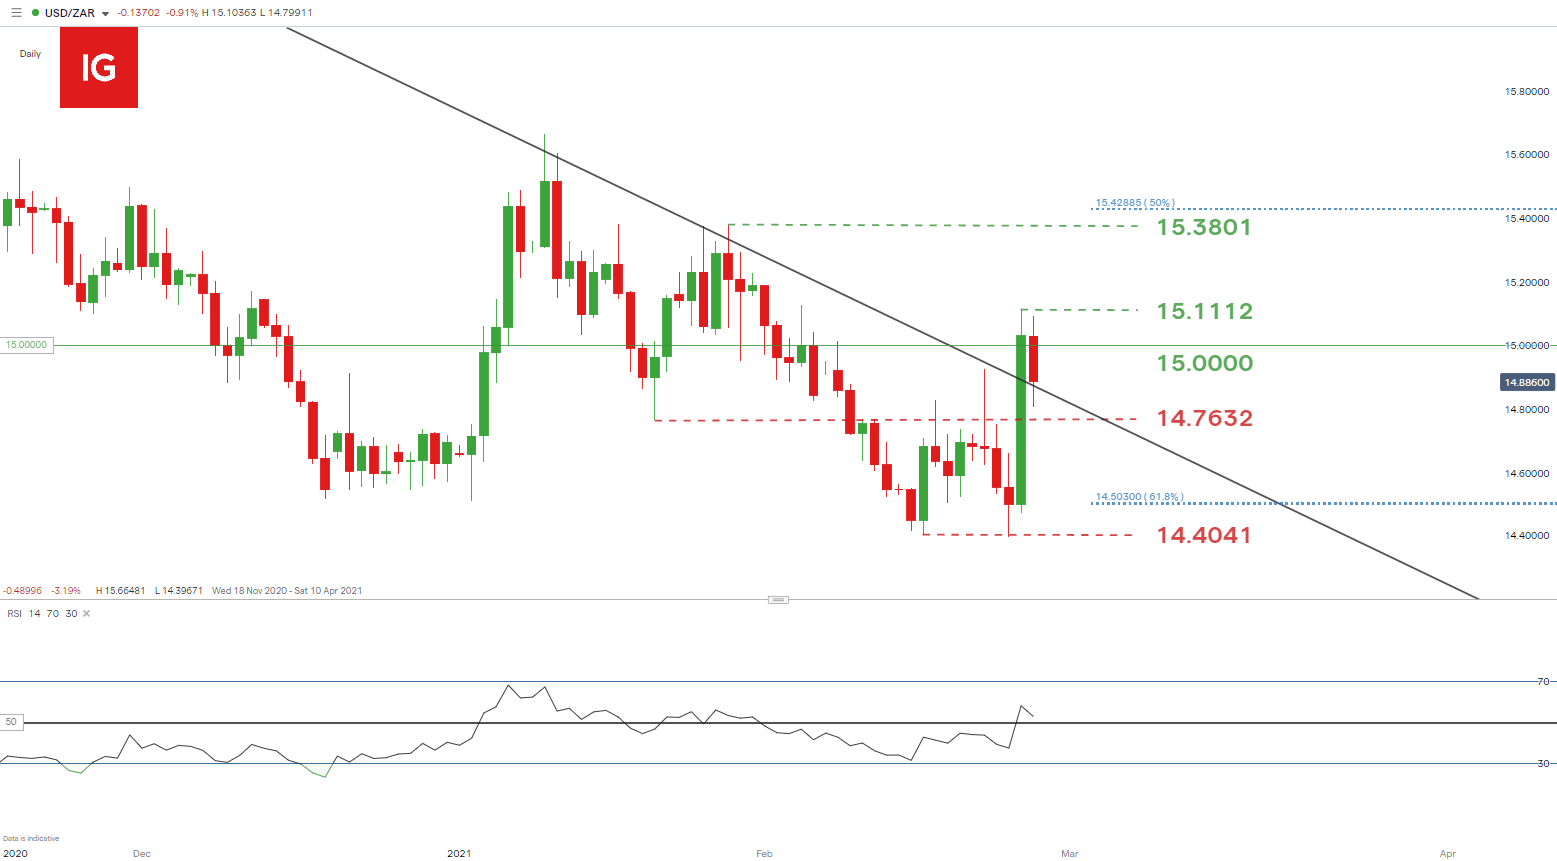
Chart prepared by Warren Venketas, IG
USD/ZAR bulls smashed through the 15.0000 psychological resistance zone yesterday eradicating most of February’s downside move. This short-term reversal breached above the medium-term trendline resistance (black) as well which has held since September 2020. This breach is significant in that it may signal a longer term momentum shift.
The Relative Strength Index (RSI) has moved above the 50 level suggestive of a bullish bias on the pair. This may be short-lived as the upward push was driven primarily by one factor (U.S. yields) with a pullback lower to ensue.
An interesting candle formation to look forward to at market close would be the inside bar. The inside bar is a simple two candle formation where the todays candle high and low is completely covered by the high and low of the preceding candle (yesterday) high and low. This pattern can lead toa trend reversal or continuation depending whether price breaks above or below the preceding candle high or low.
From the bullish perspective, a close above 15.0000 could see yesterday swing high come into focus once more.
The more likely correction may ensue with the key 14.7632 area of confluence serving as initial support and the 14.5000 zone to follow.
Starts in:
Live now:
Mar 02
( 18:03 GMT )

Keep up to date with price action setups!
Trading Price Action
USD/ZAR: KEY TECHNICAL POINTS TO CONSIDER
- Trendline resistance break
- 15.0000 horizontal resistance
- RSI momentum shift
— Written by Warren Venketas for DailyFX.com
Contact and follow Warren on Twitter: @WVenketas
Be the first to comment