

USD/JPY ANALYSIS
USD/JPY FUNDAMENTAL BACKDROP
The Yen has extended its depreciation against the U.S. Dollar reaching yearly highs this week after optimism around vaccine efficacy buoyed the greenback. In addition, rising inflation and optimism around the U.S. stimulus package has sustained the rise in U.S. treasury yields which has in turn boosted the Dollar.
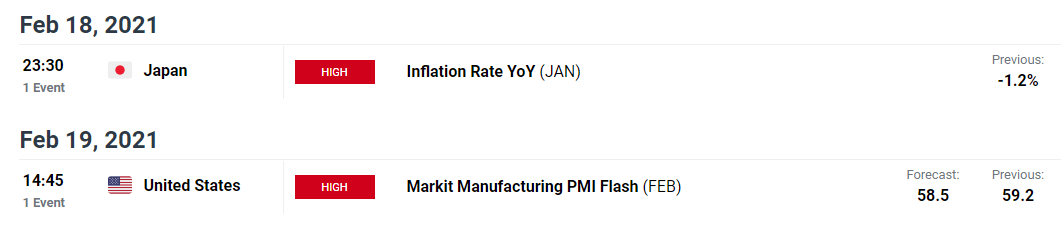
Japanese inflation data is expected later tonight (23:30GMT) while PMI data in the U.S. will be in focus tomorrow. Both events have the potential to cause significant price fluctuations should actual data deviate from expectations.
Source: DailyFX Economic Calendar

Recommended by Warren Venketas
Trading Forex News: The Strategy
JAPANESE INFLATION vs USD/JPY
Inflation figures in Japan has been steadily declining throughout 2020 with the USD/JPY pair following suit (see chart below). This makes theoretical economic sense as lower inflation leads to a stronger local currency. With the Yen taking a turn in 2021, this could be a leading indicator as to the likely result of inflationary data later today. That is, a higher figure than previous December data.
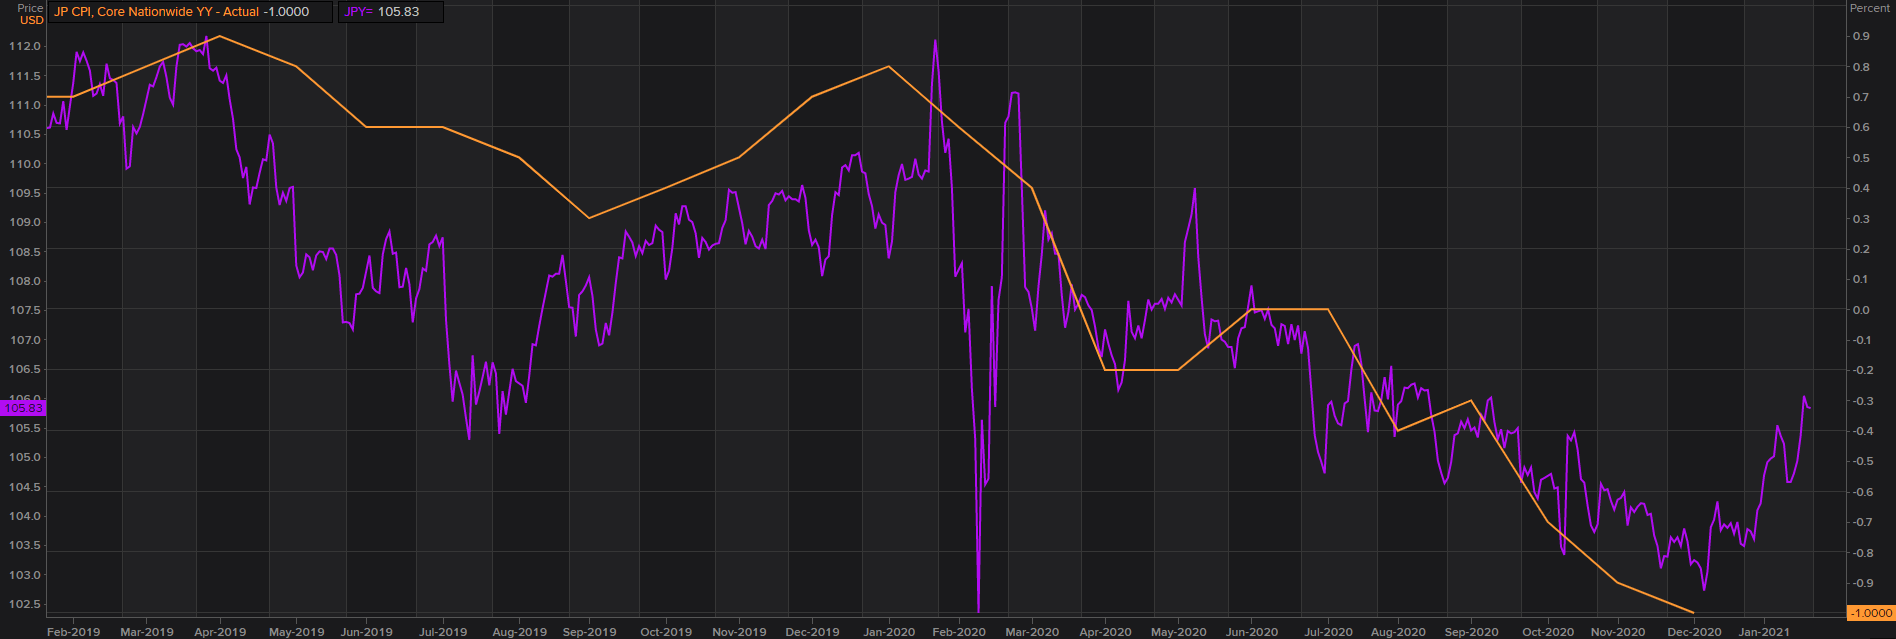
Chart prepared by Warren Venketas,Refinitiv
USD/JPY OPTIONS EXPIRIES
Notable options expiries (see below)on USD/JPY today are also expected which could see a battle between stakeholders of the respective strikes. Generally, large options expiries are preceded by price moves toward the particular strike as it approaches expiration as investors push for their options contracts to expire in the money.
February 18, 2021:
- 104.95 – 105.00 (600M)
- 105.95 – 106.00 (1BLN)
Source: Refinitiv
USD/JPY TECHNICAL ANALYSIS

Recommended by Warren Venketas
Get Your Free JPY Forecast
USD/JPY Daily Chart:
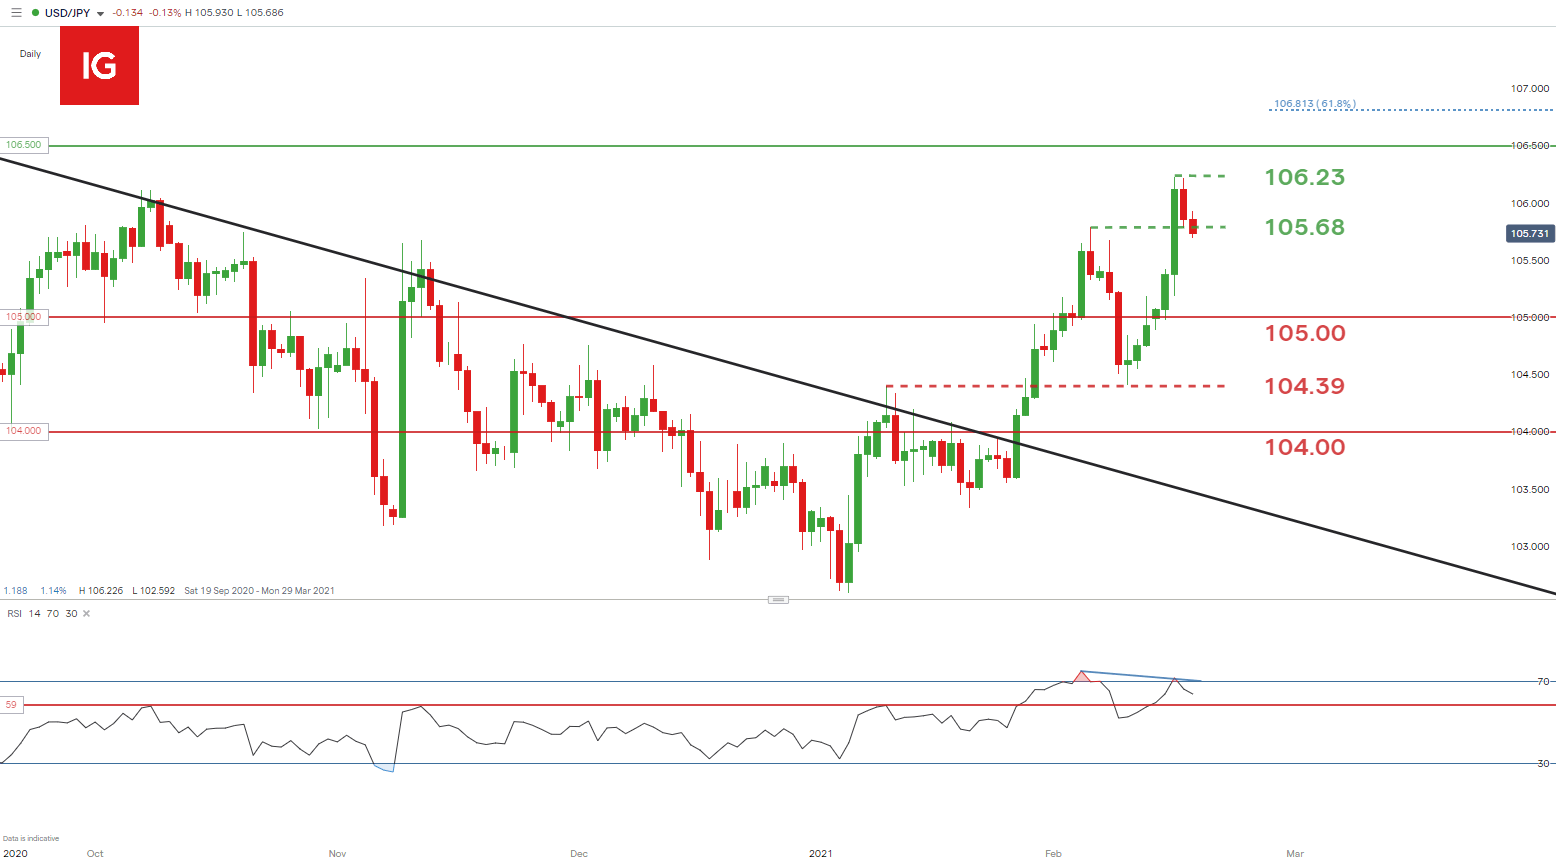
Chart prepared by Warren Venketas, IG
This week USD/JPY pushed above prior resistance and February swing high at 105.68 – now turned support. The Relative Strength Index (RSI) is in overbought territory and indicates a divergence (blue) between spot prices and the momentum indicator. This means that bullish momentum may be slowing and could suggest a price reversal against the short-term uptrend (technically referred to as bearish divergence).
Should bearish divergence unfold, the 105.00 psychological level will serve as initial support with the 104.39 area of confluence to follow.
The bullish perspective could see this weeks swing high at 106.23 being targeted once again with the 106.50 and 106.81 (61.8% Fibonacci retracement level) to ensue. Bulls may look for price rejection below current support at 105.68 before looking to enter.
Key technical points to consider:
Starts in:
Live now:
Dec 21
( 18:12 GMT )

Keep up to date with price action setups!
Trading Price Action
IG CLIENT SENTIMENT TENTATIVE ON DIRECTIONAL BIAS
| Change in | Longs | Shorts | OI |
| Daily | -2% | 6% | 2% |
| Weekly | -26% | 18% | -10% |
IGCS shows retail traders are currently net long on USD/JPY, with 53% of traders currently holding long positions (as of this writing). At DailyFX we typically take a contrarian view to crowd sentiment however, the change in net longs and shorts result in a mixed signal.
— Written by Warren Venketas for DailyFX.com
Contact and follow Warren on Twitter: @WVenketas
Be the first to comment